Whitehall Monitor 2023 (Part 1): The size, cost and make-up of the civil service
This part of Whitehall Monitor 2023 analyses the ways in which the civil service changed in 2022 and what these changes mean for its priorities.

The first part of this report analyses how the civil service changed in 2022. It looks specifically at the size, structure, location and turnover of the civil service; budgets, spend and costs; diversity; and the skills, professions and functions of civil servants. For each we identify what these changes mean for the priorities of the civil service and the challenges it will face in 2023.
Size, structure, location and turnover
The growth of the civil service has plateaued
The recent expansion of the civil service slowed in 2022. At the time of the EU referendum in June 2016 the civil service had 384,230 full-time equivalent (FTE) roles, the smallest it had been since the Second World War after six years of retrenchment as a result of Cameron-era cuts. Over the following six years it grew by 25% – or nearly 95,000 roles – as the government prepared for Brexit, resourced new permanent post-Brexit responsibilities and, from 2020, responded to the Covid pandemic.
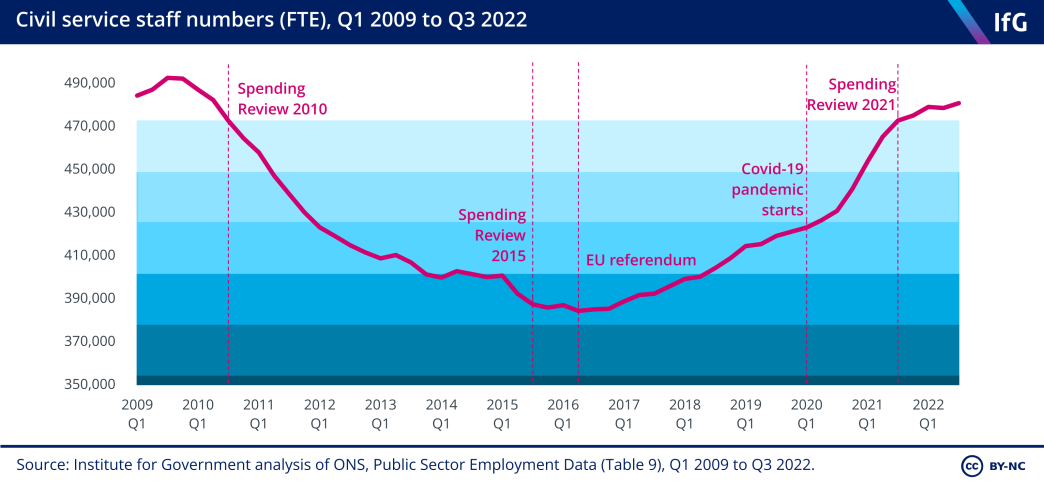
In the October 2021 spending review, ministers agreed a target to reduce the civil service headcount to pre-pandemic levels by 2024/25. 73 HM Treasury, ‘Autumn Budget and Spending Review 2021: documents’, 27 October 2021, www.gov.uk/government/publications/autumn-budget-and-spending-review-2021-documents Before he left office in 2022 Boris Johnson went further, pledging a reduction instead to levels prior to the 2016 EU referendum, which at the time meant a reduction of 91,000 roles. 74 Clyne R, ‘Civil service cuts will force ministers to choose between painful options’, blog, Institute for Government, 13 May 2022, www.instituteforgovernment.org.uk/article/comment/civil-service-cuts-will-force-ministers-choose-between-painful-options Ministers argued that the civil service could unwind the growth of recent years now the UK had left the EU and the acute phase of the pandemic had ended.
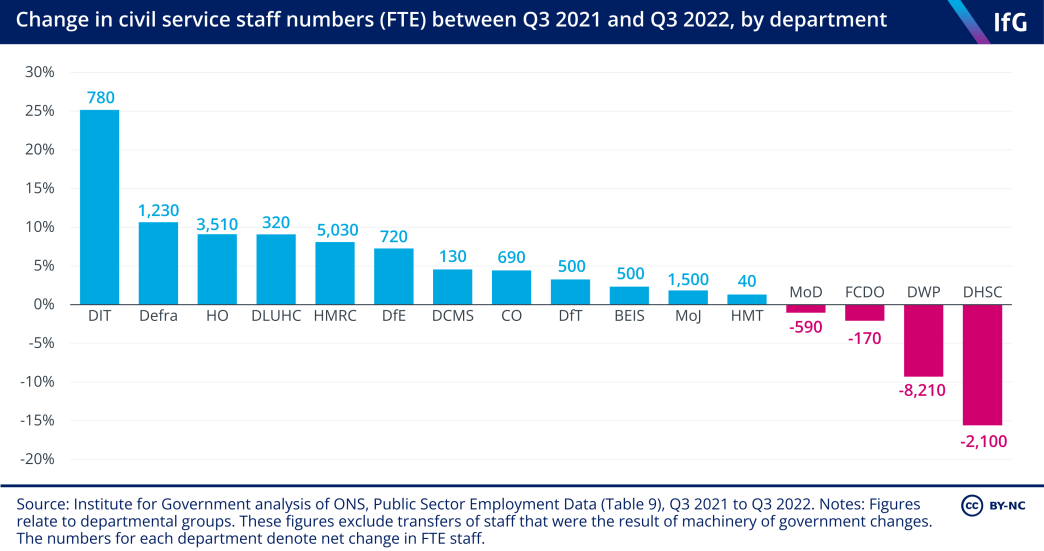
However, over the 12 months to September 2022 most departments continued to grow, though this did slow over the course of the year and MoD, DWP, DHSC and FCDO all shrank in that time.* In part this was due to departments disbanding temporary roles created to manage Covid pressures. This was particularly true for DHSC, which reduced by more than 2,000 roles after more than 4,000 roles were created during the pandemic (at its height an expansion of 46%). The reduction of staff in FCDO marks a continuation of a trend since the merger of FCO and DfID in 2020. Elsewhere, the slowing down of workforce expansion was at least in part the result of recruitment freezes introduced in response to ministers’ 2021 headcount target.
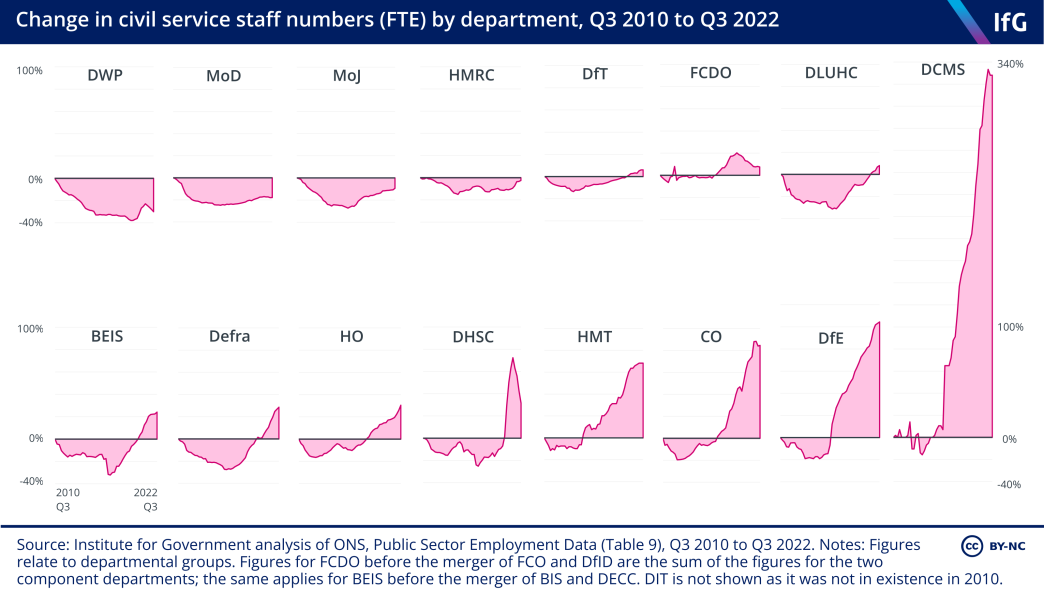
Most departments are now bigger than they were in 2010. However, the retrenchment then growth of the civil service has been experienced differently by big, operational departments than it has been by smaller, policy-focused ones. For both it has set the context in which they manage their workforces.
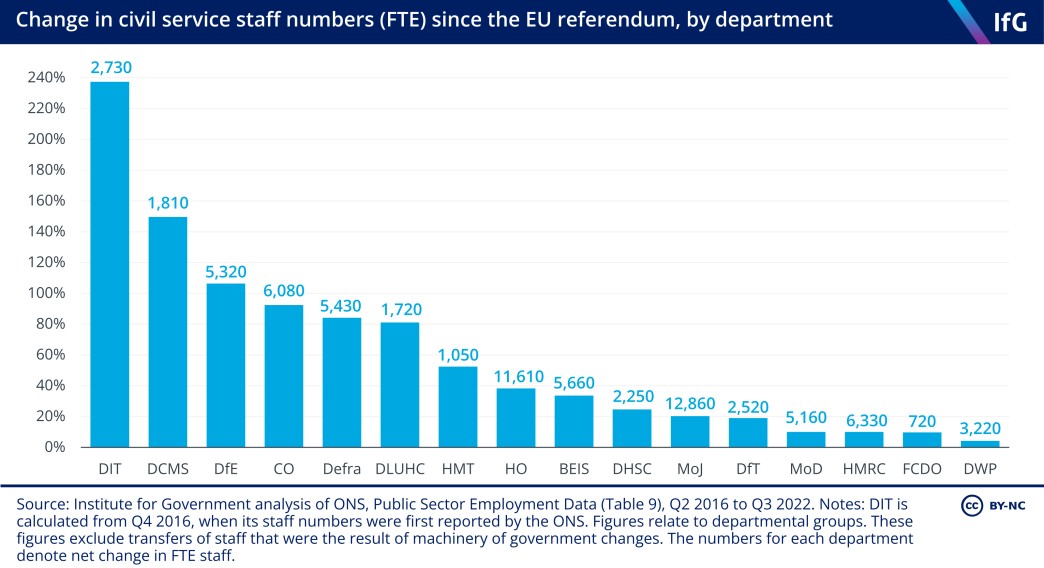
Smaller, policy-focused departments without large operational teams experienced the biggest proportional increases since the EU referendum. DIT, DCMS, DfE, the Cabinet Office, Defra and DLUHC all increased by over 80% between 2016 and 2022, though each still has fewer than 20,000 civil servants in their core department and public bodies.
By contrast, large operational departments with front-line services bore the biggest staffing cuts in the early 2010s, making growth after 2016 less striking. For example, while many did grow in absolute numbers after the referendum – MoD, HMRC and MoJ each now has more than 5,000 more officials than in 2016 – this amounts to proportionally smaller growth as they were adding to workforces of in many cases more than 50,000. DWP, MoD, MoJ and HMRC are each smaller than in 2010.
The Home Office is the only large, operational department to buck this trend. Its 31% growth since September 2010 largely reflects the additional capacity required to administer migration, citizenship and borders services as a result of the UK leaving the EU.
*A list of departmental initialisms is found at the end of this report. For the purposes of reporting staff numbers, we categorise organisations into departmental groups based on where ministerial responsibility lies. For further information about how we do this, see the Methodology.
Turnover is at record highs after falling during the pandemic
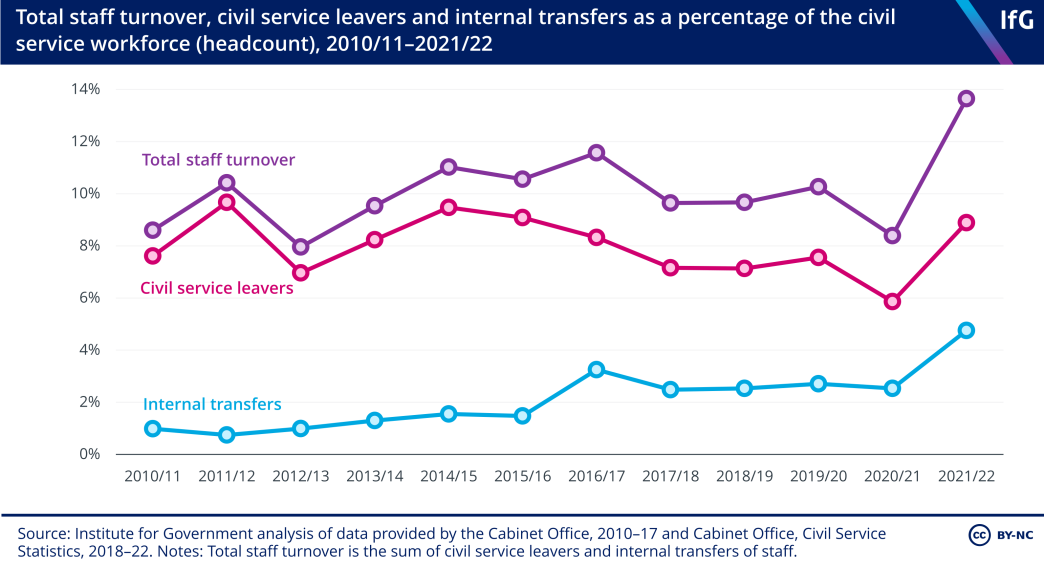
Between March 2021 and March 2022, some 13.6% of civil servants either moved between departments or left the civil service entirely – the highest level in at least a decade. High turnover damages productivity, undermines subject knowledge and expertise, disrupts projects and increases the resources required for recruitment
and training.
87
Sasse T and Norris E, Moving On: The costs of high staff turnover in the civil service, Institute for Government, 2019, www.instituteforgovernment.org.uk/publications/moving-on-staff-turnover-civil-service
This level of turnover is an increase of 5.2 percentage points compared to 2020/21, when lower turnover was driven by fewer staff leaving the civil service than in previous years while the percentage of internal transfers remained constant. This was caused, in large part, by economic uncertainty related to the pandemic, which incentivised people to remain in stable employment (this was also seen in the private sector). 88 Joyce R, Postel-Vinay F, Spittal P and Xu X, Job opportunities after the pandemic, Institute for Fiscal Studies, 2022, https://ifs.org.uk/publications/job-opportunities-after-pandemic, pp. 12–13.
But the proportion of officials leaving the civil service increased significantly even above pre-pandemic levels in 2021/22 to reach its highest level since 2015/16. Internal turnover, having remained stable at around 2.5% between 2017/18 and 2020/21, has also increased, almost doubling to 4.8% of the total workforce. This is notably higher than the previous peak of 3.2% in 2016/17, which was associated with organisational changes following the EU referendum, not least the creation of new Brexit and international trade departments. Internal turnover is now nearly five times higher than it was in 2010/11, when only 1% of the civil service workforce left for a role in another department.
These numbers reflect several at least partly mitigating factors. First, as noted, departments have unwound temporary roles created to respond to the pandemic, inevitably leading to internal turnover. Similarly, pent-up demand to move jobs was released after many staff ‘sat tight’ during the acute phase of the pandemic. 89 Joyce R, Postel-Vinay F, Spittal P and Xu X, Job opportunities after the pandemic, Institute for Fiscal Studies, 2022.
However, there are more concerning factors the government should take note of. Some turnover stems from declining staff satisfaction – with pay in particular (as covered in Part 2 of this report), and officials’ work more generally – which speaks to more systemic problems within the management of the civil service. In addition these figures, while already striking, present a major underestimate of civil service internal movement, because they record only internal transfers between departments, not the far higher number of transfers that happen within departments. These moves, for which there is no publicly available data, are less destabilising than outward moves, but nevertheless are resource-intensive, and hinder institutional memory.
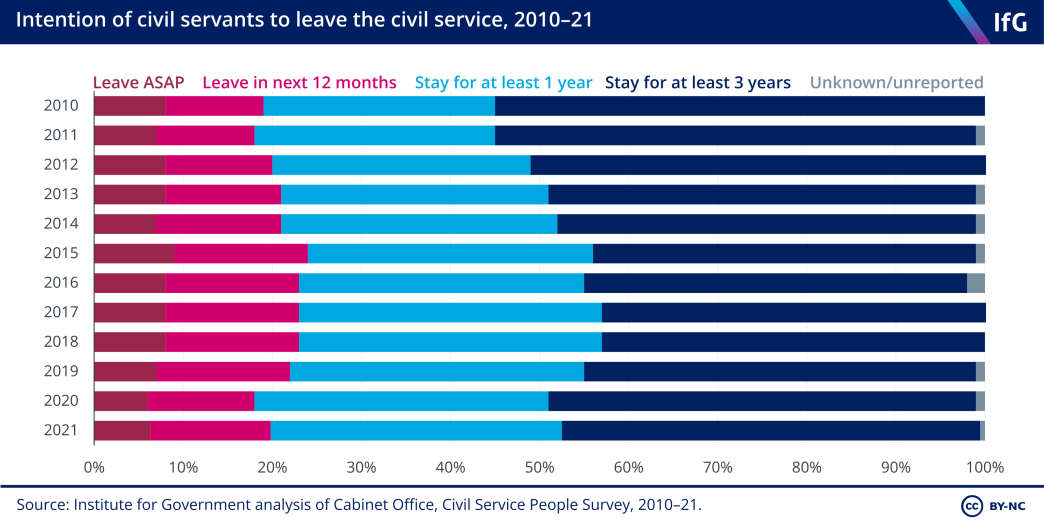
Trends for civil servants’ employment intentions suggest that the number of leavers will be higher in the coming years than during the pandemic. In October 2020, 18% of civil servants intended to leave in the next 12 months or sooner, the smallest proportion since 2011 – but in 2021 this rose to 20%. And fewer than half (47%) intend to stay for at least three years, suggesting continued appetite to move in the medium term.
Turnover is higher in smaller, policy-focused departments
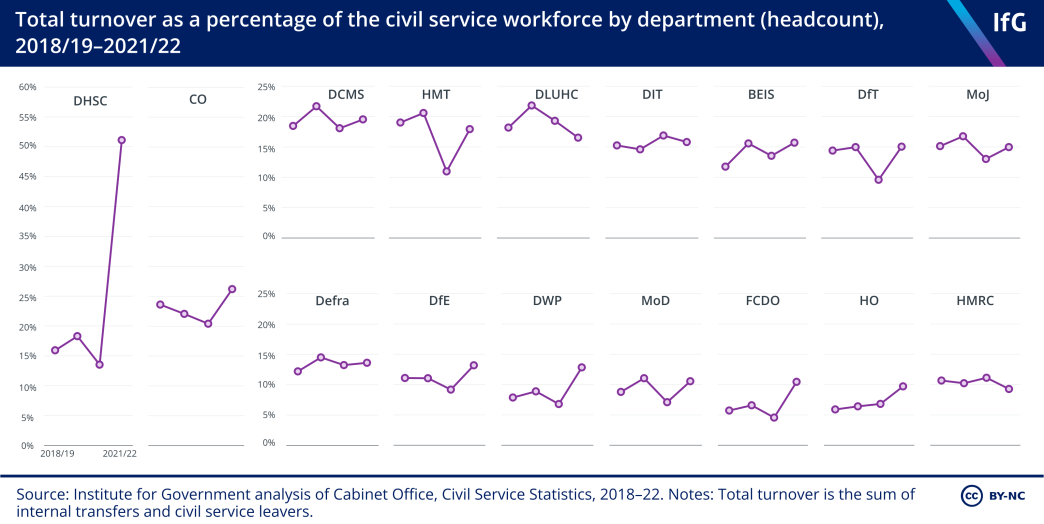
Larger, operational departments continue to have lower than average turnover – HMRC, the Home Office, MoD and DWP all have total turnover of below 13%, with the figure for HMRC decreasing by 1.8 percentage points in the last year. The MoJ is the only large operational department to buck this pattern, with total turnover of 15%.
Turnover at FCDO has historically been low but increased significantly last year from 5% to 10%. This in part reflects normal staff resourcing adjustments following the 2020 merger of the Foreign and Commonwealth Office with the Department for International Development – but the new department also faces particular problems with morale in the wake of the merger as it seeks to develop a new, coherent culture. 90 Urban J and Durrant T, How should the Foreign Office change now?, Institute for Government, 2022, www.instituteforgovernment.org.uk/publications/foreign-commonwealth-development-office
Smaller, policy-focused and less operational departments tend to have higher turnover. DHSC (51%), the Cabinet Office (26%), DCMS (20%), the Treasury (18%), DLUHC (17%), DIT (16%), BEIS (16%) and DfT (15%) each had turnover at or above 15%.
Turnover at DHSC increased from 14% to 51% from 2020/21 to 2021/22, largely driven by 1,310 of its staff transferring to another part of the civil service. This again reflects the department winding down some of its pandemic functions and sizeable recruitment. Potentially more concerning is high turnover at the Treasury, something the Institute for Government has previously identified as a particular problem because it undermines the department’s ability to take a long-term strategic view of government spending. 91 Sasse T and Norris E, Moving On: The costs of high staff turnover in the civil service, Institute for Government, 2019. Rates have nearly returned to pre-pandemic levels.
It is welcome that, to tackle high internal turnover, the civil service has introduced ‘minimum expected assignment durations’ for newly advertised senior civil service roles. 92 Trendall S, ‘”Compelling” communicator sought to lead government digital and data strategy’, Civil Service World, 11 January 2023, www.civilserviceworld.com/professions/article/cddo-deputy-director-job-advert-government-digital-data-strategy But previous research by the Institute suggests this measure is unlikely to control turnover unless disregarding it by leaving a role prematurely damages a civil servant’s reputation and prospects for future promotion, a standard that has not yet been established. 93 Urban J and Thomas A, Anything to declare? A progress report on the Declaration on Government Reform – and what should come next, Institute for Government, 2022, www.instituteforgovernment.org.uk/publications/government-reform-progress Nor does this move do anything to address turnover for the majority of officials, who are in ranks below the senior civil service.
The Institute has previously argued that the civil service should go further to provide stronger financial incentives to stay in post longer – via capability-based pay, bonuses for reaching significant project milestones or financial penalties for leaving earlier than the expected tenure length. 94 Urban J and Thomas A, Opening up: How to strengthen the civil service through external recruitment, Institute for Government, 2022, www.instituteforgovernment.org.uk/publications/civil-service-external-recruitment
An absence of major machinery of government changes left departmental structures largely unchanged
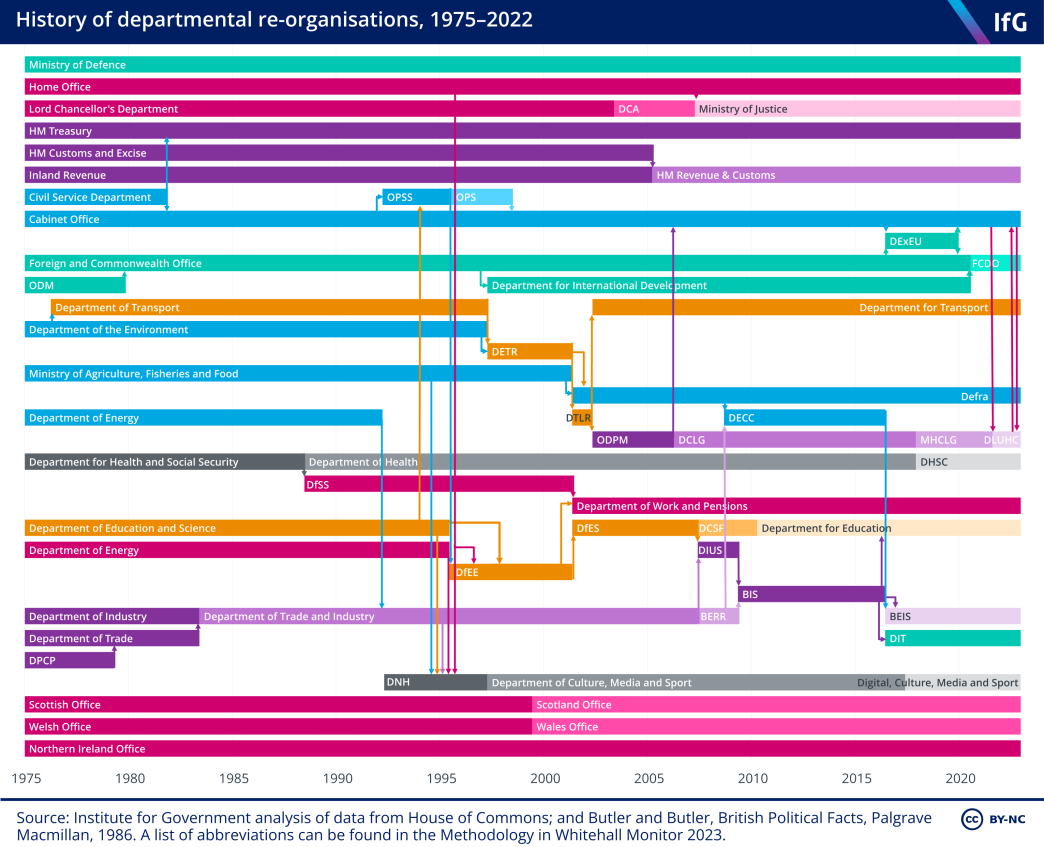
Prime ministers frequently restructure government departments as a way to signal their priorities inside and outside government, bring together related issues previously dealt with in different parts of government, allocate particular briefs to, and promote or demote, certain cabinet colleagues. New prime ministers in particular often use machinery of government changes soon after coming into office as a means of stamping their agenda on to Whitehall.
However, despite the UK having two new prime ministers in 2022 no major machinery of government changes were made. Rishi Sunak has not yet moved forward on reported plans for a ‘Brexit Delivery Department’, or on a dedicated Department for Energy, discussed during the first Conservative leadership contest in the summer 2022. 95 Rishi Sunak campaign, ‘Ready for Rishi: Brexit Delivery Department’, YouTube, 8 August 2022, www.youtube.com/watch?v=vf9O7mSxsTE 96 Thomas A, ‘Rishi Sunak pledges to reinstate separate Department for Energy’, Energy Voice, 20 July 2022, www.energyvoice.com/oilandgas/429169/rishi-sunak-energy-department-uk/ Nor did Liz Truss during her short premiership. This is welcome given the time-consuming, expensive and risky nature of machinery of government changes. 97 Durrant T and Tetlow G, Creating and dismantling government departments, Institute for Government, 2019, www.instituteforgovernment.org.uk/publications/creating-dismantling-government-departments ,* The only notable changes to the machinery of government in 2022 were repeated moves of teams working on the union and devolution between the Cabinet Office and DLUHC, and the Brexit opportunities unit between the Cabinet Office and BEIS. 98 Smith B, ‘Brexit Opportunities Unit follows Rees-Mogg to BEIS’, Civil Service World, 12 October 2022, www.civilserviceworld.com/professions/article/brexit-opportunities-unit-rees-mogg-beis-cabinet-officemove
*In 2022, for example, the Institute published research on the handling of the 2020 merger of FCO and DfID, which identified ongoing problems connected to the merger including poor morale, incompatible IT and pay systems, and confusion over departmental policy.
The civil service is starting to become less London-centric, but there is a long way to go
In the March 2020 budget the then chancellor, Rishi Sunak, announced that the government would be moving 22,000 civil service roles out of London by 2030 as part of its ‘places for growth’ programme. 104 HM Treasury, ‘Budget 2020: documents’, 11 March 2020, www.gov.uk/government/publications/budget-2020-documents, p. 49. This commitment was repeated in July 2021’s Declaration on Government Reform, which added that 50% of senior civil servants would be located outside the capital by the same date. 105 Cabinet Office, Declaration on Government Reform, 15 June 2021, www.gov.uk/government/publications/declaration-on-government-reform/declaration-on-government-reform The levelling up white paper further defined the latter ambition as 50% of UK-based senior civil servants. 106 Department for Levelling Up, Housing and Communities, Levelling Up the United Kingdom, CP 604, The Stationery Office, 2022, https://assets.publishing.service.gov.uk/government/uploads/system/uploads/attachment_data/file/1052706/Levelling_Up_WP_HRES.pdf
The government’s three aims for relocation are to:
- allow talented people who do not want to live or work in London to contribute more effectively to the civil service
- change the way policy is made by incorporating the diversity of experience
- of people who live outside London into decision making
- ‘level up’ deprived areas by relocating public sector jobs to those parts of the country.
The government has made some progress towards its 22,000 target. As of September 2022, some 8,396 roles had been relocated from London to locations across the UK, 107 Public Administration and Constitutional Affairs Committee, ‘Planning for the Future of the Government Estate inquiry’, written evidence from the Cabinet Office (FGE06), https://committees.parliament.uk/writtenevidence/114272/pdf/ including more than 200 senior civil servants.
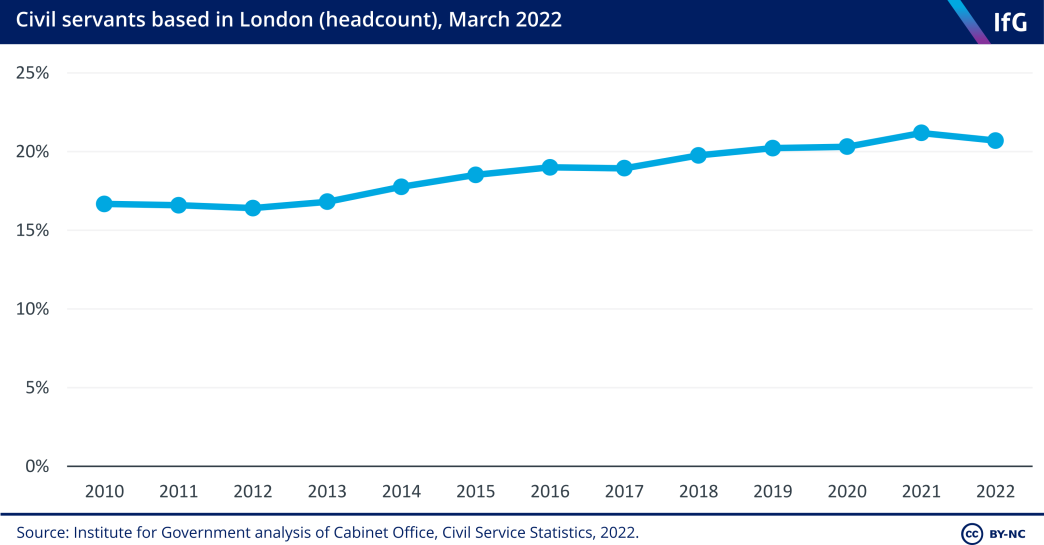
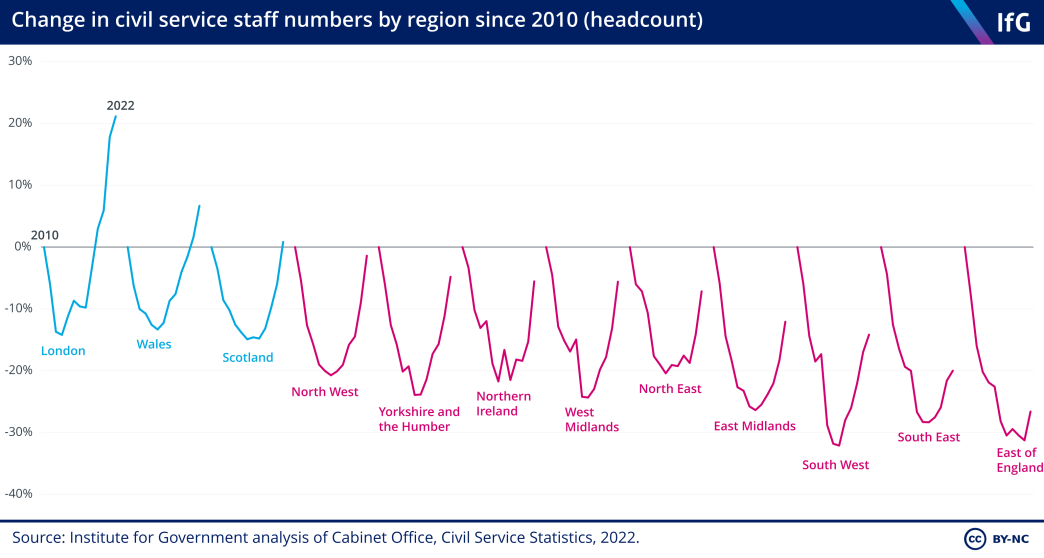
The commitment to relocation was made in the context of an increasingly London- centric civil service. London is one of only three regions that has more civil servants than there were when the coalition government was formed in 2010, alongside Wales and Scotland. New roles created following the EU referendum in 2016 and in response to the Covid-19 pandemic were heavily weighted towards London.
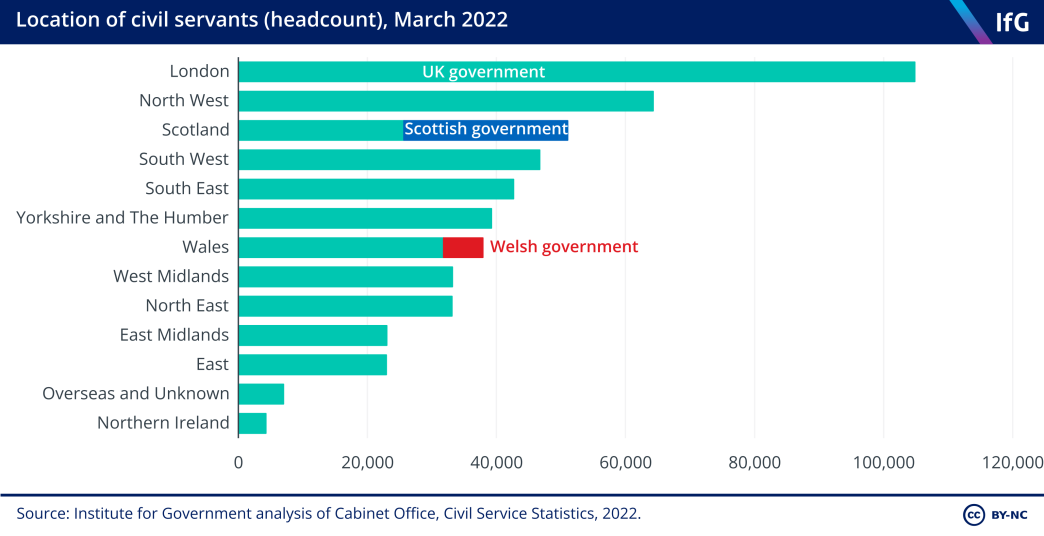
In absolute terms, London remains the region with the most civil servants (104,830) and Northern Ireland remains the region with the fewest (4,260). Half of roles in Scotland (49.7%) are part of the Scottish government, while 16.1% of roles in Wales are part of the Welsh government.
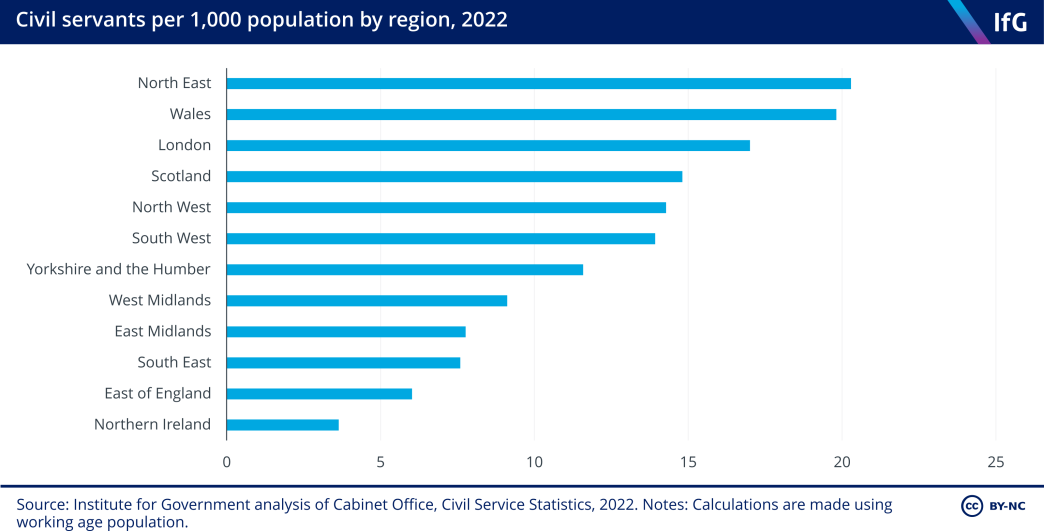
However, proportional to the working-age population of each region, London has the third most civil servants after the North East and Wales, which both have approximately 20 officials per 1,000 working-age people. Northern Ireland has the fewest with 3.6 civil servants per 1,000 working-age people.
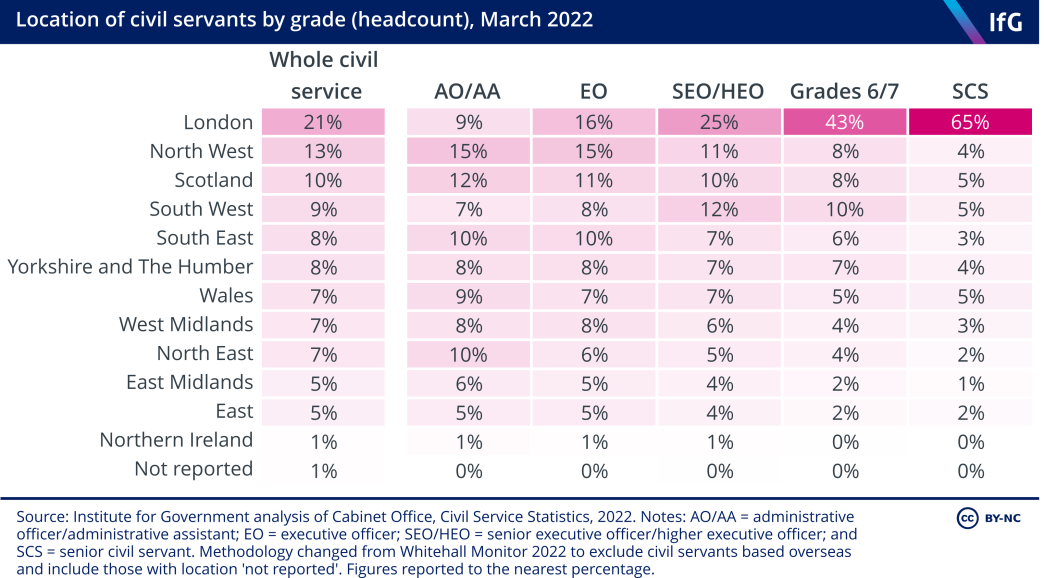
The London-centricism of the civil service is not determined solely by absolute or per head numbers, however. A disproportionate number of senior and policy officials work in the capital, which the government argues negatively affects the effectiveness of the civil service, reducing its ability to draw on high-quality talent from across the country and narrowing the civil service’s mindset.
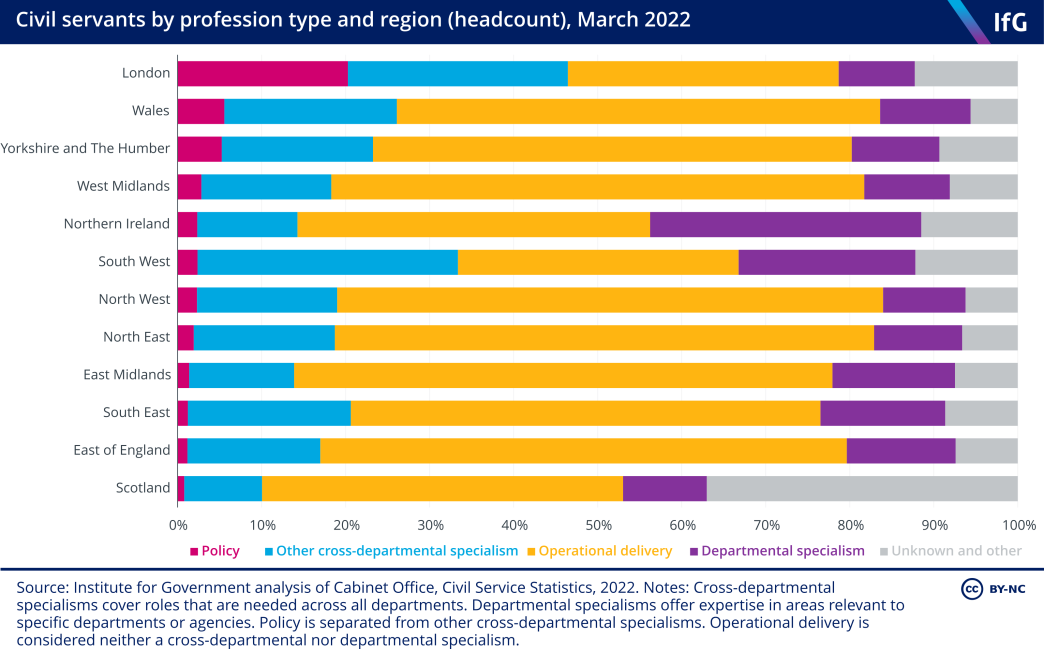
London is, for instance, the region with the greatest proportion of policy roles, exacerbated by the fact that the roles created in preparation for Brexit and in response to Covid were weighted towards the capital. One in five London-based civil servants work in policy; the next highest figure is in Wales, at just 5.6%. In contrast, London has the lowest proportion of officials in operational delivery, at 32.2%, compared to over 60% in the North West, North East, East Midlands, West Midlands and East of England.
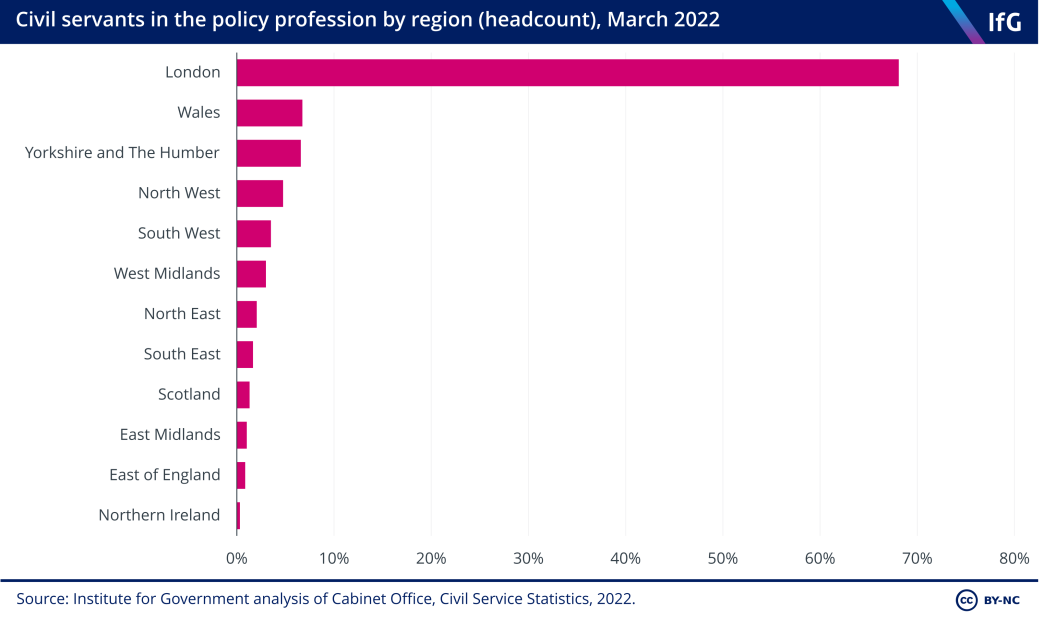
The relocations taking place as part of the ‘places for growth’ programme have slightly reduced the London-centricism of the policy profession. Around two thirds (68%) of all UK-based policy professionals are based in London, down from 72% in 2021. But no other region hosts more than 7%. While shifting roles does take time and the civil service has started to make some progress, increasing the regional diversity of the policy profession will be a challenge for the relocation agenda over the next year.
The relocation programme has also made some progress at reducing the proportion of the senior civil service (SCS) based in London, which has fallen from 67% in 2021 to 65% in 2022. While hardly a decisive shift, keeping up this momentum over the next eight years would just about enable the government to achieve its target of moving 50% of SCS roles out of London by 2030. Doing so will not be easy, but the government should be helped by natural attrition of senior officials, via retirement or other departures from the civil service, providing an opportunity to hire replacements outside the capital, and by the successful relocation of senior staff to the Darlington Economic Campus acting as a proof of concept.
Senior jobs are the hardest to shift, as incumbents tend to be of the age and career stage at which their location becomes ‘stickier’ – they may have school-age children or have bought property. But Institute for Government research suggests that their presence is crucial to the success of relocated offices – showing junior officials that they will be able to reach the civil service’s highest echelons while working outside London and avoiding the sense that offices outside London are ‘auxiliary offices’, removed from the real action in the capital. 108 Nickson S, Mullens-Burgess E and Thomas A, Moving out: Making a success of civil service relocation, Institute for Government, November 2020, www.instituteforgovernment.org.uk/publication/civil-service-relocation The early success of the Darlington Economic Campus, for example, is partly built on the high concentration of senior staff based there.
Maintaining the momentum behind the relocation of senior and policy jobs over the next year is a prerequisite to the success of the relocation agenda and ministers and senior civil servants must continue to emphasise its importance.
The government has partially realised its ambition to relocate more public bodies outside London
The government announced in the February 2022 levelling up white paper an ambition to move more public bodies out of London. 116 Dalton G and Gill M, ‘Public bodies’, explainer, Institute for Government, 25 January 2022, www.instituteforgovernment.org.uk/explainer/public-bodies 117 Department for Levelling Up, Housing and Communities, Levelling Up the United Kingdom, CP 604, The Stationery Office, 2022, https://assets.publishing.service.gov.uk/government/uploads/system/uploads/attachment_data/file/1052706/Levelling_Up_WP_HRES.pdf It has been government policy since at least 2018 that new public bodies should be based outside the capital, unless they can demonstrate an ‘unequivocal business need’ to be there. 118 Cabinet Office, ‘The Approvals Process for the Creation of New Arm’s-Length Bodies: Guidance for Departments’, guidance, 14 December 2012, https://assets.publishing.service.gov.uk/government/uploads/system/uploads/attachment_data/file/686716/The_Approvals_Process_for_the_Creation_of_New_…, p. 10. The recent report by Labour’s Commission on the UK’s Future also recommended that more public bodies’ headquarters should be moved out of London. 119 The Commission on the UK’s Future, A New Britain: Renewing our democracy and rebuilding our economy, The Labour Party, 2022, https://labour.org.uk/page/a-new-britain
In response to the government’s policy, some public bodies have increased their footprint outside London in recent years. For instance, the Education and Skills Funding Agency cut its London headcount and increased staff numbers in every other region of England between 2019 and 2022, 120 Cabinet Office, ‘Civil Service statistics: 2019, 24 July 2019, www.gov.uk/government/statistics/civil-service-statistics-2019; Cabinet Office, ‘Civil Service statistics: 2022’, 27 July 2022, www.gov.uk/government/statistics/civil-service-statistics-2022 and the Competition and Markets Authority announced plans in 2021 to move 200 staff to Manchester by 2025. 121 Competition and Markets Authority, ‘CMA to open offices in Manchester and Darlington’, press release, 19 November 2021, www.gov.uk/government/news/cma-to-open-offices-in-manchester-and-darlington
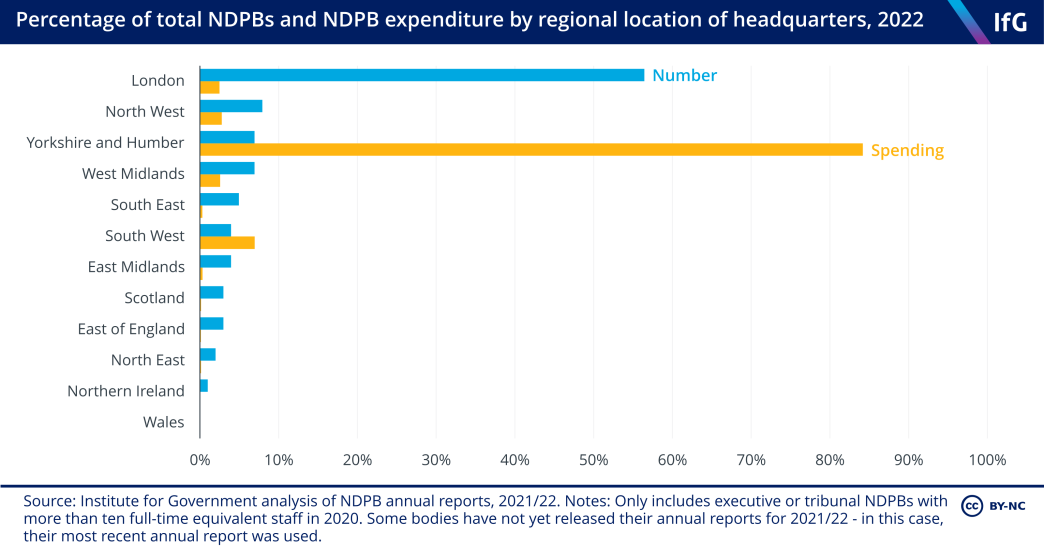
Although there is no aggregate data on the location of public body staff who are not civil servants,* we can look at the headquarters of public bodies according to their annual reports to get a sense of their geographic spread. This shows that non- departmental public bodies (NDPBs), a type of public body that does not employ civil servants and is more independent from its sponsor department, are already much more geographically distributed than government departments. Although the capital hosts a large number of cultural institutions with relatively small budgets, most of the largest NDPBs by spend are already headquartered outside London – including NHS England, in Leeds (Yorkshire and Humber). Even if NHS England is excluded from the analysis, London headquartered NDPBs would account for only 13% of overall spend. They are also spread across the country: 27 towns and cities across the UK are home to at least one body.**
However, progress has been slow in moving more bodies out of London. Looking at executive and tribunal NDPBs that existed in 2019 and 2022, only UK Anti-Doping and East West Rail have moved out of London, to Loughborough and Milton Keynes respectively. The majority (58%) of NDPBs remain headquartered in the capital. Even excluding museums, that leaves London hosting 52% of the head offices of executive and tribunal NDPBs.
More progress could be made in moving some of these headquarters and staff outside London, especially for bodies where a pool of expertise exists beyond the capital. For instance, the Care Quality Commission (CQC) is headquartered in London despite being a national regulator, and despite the presence of pools of relevant expertise in cities such as Leeds, which as noted is home to NHS England.
* Only staff working for government departments, executive agencies, non-ministerial departments and crown non-departmental public bodies are civil servants; other staff count as public servants. For further information see the Methodology.
** Institute for Government analysis of NDPB annual reports, 2018/19 and 2021/22. Notes: Only includes executive or tribunal NDPBs with more than ten full-time equivalent staff in 2020. Some bodies have not yet released their annual reports for 2021/22 – in this case, their most recent annual report was used.
The number of arm’s length bodies has risen for the first time since 2005
The number of arm’s length bodies has been falling consistently for as long as data on their numbers has been published – since 1979 for NDPBs, barring a brief rise in the mid-2000s, and since 2010 for other types of arm’s length body.* But due to changes in how the Cabinet Office collects this data, no information has been published on the number of arm’s length bodies since the start of the pandemic in March 2020.
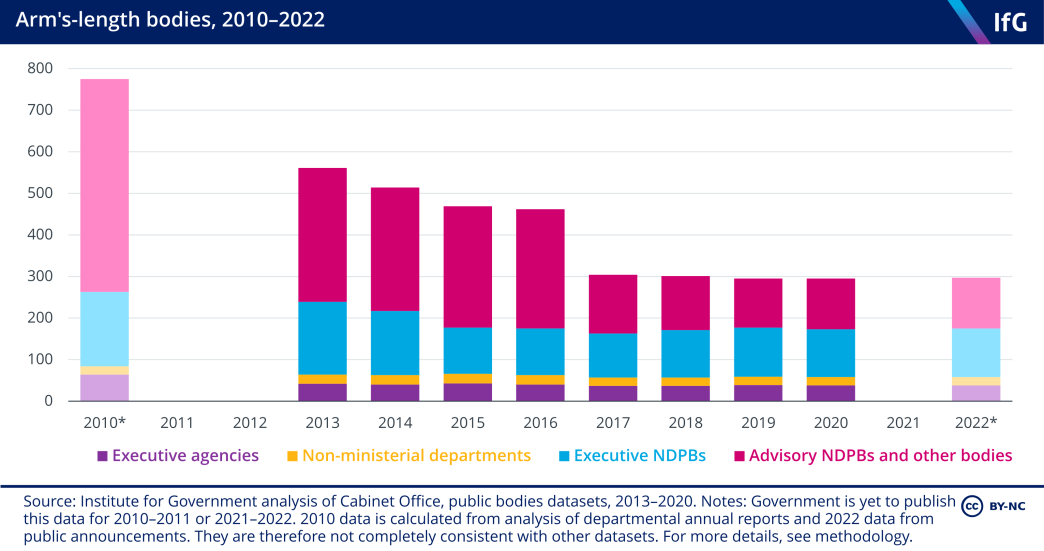
However, our analysis of public announcements suggests that the number has, marginally, increased since then, from 295 to 297. This small increase reflects the fact that government has created new public bodies, such as the Office for Environmental Protection and the Trade Remedies Authority, to administer functions previously undertaken by EU institutions. It also reflects the lack of impetus in government for public bodies reform in recent years, as well as a lack of obvious candidates to abolish or merge following decades of abolitions. The plans for public bodies reform set out by the government in 2022, 122 Cabinet Office, ‘Guidance on the undertaking of reviews of public bodies’, May 2022, retrieved 16 January 2022, www.gov.uk/government/publications/public-bodies-review-programme/guidance-on-the-undertaking-of-reviews-of-public-bodies however, may result in a renewed effort to reduce the number or scope of public bodies (see Part 2 of this report).
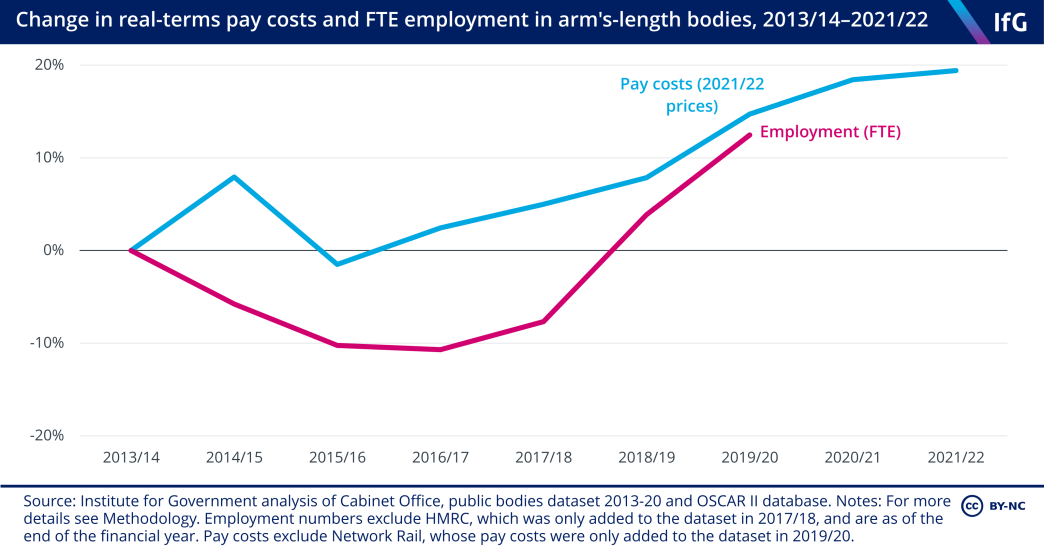
While the number of arm’s length bodies has remained fairly static in recent years, employment within them has, again marginally, increased. The latest data shows a similar pattern to overall civil service staff numbers with numbers falling until 2016, and then rising. These increases also reflect similar factors, namely Brexit and the pandemic.
Pay costs have generally risen slightly faster than employment. Employees of NDPBs, which account for around a third of arm’s length body staff, are not civil servants, and so were not necessarily subject to the same real-terms pay cuts as civil servants over this period. However, pay costs – and presumably employment numbers – appear to have plateaued in 2021/22.
* Arm’s length bodies are a subset of public bodies limited to NDPBs, executive agencies and non-ministerial departments. As such, these figures do not include public corporations, unclassified bodies or parliamentary bodies.
Budgets, spend and cost
Departments spend their budgets very differently – even when delivering comparable services
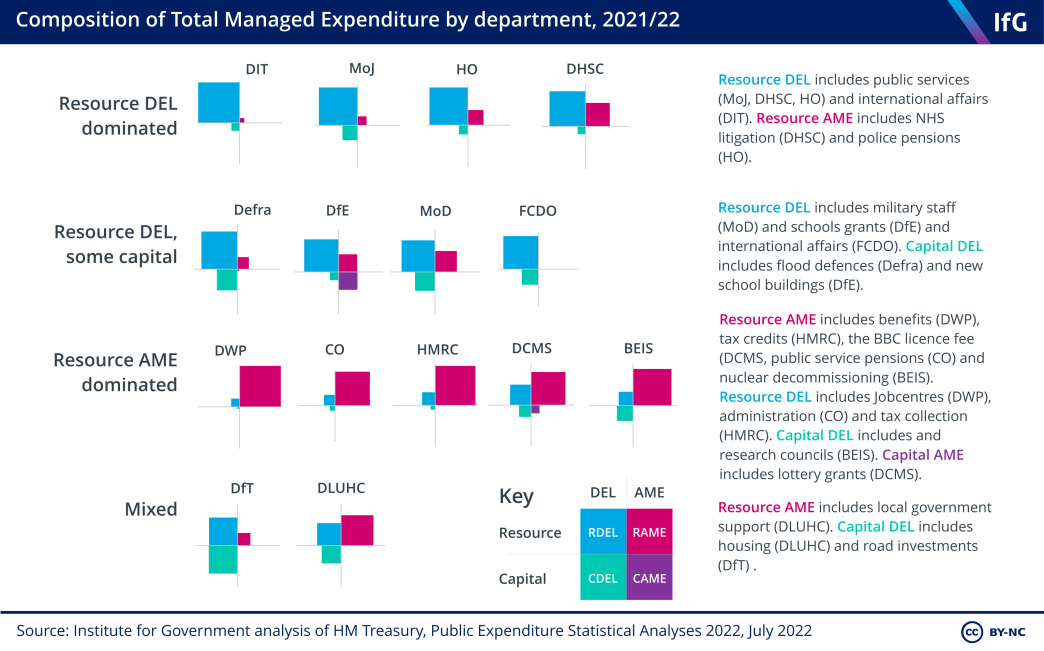
Each government department is responsible for delivering programmes in its area using budgets provided by the Treasury. Different departments have differing levels of control over spending.* Some are more day-to-day intensive while others spend most of their money on investment, such as MoD and DfT. For example, DHSC and DWP are the largest departments by total budget, but DHSC spending is mostly under its own control (DEL) while DWP spending is mostly not (AME).
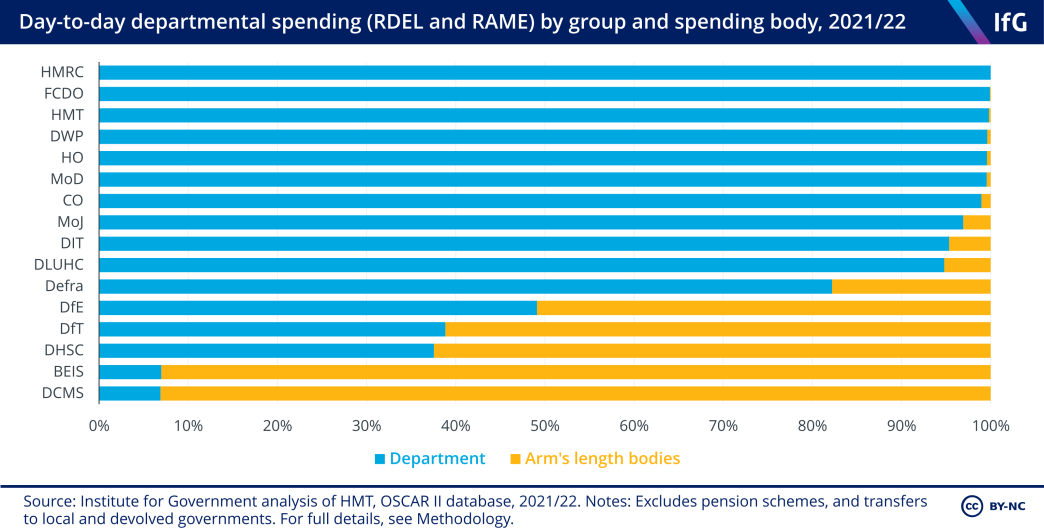
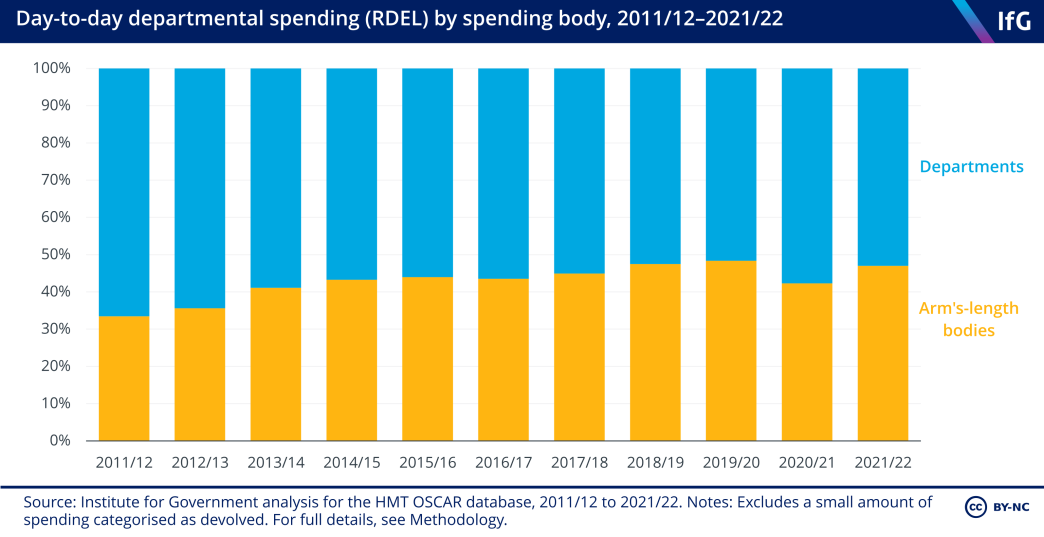
To look in more detail at how departments spent their money, we also conducted a new analysis of the Treasury’s OSCAR II spending dataset (Figures 1.20–1.23). This shows that there is significant variation in how much of each department’s budget is spent directly by that department, rather than being passed on to public bodies or pension schemes.** The degree of spending administered centrally is often a by-product of the choice of particular delivery models rather than the function of each department.
For instance, while both DWP and DHSC are responsible for major public services, their proportion of funding spent through public bodies differs markedly. Since Jobcentre Plus was brought into DWP in October 2011, it has overwhelmingly delivered its services itself and centrally. By contrast, DHSC channels a huge amount of funding through public bodies such as NHS England and the UK Health Security Agency.
* Some spending can be controlled directly and departments are given firm limits – known as departmental expenditure limits (DEL) – that they must stay within. Other spending is less predictable: for example, spending on social security depends on rules that determine whether people are entitled to welfare payments. This is known as annual managed expenditure (AME). Spending is also split between money that is dedicated to day-to-day (resource) spending such as employing teachers, and money spent on investment (capital) such as school buildings.
** OSCAR II is a dataset published by the Treasury that provides key management information and data on aggregate public spending. Our analysis here excludes spending that is directly granted to local government or the devolved administrations. To read more about this analysis, see the Methodology.
Administration budgets have been cut and are set to fall further
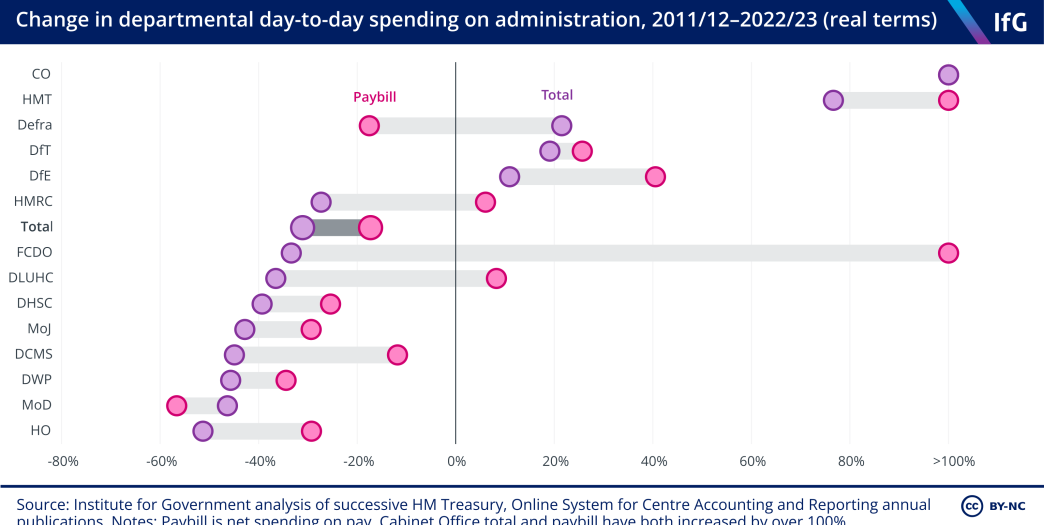
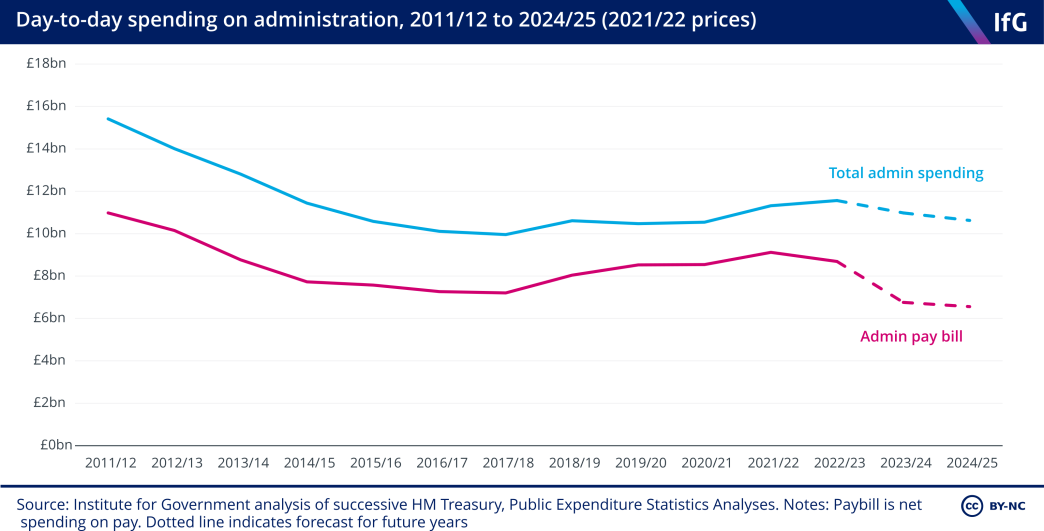
Government spending on administration – meaning broadly on the civil service and the operation of government machinery as opposed to spending on programmes – fell sharply during the 2010s. Between 2011/12 and 2017/18, departments’ administration budgets were cut by 35% in real terms, far sharper than cuts to the much larger programme budgets.
As the civil service has grown, the cost of departments has also grown. In 2022/23 administration budgets are forecast to be 16% higher in real terms than the low of 2017/18, although still far below 2011/12. Those cuts have not fallen evenly across departments: some have grown in size while others’ capacity has shrunk substantially. Departments at the centre – the Cabinet Office and Treasury – have grown; more delivery-focused departments such as the Home Office and DWP have shrunk.
Over the next few years, the government is planning to cut spending on administration again: by 8% by 2024/25. Plans for the administration paybill are even more striking, as the latest figures imply a 25% fall over the next two years. These numbers were published in summer 2022, when the government was still planning to cut the civil service headcount by 91,000 – since dropped by Sunak as prime minister. However, there has been no update since to indicate that the plans for administration budgets will be revised. A big question in 2023 will be whether the Sunak government is sticking to 25% civil service paybill ‘efficiencies’, or will abandon, or relax, that side of the headcount objective too.
Public bodies have decreased in number but not in spending over the last decade
Despite a fall of nearly half in the number of public bodies since 2013, the proportion of day-to-day government expenditure going through public bodies has risen in that time. This is in large part due to the growing costs associated with NHS England. The proportion of departmental day-to-day spending going to NHS England, and the NHS trusts it funds, now stands at 31.3%.*
While this indicates that spending in public bodies did not fall in line with the number of bodies in the years after 2010, there are limits to what findings can be drawn from this data. The OSCAR dataset does not consistently include the gross spending of public corporations, like the BBC, and it counts some executive agencies as within their departments and others are counted as separate public bodies. The Cabinet Office is planning to release new public body spending data in 2023 to align more accurately with OSCAR. This is much needed. The absence of rigorous spending data undermines ministers’ ability to assess the scale of the public body estate, and therefore to make well-informed decisions about reform.
* This was briefly reversed in 2020/21, when the proportion of spending fell from 31.3% to 28.6%, due to extraordinary pandemic spending outside NHS England – for example, for business loans and Test and Trace.
Diversity
The civil service continues to become more representative but senior ethnic minority representation has stalled
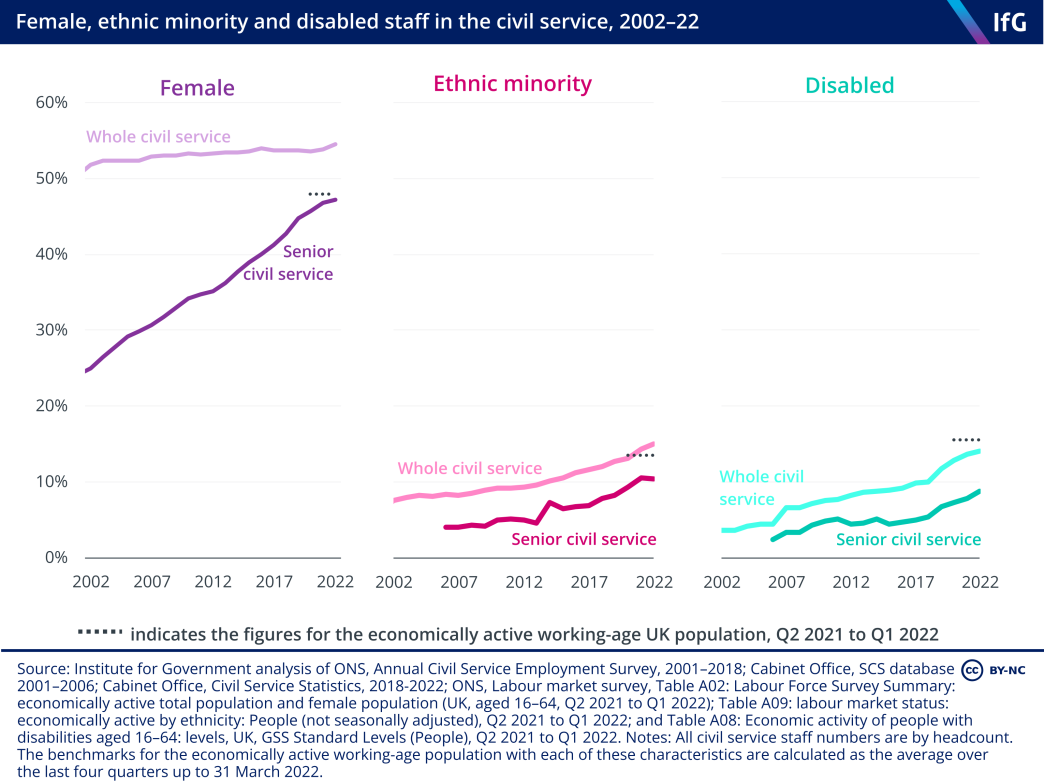
In 2022 the civil service largely continued its long-term trend of becoming more diverse. Over the last 20 years there has been significant progress in headline figures for three key measures of sex, ethnicity and disability – legally protected characteristics once greatly under-represented within the civil service.* Female officials and officials from minority ethnic backgrounds are now at least as represented in the civil service as a whole as they are in the economically active population, while the gap in representation for people with disabilities narrowed this year to less than two percentage points.
However, the senior civil service (SCS) still has further to go. Despite improvement over recent decades, there remain gaps in representation in senior ranks based on all three of these characteristics – particularly for disability, where there is an almost 7 percentage point disparity compared to the wider UK workforce. And in 2022, the proportion of minority ethnic SCS staff decreased slightly for the first time since 2015. Previous headline targets for new minority ethnic and disabled entrants into the senior civil service – due to run to 2025 – were abandoned in 2022. 127 Cabinet Office, ‘Civil Service Diversity and Inclusion Dashboard’, 10 May 2022, www.gov.uk/government/publications/civil-service-diversity-inclusion-dashboard/civil-service-diversity-and-inclusion-dashboard Given the direction of travel, this is not the time to drop targets for ethnic diversity in the SCS.
As of March 2022:
- 55% of civil servants are female, including 47% of senior civil servants, compared
- with 48% of the economically active population
- 15% of civil servants come from a minority ethnic background, including 10% of senior civil servants, compared with 14% of the economically active population
- 14% of civil servants have a disability, including 9% of senior civil servants, compared with 16% of the economically active population.
128
Cabinet Office, ‘Civil Service statistics: 2022’, 27 July 2022, www.gov.uk/government/statistics/civil-service-statistics-2022; ONS, ‘A02 SA: Employment, unemployment and economic inactivity for people aged 16 and over and aged from 16 to 64 (seasonally adjusted)’, 13 December 2022,www.ons.gov.uk/ employmentandlabourmarket/peopleinwork/employmentandemployeetypes/datasets/employmentunemploymentandeconomicinactivity
forpeopleaged16andoverandagedfrom16to64seasonallyadjusteda02sa; ONS, ‘A09: Labour market status by ethnic group’, 15 November 2022, www.ons.gov.uk/employmentandlabourmarket/peopleinwork/ employmentandemployeetypes/datasets/labourmarketstatusbyethnicgroupa09; ONS, ‘A08: Labour market status of disabled people’, 15 November 2022, www.ons.gov.uk/employmentandlabourmarket/peopleinwork/ employmentandemployeetypes/datasets/labourmarketstatusofdisabledpeoplea08 ,**
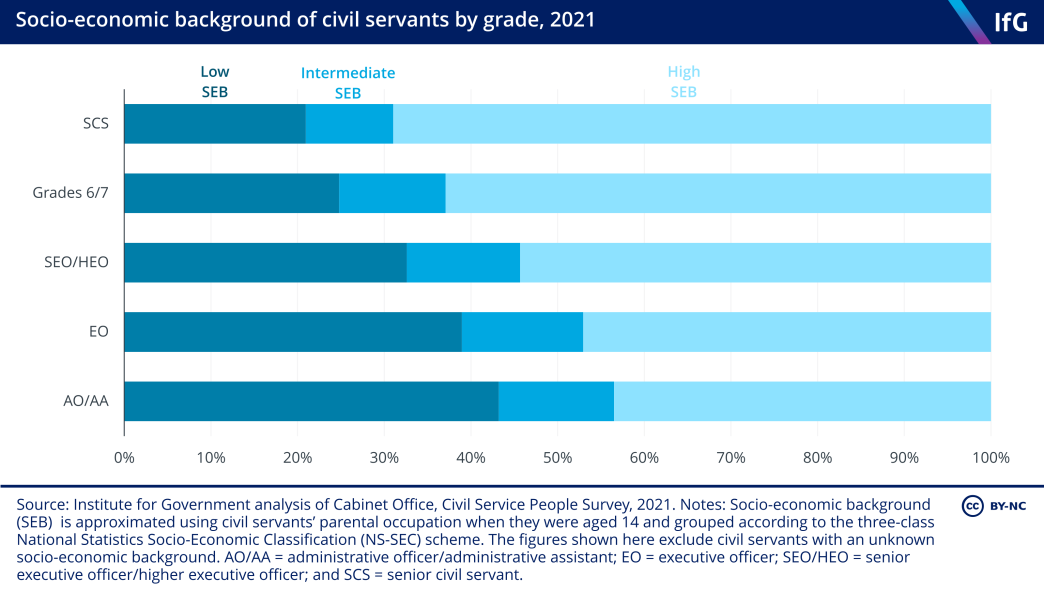
Two fifths of the UK workforce (39%) are from lower socio-economic backgrounds (when measured by parental occupation, the metric recommended by the Social Mobility Commission, SMC),
129
Social Mobility Commission, ‘Simplifying how employers measure socio-economic background: An accompanying report to new guidance’, 21 May 2021, www.gov.uk/government/publications/understanding-a-workforces-
socio-economic-background-for-change/simplifying-how-employers-measure-socio-economic-background-an-accompanying-report-to-new-guidance
but of respondents to the 2021 civil service staff survey*** 34% identified as being in that group.
130
Cabinet Office, ‘Civil Service People Survey 2021: Results by socio-economic background’, 28 April 2022, www.gov.uk/government/publications/civil-service-people-survey-2021-results
The survey results also suggest that the civil service gets more socio-economically exclusive with seniority. People from lower socio-economic backgrounds were over-represented among administrative officers and administrative assistants, the most junior grades, but the figure within the SCS was only 21%.
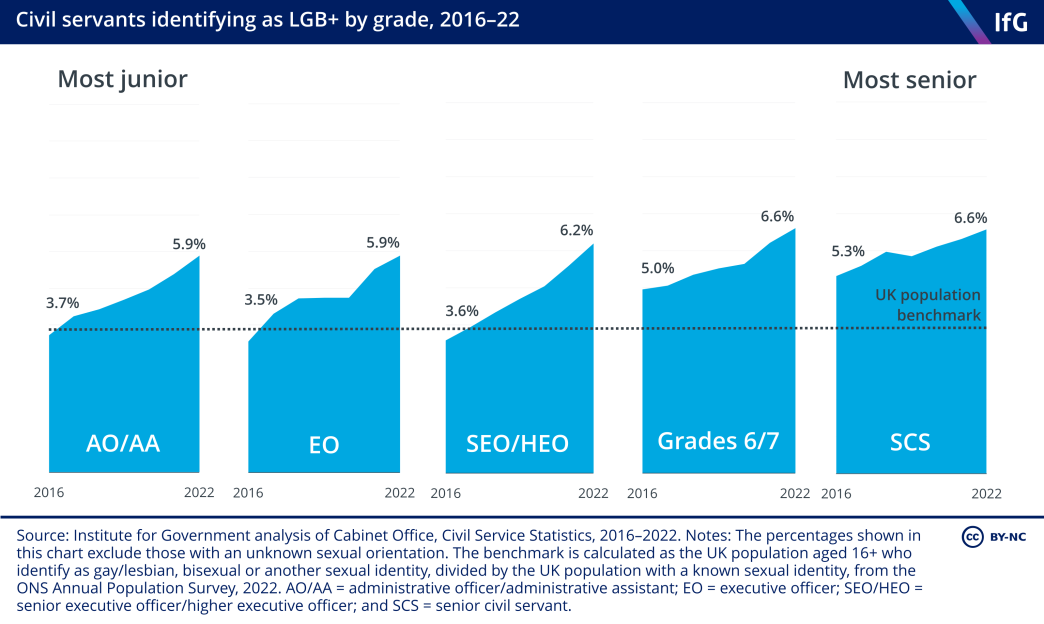
Separately, the SCS reported a higher percentage of officials who identify as gay, lesbian, bisexual, or who recorded their sexual orientation as ‘other’ (LGB+)**** as a proportion of those providing information on their sexual orientation, compared to the civil service as a whole (6.6% compared to 6.1%). In both cases this exceeds the UK population benchmark of 3.3%. 133 ONS, ‘Sexual orientation, England and Wales: Census 2021’, 6 January 2023, www.ons.gov.uk/peoplepopulationandcommunity/culturalidentity/sexuality/bulletins/sexualorientationenglandandwales/census2021 ,***** This may partly reflect that senior officials feel better able to declare their sexual orientation than junior officials – in 2022, three quarters (76%) of senior civil servants provided this information compared to 67% of administrative officers and administrative assistants. 134 Cabinet Office, ‘Civil Service statistics: 2022’, 27 July 2022, www.gov.uk/government/statistics/civil-service-statistics-2022
* Under the Equality Act 2010, it is against the law to discriminate against anyone in the workplace or in wider society based on the following ‘protected’ characteristics: age, gender reassignment, being married or in a civil partnership, being pregnant or on maternity leave, disability, race including colour, nationality, ethnic or national origin, religion or belief, sex, and sexual orientation. See ‘Discrimination: your rights’, www.gov.uk/ discrimination-your-rights. For more detailed information on the diversity of the civil service workforce, see the Institute’s explainers on disability, ethnicity, sex, sexual orientation, faith and age in the civil service.
** For more information on how we calculate population benchmarks, see Methodology.
*** While the civil service has recently developed new measures for socio-economic background (SEB), these have not yet been included in its annual workforce statistics, only its survey of staff attitudes. We can analyse the limited data on the distribution of socio-economic background in the civil service using the number of responses by group in the 2021 survey. However, this is not as robust as analysis based on workforce statistics.
**** The Annual Civil Service Employment Survey (ACSES) invites civil servants to record their sexual orientation as ‘Heterosexual/straight’, ‘Gay or Lesbian’, ‘Bisexual’ or ‘Other’. Our use of the term LGB+ refers to staff who report belonging to one of the last three groups. The term ‘LGBT+’ is not used because this data refers only to sexual orientation. The ACSES does not collect data on the gender identities of civil servants.
***** This figure excludes the 3.6 million people (7.5% of respondents) who did not answer the voluntary question on
sexual orientation in the 2021 census.
The civil service is becoming younger in age and more senior in job grade
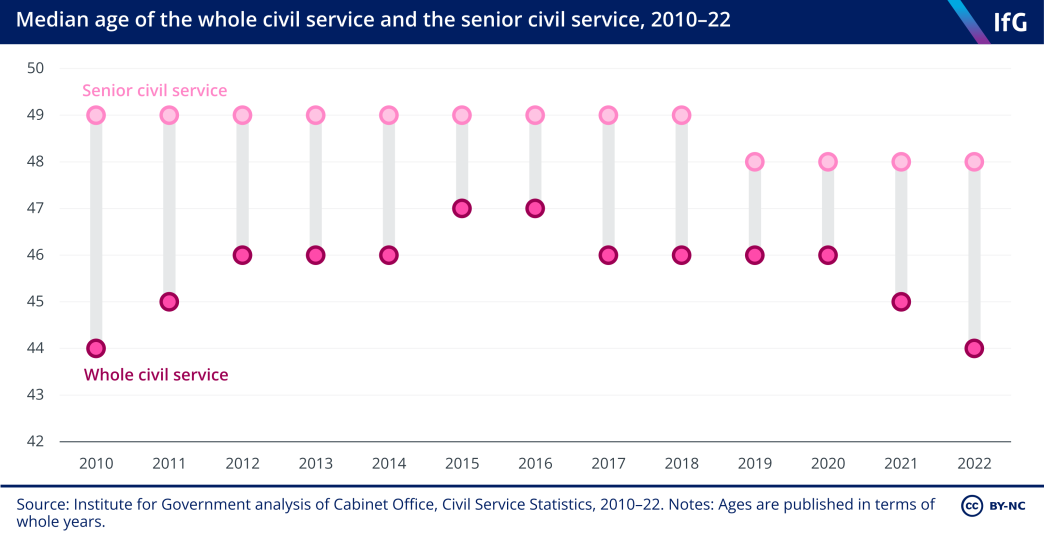
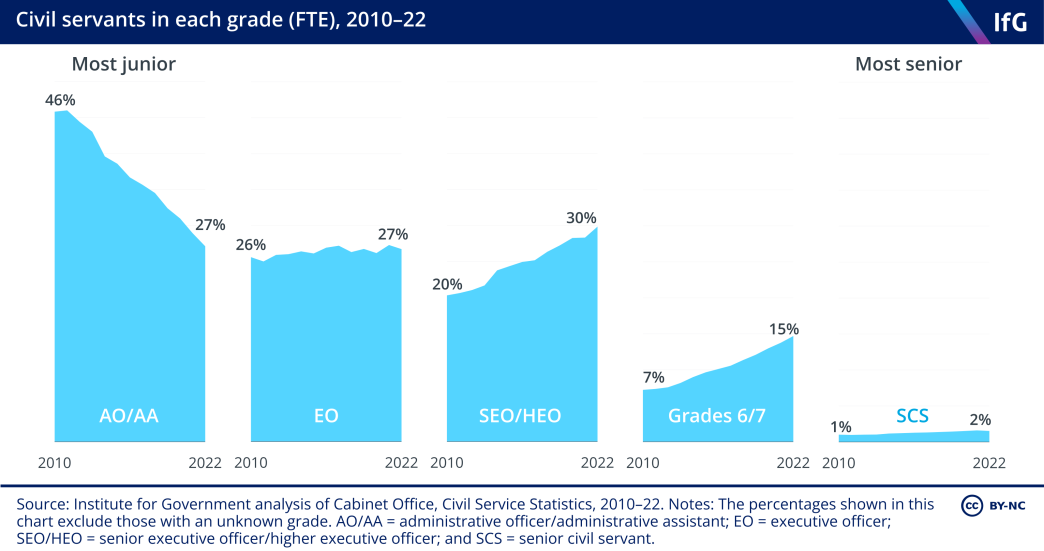
The proportions of civil servants who are younger in age and at more senior levels has increased over the last decade. The median age of the civil service is now 44 – the youngest since at least 2010. And since this time, the percentage of civil servants at the most junior AA and AO grades has decreased by nearly 20 percentage points, while there is a growing proportion of staff at HEO level and above – they make up 47% of civil servants, up from 28% in 2010.
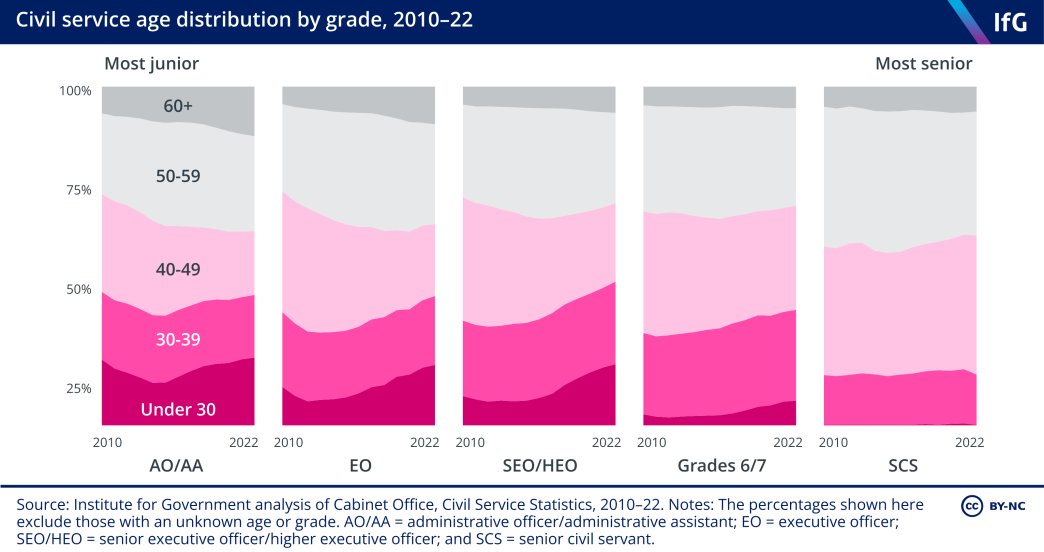
At grades 6 and 7 the proportion of staff under 40 has increased from 27% in 2010 to 34% in 2022. And the proportion of civil servants under 30 has gone up in all grades except SCS over the last decade. Meanwhile, the 40–49 age band has shrunk at every level except SCS, but especially at EO (a 14 percentage point decrease) and SEO/HEO (13pp).
The expansion of SEO/HEO levels and grades 6 and 7, coupled with the relative increase in officials under 40 at these grades, means that younger, more senior staff make up a greater proportion of the total civil service workforce. In 2010, just 8% of all civil servants were aged under 40 and between HEO level and grade 7. This category now makes up 18% of all officials.
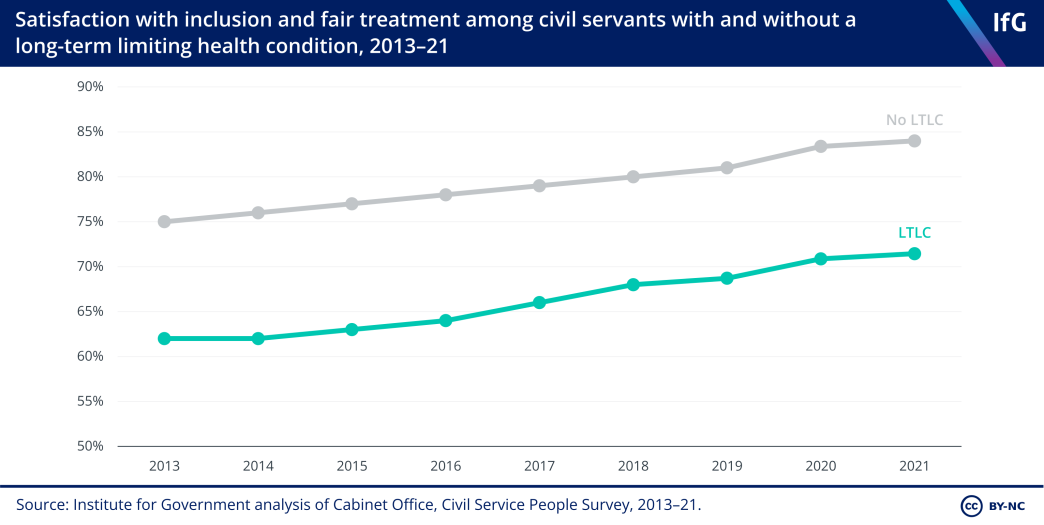
Civil servants with a disability have a worse working experience
Civil servants with a disability continue to report lower satisfaction with inclusion and fair treatment compared with other staff. While 84% of civil servants without a long- term health condition are satisfied with inclusion and fair treatment, this figure falls to 71% of staff with one. This gap is much larger than that between male and female civil servants (0.3pp), white and minority ethnic staff (2.6pp) and between straight/ heterosexual and LGB+ staff (2.9pp).
There are reasons to suggest civil servants with a disability are more satisfied with inclusion at work than their counterparts working outside the civil service. Only half of people with disabilities in the wider population feel their employer makes sufficient adjustments. 136 Disability Unit, UK Disability Survey research report, 2021, www.gov.uk/government/publications/uk-disabilityurvey-research-report-june-2021 But in every year since 2013, a notable gap of at least 12 percentage points has endured between the civil servants with and without a disability. While satisfaction has increased over time, the civil service needs to do more to address the fact that disabled civil servants have consistently been less likely than their colleagues to feel that they are treated fairly or with respect.
Skills, professions and functions
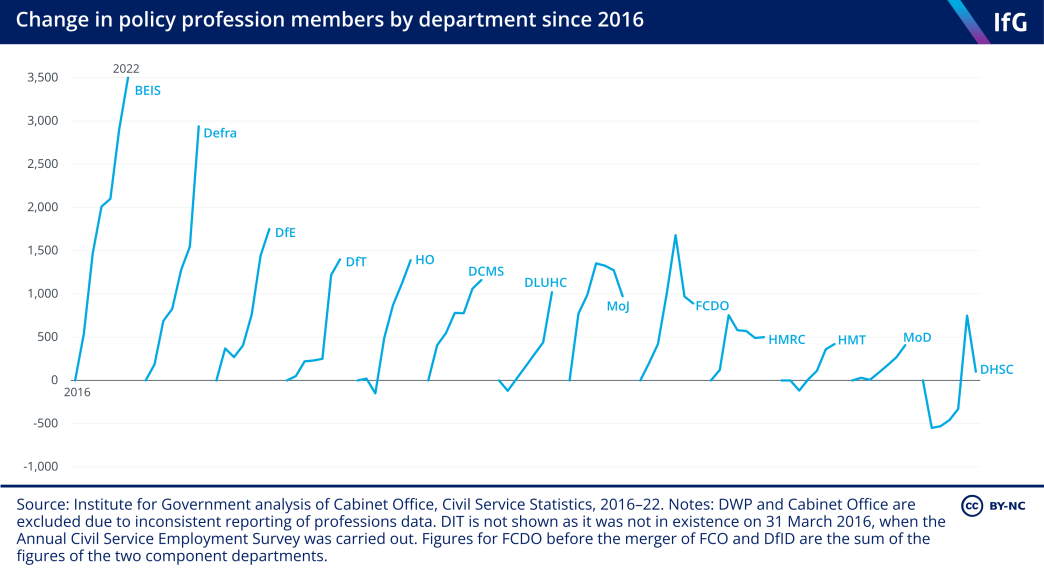
The policy profession continues to grow
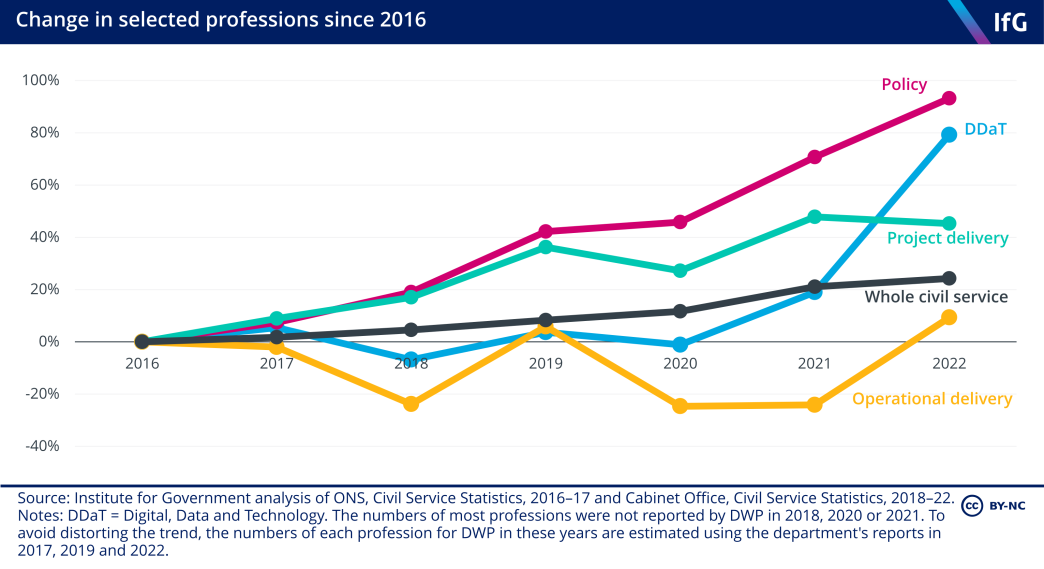
The growth of the civil service since 2016 has not occurred equally between the types of roles undertaken by officials. The changing size of civil service professions* signals the shifting priorities of departments’ workforces. The policy profession has experienced the most significant and sustained growth in this time, almost doubling since 2016 (an increase of around 15,500 people, or 93%) compared to the 24% growth of the overall civil service. The biggest increases have been in BEIS and Defra, with approximately 3,500 and 3,000 more policy officials respectively. Conversely, DHSC has only 100 more policy officials than it did in 2016, after having unwound many of the Covid-related policy functions created since 2020. For most departments, the growth of the policy profession reflects the policy demands created in the run-up to and immediately following the UK’s departure from the EU.
The project delivery profession and digital, data and technology profession have both also experienced notable growth, of 45% and 79% respectively since 2016. These are welcome developments given the increasing emphasis placed by this and previous governments on increasing the digital skills of the workforce, and the need to resource an expanding major projects portfolio.*
* For further information about the government’s major project portfolio, see Part 3 of this report.
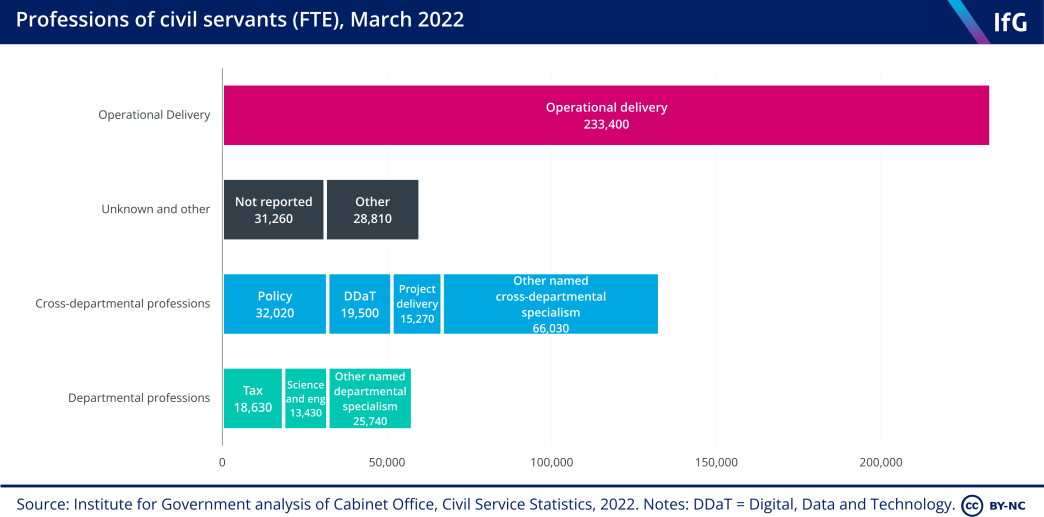
Operational delivery roles make up half the workforce but are under pressure
The operational delivery profession, the members of which run front-line services such as in job centres and prisons, is the biggest profession by a substantial margin, making up approximately half the civil service, with 233,400 members. But it has grown by only 9% – just under 20,000 more roles – against the overall civil service’s 24% since 2016. And having lost nearly 31,000 roles since 2010, the profession is now 12% smaller than it was at the start of the 2010–16 civil service job cuts.
The pressure on operational delivery roles is contributing to pressures on front-line public services across the public sector, including the civil service. The IfG and CIPFA’s recent Performance Tracker assessed backlogs, workforce problems and poor performance across a range of public services. 139 Davies N, Fright M, Nye P, Hoddinott S, Pope T, Shepley P, Richard G, Performance Tracker 2022, Institute for Government, 2022, www.instituteforgovernment.org.uk/article/performance-tracker/performance-tracker-2022 It found, for example, that many prisons – staffed directly by civil servants – have workforces insufficient to lift Covid restrictions. And despite the growth of the civil service since 2016, DWP has 7% fewer civil servants in the operational delivery profession, including those responsible for administering welfare services from Jobcentre Plus sites around the country, many of whom are on the front line of the current cost-of-living crisis.
Departments will need to grapple with these workforce trends when making decisions about headcount reductions in 2023. In general, most will find that their non- operational functions, and particularly their policy teams, have expanded significantly in recent years, while their front-line services have been squeezed harder. But this will not make subsequent workforce decisions much easier. Big proportional increases in policy staff translate to relatively small headcount figures, and most of those staff were hired to undertake functions that needed resourcing.
In short, unwinding this growth will be difficult. While large operational teams might seem, at first, to offer the greatest potential for staff reductions by sheer size, most services these teams provide have been squeezed for over a decade, making it more difficult for departments to make further cuts without downgrading performance. Nor will departments find it easy to justify cuts to front-line services at a time when those services are already struggling with backlogs and heightened demand. Where there are opportunities for savings, reducing headcount in these teams will require up-front investment in new digital and other services to improve efficiencies.
Departments’ calculations will be helped by the more comprehensive collation and reporting of data on civil service professions, which has improved substantially this year. In Whitehall Monitor 2022, we criticised the government for the fact that nearly a quarter (24%) of civil servants’ profession group was ‘unknown’ – the second largest category after operational delivery. 140 Clyne R, Thomas A, Lilly A, Durrant T, Tingay P, Pope T, Bishop M, Urban J, Shepley P, Dalton G, Gill M, Nye P, Whitehall Monitor 2022, Institute for Government, 2022, www.instituteforgovernment.org.uk/publications/whitehall-monitor-2022 In 2022 this fell to less than 7%, particularly helped by more comprehensive reporting by DWP in 2022. This is welcome as it will give ministers and senior officials more usable data on which to base staffing decisions in the year ahead.