Whitehall Monitor 2024: Part 1: How the civil service changed in 2023
Analysis of how the civil service continued to change in 2023 - including its size, structure, turnover and budgets.

Size and turnover of the civil service
The recent growth of the civil service
The growth of the civil service has eased slightly
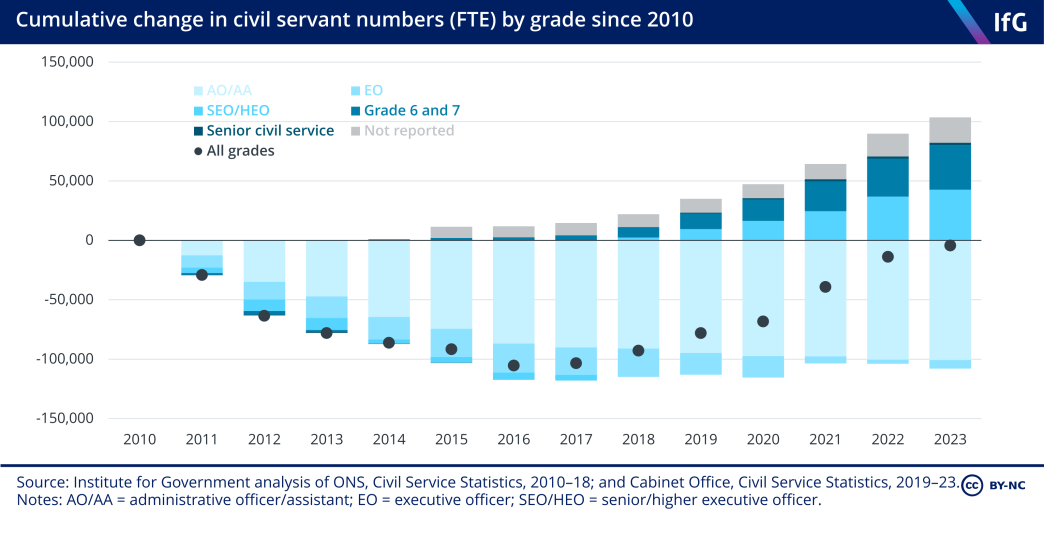
The size of the civil service has declined steadily since the Second World War, during which it more than trebled in size. Despite periods of growth in the intervening decades the civil service reached its smallest post-war size in 2016, at 384,230 ‘full time equivalent’ (FTE) staff, following the cuts during the coalition and Conservative governments. Since then, however, the civil service has grown by 111,920 staff (29%). This took its size in September 2023 to 496,150 FTE – larger than it was in early 2010 at the start of the coalition.
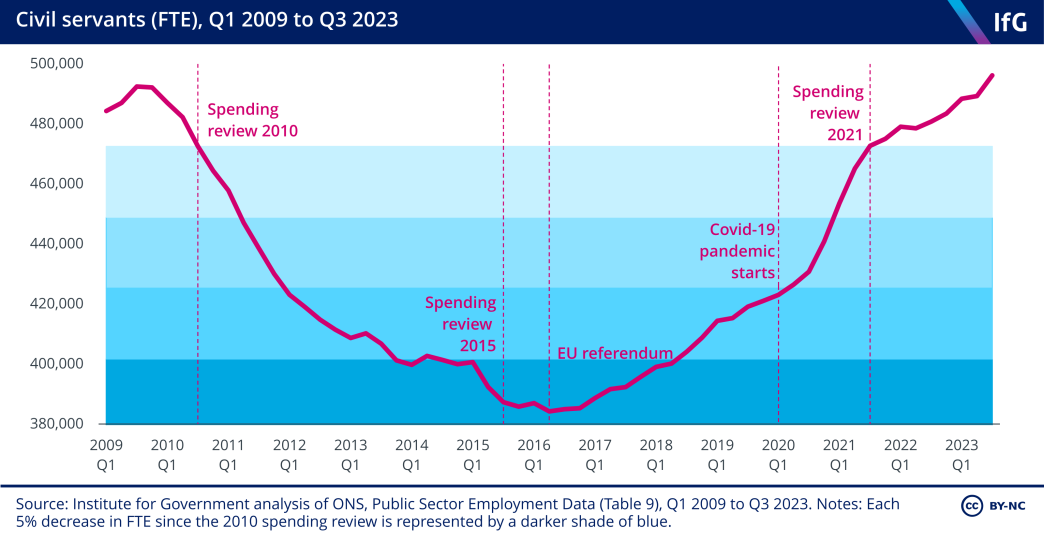
This expansion has come in two main phases. After the EU referendum, more civil servants were recruited to prepare for the UK to formally leave the bloc and to staff permanent new post-Brexit functions – that is, those previously managed at the EU level.
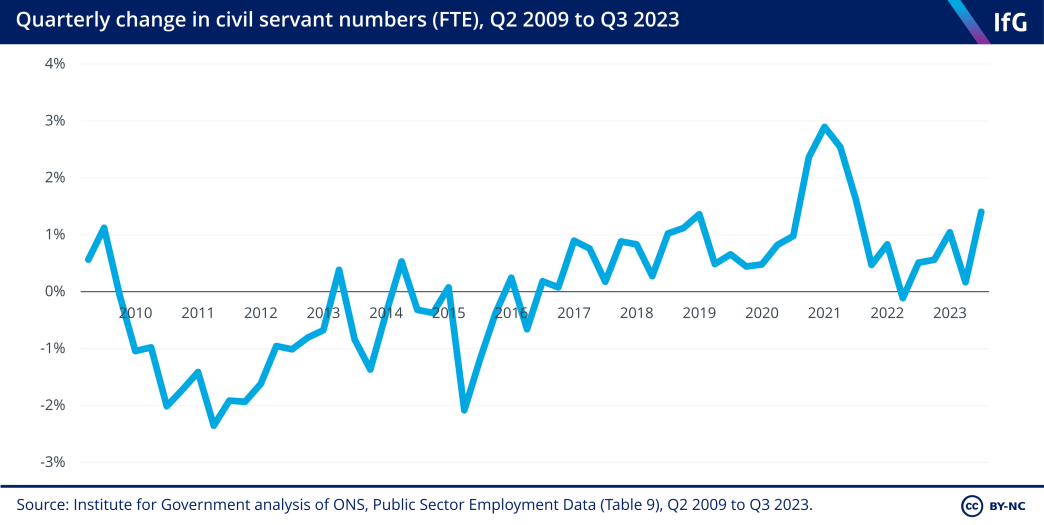
But then an even more rapid phase of growth came during the Covid pandemic: the rate of growth more than doubled between Q3 and Q4 2020, and remained above 2% per quarter until Q3 2021. This then eased – in Q2 2023 the civil service expanded by just 0.17%, almost the lowest rate of growth since 2016. But in Q3, numbers increased further – by 1.4%, which is the highest rate since Q3 2021.
Such continued growth runs contrary to the stated ambitions of successive Conservative governments to reduce the size of the civil service. However, the most recent, significant uptick in the growth rate did occur before the government’s decision in October 2023 to cap the number of civil servants at the then current level, and later reduce it to pre-pandemic levels. 202 HM Treasury, ‘End to Civil Service expansion and review of equality and diversity spending announced in productivity drive’, GOV.UK, 2 October 2023, www.gov.uk/government/news/end-to-civil-service-expansionand- review-of-equality-and-diversity-spending-announced-in-productivity-drive
Over the past 12 months – between Q3 2022 and Q3 2023 – the civil service grew by 15,400 (3.2%). The departments experiencing the highest proportional rates of growth in this period were the Home Office and the Foreign, Commonwealth and Development Office (FCDO). The former also saw the largest increase in absolute numbers of staff, at 7,100, while DCMS* and HMRC saw the greatest proportional and absolute reductions in staff respectively, with 240 and 1,520 fewer FTE.
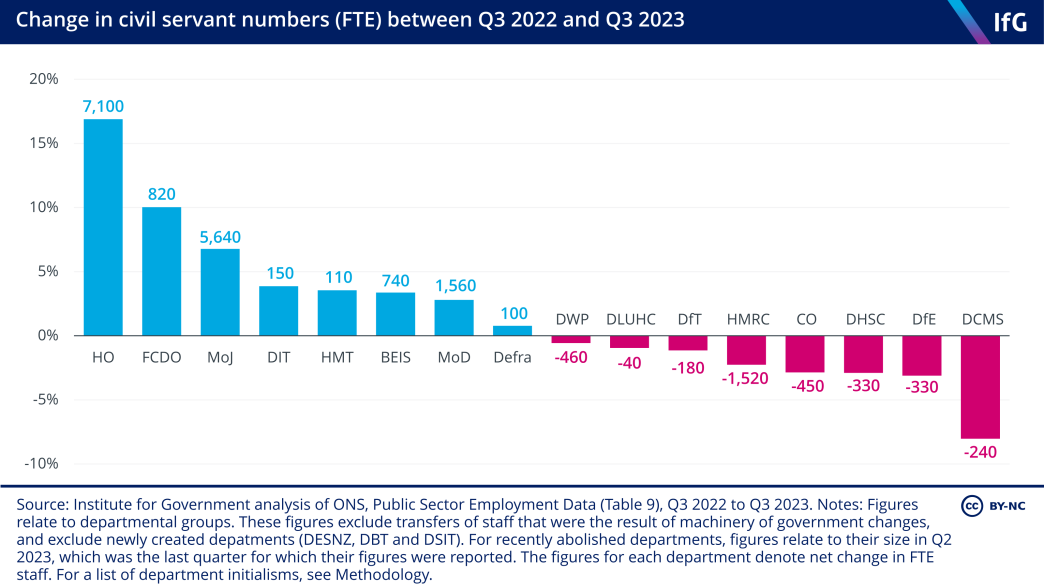
In the case of the Home Office, this follows a recent trend – the department’s growth has been accelerating in recent years as it has sought to resource new post-Brexit migration and border arrangements and, more recently, address problems with the asylum system. The FCDO began to grow again in late 2022 following a period of retrenchment through 2020 and 2021. DCMS, meanwhile, shrank significantly over the past 12 months – contrasting sharply with its breakneck expansion since 2016, and HMRC has continued an unpredictable path of expansion and contraction.**
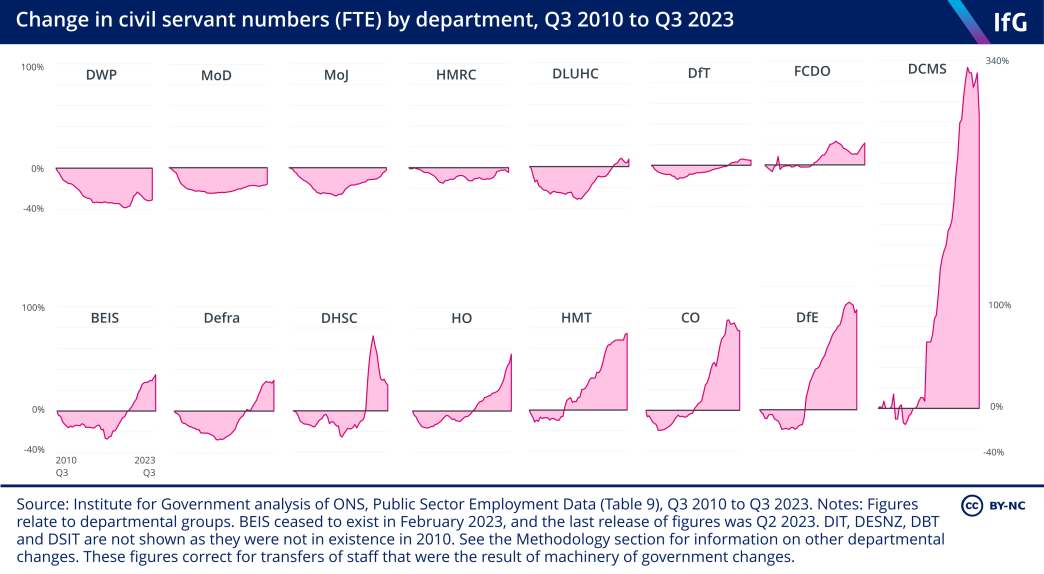
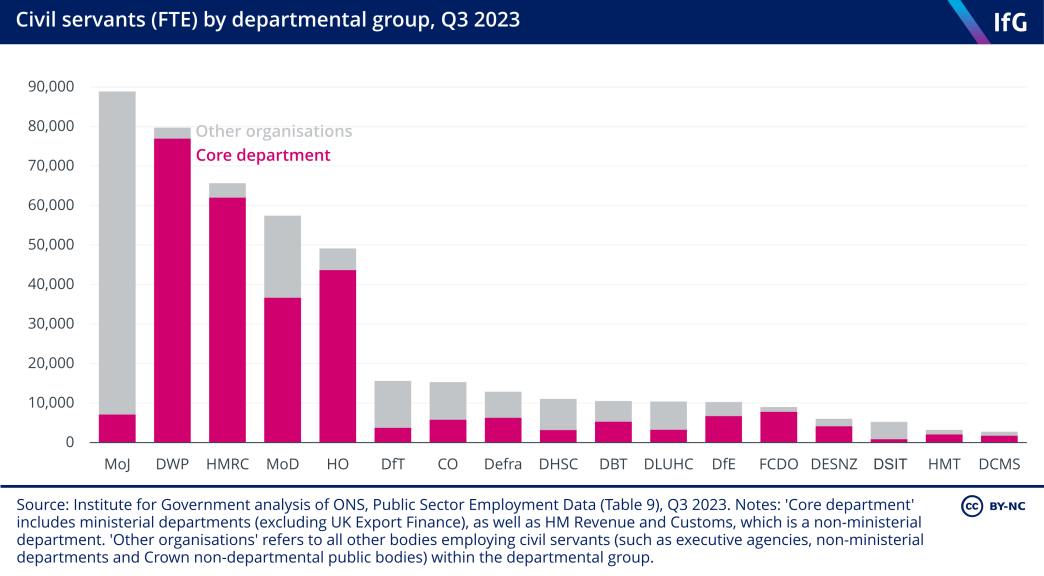
Following the 2010–16 contraction and subsequent growth of the civil service, all but four departments now have more civil servants than they did in 2010. The four departments that still remain smaller than they were in 2010 are also the four largest, with big operational services – MoJ, DWP, HMRC and MoD. Collectively, these departments have approximately 57,000 fewer civil servants than they did in 2010.
Several smaller, policy-focused departments such as DCMS and DfE, and at the centre of government such as the Cabinet Office and Treasury, are meanwhile proportionally far larger now than they were in 2010.
The changing size of civil service professions sheds some light on how and why the civil service has grown – but is undermined by poor data
The size of the civil service is often the subject of political debate. That debate should be informed by a clear understanding of how and why the size of the civil service has changed. This is easier to establish for some departments than others. MoJ, for example, has grown by 18,500 staff since Q2 2016. HM Prison and Probation Service, part of MoJ, grew by 15,310 over the same period. This gives a strong indication that MoJ’s growth has been driven by the demands of the prison and probation services.
But this understanding cannot be reached elsewhere. The Home Office, for example, grew by 18,710 staff over the same period. A very small proportion of this growth was in the National Crime Agency, and the remainder in the ‘core’ Home Office. It is difficult, using publicly available data, to understand in much more detail how different parts of the department have changed over time.
A more useful way to understand why departments have grown or shrunk is to look at changes in the types of work that civil servants do, or the ‘profession’ to which they belong. All civil servants belong to a profession. Some, most obviously the policy profession, are ‘cross-departmental’ – common to all departments. We classify others, such as the international trade, tax and intelligence analysis professions, which are mostly confined to one department, as ‘departmental professions’. Prison officers, asylum caseworkers and Jobcentre Plus staff, meanwhile, are part of the operational delivery profession – which makes up more than half of the entire civil service.
Identifying how the sizes of these professions have changed can suggest why the civil service and individual departments have changed in size over time.

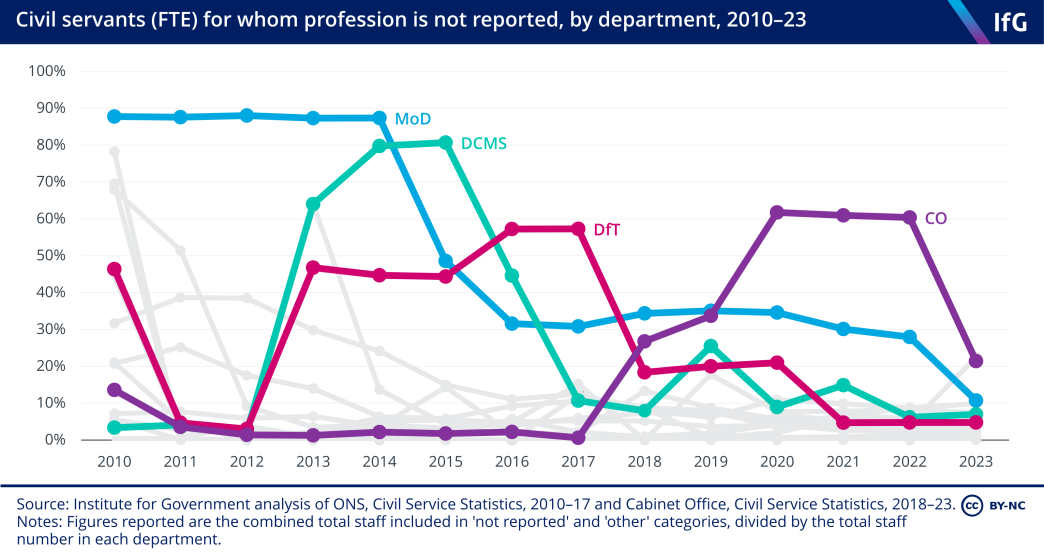
Historically, data on the professions of civil servants has been poorly collated and reported, and has often been unreliable. MoD, DCMS, DfT and Cabinet Office, for example, have often not reported the professions of large proportions of their staff. The data quality has improved substantially in recent years as more departments have more comprehensively reported the professions of their staff. But these data quality issues make comparisons over time difficult.
With that significant caveat, it is still possible to use professions data to draw some conclusions. We have focused on how and why the civil service has grown since 2016 and the EU referendum, given the extent of political commentary on the subject and because the quality of the data in recent years is better than it was in 2010.
The growth of the civil service has been driven by rising numbers of front-line staff
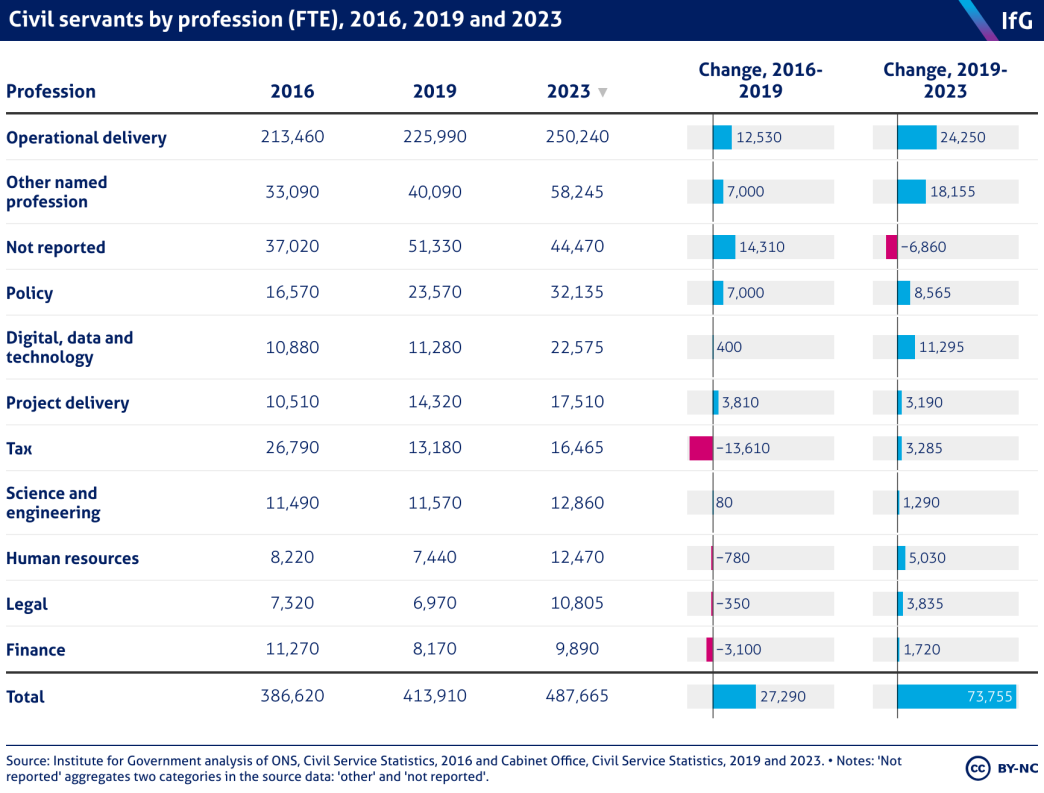
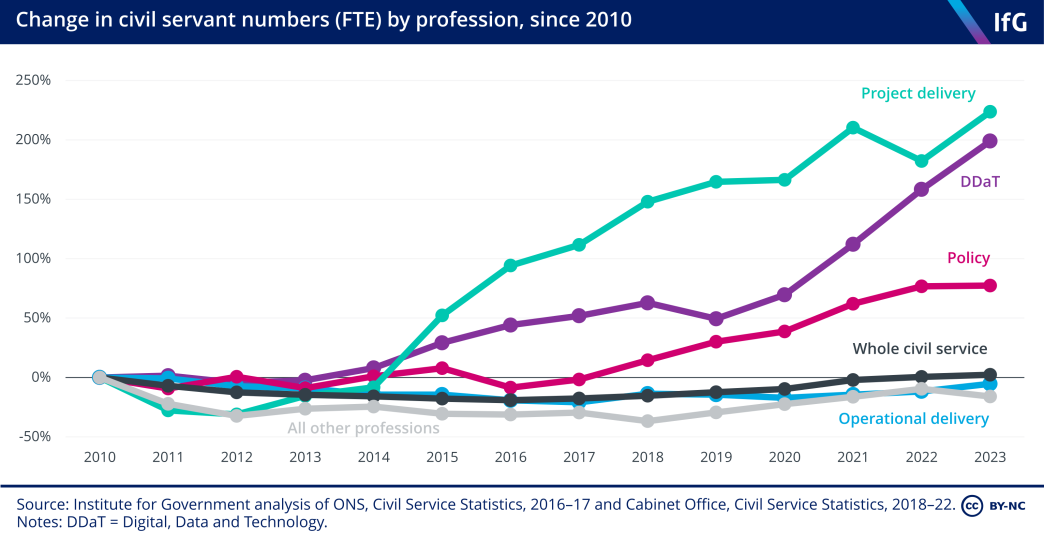
Between the twin expansions of 2016–19 and 2019–23 the operational delivery profession added far more staff than any other individual profession. This followed a reduction in the number of such civil servants by over 50,000 in the six years to 2016. The profession remains 5% smaller now than it was in 2010.
There was also a notable expansion in the policy profession in both periods, and a striking addition of digital, data and technology (DDaT)*** professionals during 2019–23. The small sizes of these professions compared to operational delivery mean that they – as well as the project delivery profession – have experienced very significant proportional growth. However, growth in the policy profession slowed sharply between 2022 and 2023 following far higher growth rates between 2016 and 2022.
On a departmental basis, the four departments that have added the largest numbers of staff since Q2 2016 were MoJ, Home Office, BEIS and MoD. Together these departments grew by over 51,000, accounting for 46% of the entire growth in the civil service.
The figure below shows how individual professions have contributed to this growth in each department. In the MoJ, high numbers of prison and probation officers in HMPPS (and to a lesser extent in HM Courts and Tribunals Service) mean that the operational delivery profession dominates – it is growth in these front-line roles that has driven the growth of the department.
The same applies in the Home Office – possibly due to the recruitment of more immigration and asylum caseworkers, as well as other front-line staff working on migration and the border – and partially in MoD, though here the HR profession has more than doubled in size. As noted above, however, this growth should be considered in light of the staffing reductions in these departments between 2010 and 2016. In BEIS, meanwhile, the policy profession in 2023 was more than four times larger than in 2016 and there were 1,200 more operational delivery professionals.
The four departments that have seen the most proportional growth since Q2 2016 are DIT, DCMS, DfE and Defra. Together, these departments grew by an average of 122%. Growth in DIT,**** which expanded consistently until it was merged into DBT, has been mostly driven by the creation and expansion of the international trade profession. In DCMS, the policy profession appears to have expanded very significantly, as has the project delivery profession. In DfE, the expansion has been driven by the addition of similar numbers of project delivery, operational delivery and DDaT professionals. Finally in Defra, growth in the policy and operational delivery professions dominates.
This demonstrates how the growth of the civil service since 2016 has been driven by growth in the operational delivery profession – which has itself been driven by pressures on front-line services, and particularly those run by the MoJ and Home Office.
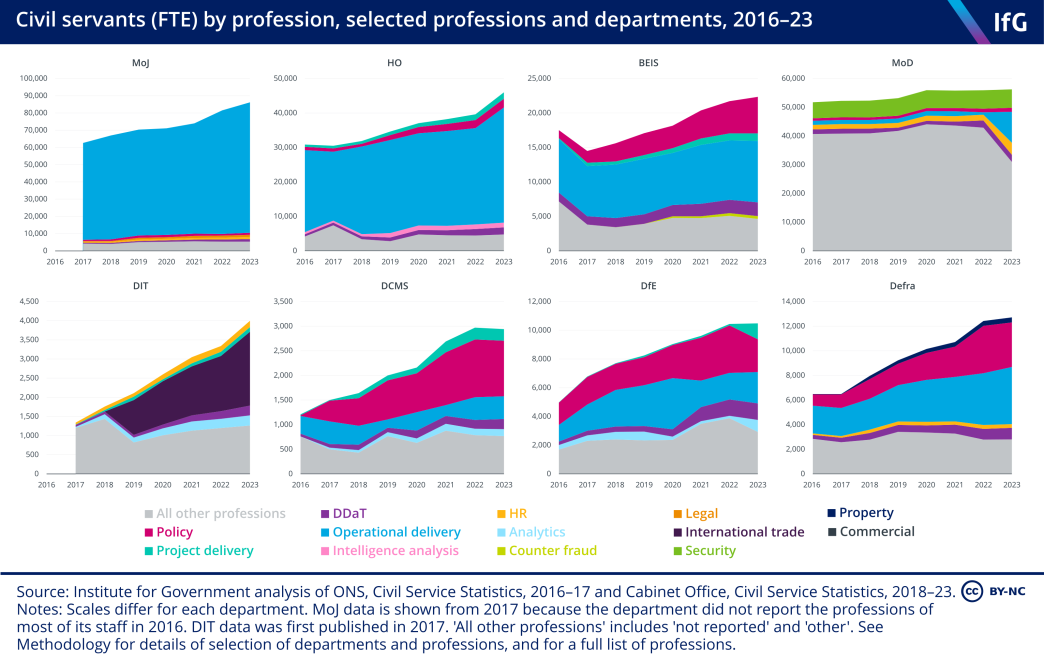
Meanwhile, the expansion of the policy profession, particularly in BEIS and DCMS, could suggest hiring rounds to assist EU exit preparations, to staff new functions resulting from leaving the EU, or the increased focus in recent years on areas such as digital and technology policy. Growth in the DDaT profession, meanwhile, is unsurprising as the government continues to focus on expanding its digital capability and improving online public-facing services.*****
The folly of headcount targets
The Sunak government has flip-flopped on headcount targets
The size of the civil service has been a continuous source of commentary and controversy in recent years. In August 2023, for example, there was widespread coverage of research by the TaxPayers’ Alliance that was critical of the expansion of the civil service since 2016. 203 Beckford M, ‘The Whitehall blob grows! The number of civil servants has risen by 100,000 since 2016 with taxpayers footing a £17 billion bill for salaries’, Daily Mail, 9 August 2023, www.dailymail.co.uk/news/ article-12387051/Number-civil-servants-grown-100-000-taxpayers-footing-17-billion-bill.html Several commentators have called for staff numbers to be cut, 204 Demianyk G, ‘Jacob Rees-Mogg Called Out For ‘Fake History’ After Latest Attack On Civil Servants’, HuffPost, 10 August 2023, www.huffingtonpost.co.uk/entry/jacob-rees-mogg-civil-servants-empire_ uk_64d536efe4b09df1983fc1c6 and there have been a number of attempts by government to do so.
At the 2021 autumn budget and spending review, when Boris Johnson was prime minister, an ‘efficiency and savings review’ earmarked efficiency savings of 5% in departmental budgets, which the government said meant that the “non front line” civil service headcount could be reduced to 2019–20 levels by 2024–25. 205 HM Treasury, ‘Autumn Budget and Spending Review 2021: documents’, GOV.UK, 27 October 2021, last updated 21 February 2023, www.gov.uk/government/publications/autumn-budget-and-spending-review-2021- documents This was superseded by the announcement in May 2022 of an aim to reduce to 2016 levels, equating to a reduction of 91,000 roles. 206 Mason R and Inman P, ‘Civil service unions warns of strike over Boris Johnson’s plan to cut 91,000 jobs’, The Guardian, 13 May 2022, https://www.theguardian.com/politics/2022/may/13/civil-service-pcs-union-warnsof- strike-over-pms-plan-to-cut-91000-jobs-boris-johnson
Sunak then scrapped this target after becoming prime minister in October 2022, saying that he did not believe “top-down targets for civil service headcount reductions are the right way” to ensure “every taxpayer pound goes as far as it possibly can”. 207 Dunton J and Markson T, ‘Civil service job-cuts target scrapped but 2% pay cap looms’, Civil Service World, 1 November 2022, www.civilserviceworld.com/professions/article/civil-service-91000-job-cuts-scrapped-2- pay-cap-looms-sunak-hunt
A further efficiency and savings review was announced in the 2022 autumn statement. This led to the announcement in the spring budget of 2023 that departments had identified efficiencies going beyond the 5% target set in 2021. At this time the government was clear that it envisaged a lower headcount in the civil service, but would not set specific targets.
Oliver Dowden, chancellor of the Duchy of Lancaster, said in January 2023 that while tight budgets would “certainly” mean a reduction in headcount, the government’s approach, in contrast to that of the Johnson administration, was that it would be “driven by outcomes”. 208 House of Commons Public Administration and Constitutional Affairs Committee, Oral evidence: The work of the Cabinet Office, HC 950, 26 January 2023, https://committees.parliament.uk/oralevidence/12604/pdf In March the Cabinet Office minister Alex Burghart went further, saying: “There is no target… we’re not saying that we have to reduce headcount by a certain figure.” 209 House of Commons Public Administration and Constitutional Affairs Committee, Oral evidence: Planning for the future of the Government’s estates, HC 793, 28 March 2023, https://committees.parliament.uk/ oralevidence/12969/pdf
However, the chancellor, Jeremy Hunt, abandoned this approach at the Conservative Party conference in October 2023, announcing plans to reduce civil service headcount to pre-pandemic levels. This would follow an “immediate” cap on civil service headcount at its then current levels. 210 HM Treasury, ‘End to Civil Service expansion and review of equality and diversity spending announced in productivity drive’, GOV.UK, 2 October 2023, www.gov.uk/government/news/end-to-civil-service-expansionand- review-of-equality-and-diversity-spending-announced-in-productivity-drive There are a number of uncertainties around the cap. The Treasury has said that it does not mean a recruitment freeze, and that ongoing recruitment campaigns (including the Fast Stream) would continue – making it unclear how the cap is operating in practice. The government also claimed that the cap could save up to £1bn by 2025. 211 HM Treasury, ‘End to Civil Service expansion and review of equality and diversity spending announced in productivity drive’, GOV.UK, 2 October 2023, www.gov.uk/government/news/end-to-civil-service-expansionand- review-of-equality-and-diversity-spending-announced-in-productivity-drive This is unlikely, as it is based on the misleading assumption that civil service expansion would otherwise have continued at its average rate since 2016. In fact, the latest figures show lower rates of growth in recent quarters than during the pandemic and following the EU referendum, as described above.
To deliver this latest incarnation of a headcount reduction target, departments will be asked to produce plans to reduce headcount to pre-pandemic levels, beginning in the next spending review period (from 2025). The target date for reaching this level was set in November’s autumn statement, as the “end of the next spending review period”. 212 HM Treasury, ‘Autumn Statement 2023’, Gov.uk, 22 November 2023, updated 30 November 2023, www.gov.uk/government/publications/autumn-statement-2023 This would mean reducing the workforce by more than 70,000 roles between 2025/26 and 2027/28.
Government should look forward, not back, when assessing the size of the civil service
The government is right to seek efficiency, and it is legitimate that reducing the size of the civil service forms a part of its plans. It seems uncontroversial that the civil service should be as small as it can be, consistent with fulfilling the government’s objectives and maintaining state capability. As discussed above, the civil service has grown substantially since 2016, often at rapid rates. And though this expansion was from a low base, reflects the increase in permanent post-Brexit functions and has been largely driven by the need for more front-line capacity, there is likely to be room to reduce headcount in certain parts of the civil service.
What matters is how that reduction happens. As we have argued before, headcount targets are a blunt tool. 213 Thomas A, Cutting the civil service: How best to slim down and save money, Institute for Government, 3 November 2022, www.instituteforgovernment.org.uk/publication/report/cutting-civil-service There is no objective reason to assume that either of the pre-pandemic or pre-EU referendum periods represented the optimum size of the civil service. The government should instead engage in comprehensive workforce planning – taking a serious look at what the demands on the civil service will be over the medium to long term, before considering what that means for civil service numbers.
This should involve looking forward, not back to convenient markers in the UK’s recent history. There will, for example, be huge pressure 214 Hoddinott S, Davies N, Fright M, Nye P and Richards G, Performance Tracker 2023, Institute for Government, 30 October 2023, www.instituteforgovernment.org.uk/publication/performance-tracker-2023 on public services for the foreseeable future and a likely need for more staffing in areas such as prisons and immigration casework. On the other hand, greater automation, the wider take up of artificial intelligence tools in the public sector and a serious look at the size and spread of back-office professions, such as policy, may push the necessary number of civil servants in the opposite direction.
There are some welcome signs that this kind of thinking is being done. In November Oliver Dowden announced an ‘Incubator for AI’, which will consider how AI use in government can help to reduce civil service headcount. 215 Manancourt V, ‘Oliver Dowden’s ‘hit squad’ aims to replace UK civil service jobs with AI’, Politico, 20 November 2023, www.politico.eu/article/dowdens-hit-squad-aims-to-replace-civil-service-jobs-with-ai Hunt’s linking of the new headcount target to the cross-government public sector productivity programme, announced in June and being carried out by the chief secretary to the Treasury, is also a positive sign. 216 HM Treasury, ‘Autumn Statement 2023’, Gov.uk, 22 November 2023, updated 30 November 2023, www.gov.uk/government/publications/autumn-statement-2023
But it is not helpful to have set an arbitrary target in advance. Targeting ‘pounds not people’ is, as we have argued, a far more sensible approach. 217 Thomas A, Cutting the civil service: How best to slim down and save money, Institute for Government, 3 November 2022, www.instituteforgovernment.org.uk/publication/report/cutting-civil-service And this should start with coherent and comprehensive workforce planning that maps the government’s priorities against the resources required to deliver them. This would help to avoid the boom and bust cycles of civil service numbers outlined in this section, as well as the over-reliance on consultants and temporary labour (more on which below).
Turnover of civil servants
‘Churn’ has fallen but remains high
In debates about the efficacy of the civil service, the frequency with which staff change roles is as much of a theme as their overall numbers. The latest figures show that this long-running problem continued in 2022/23 – when more than one in 10 civil servants either moved between departments or left the civil service entirely (11.9%). This marked a fall on the post-pandemic peak of 13.6% staff turnover in 2021/22, but remains higher than at any other point since at least 2010/11. And these statistics do not include moves within government departments, meaning they remain an underestimation of overall civil service ‘churn’. This is a problem for the civil service because high turnover damages productivity, undermines subject knowledge and expertise, disrupts projects and increases the resources required for recruitment and training. 218 Sasse T and Norris E, Moving On: The costs of high staff turnover in the civil service, Institute for Government, 2019, www.instituteforgovernment.org.uk/publications/moving-on-staff-turnover-civil-service
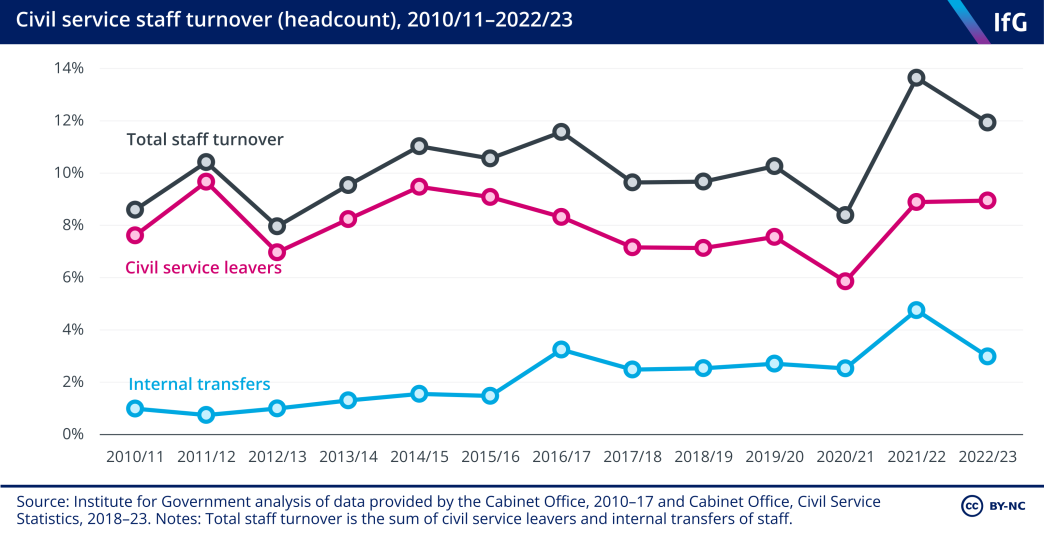
The reduction in staff turnover in the latest year has been driven by fewer civil servants taking new roles in other government departments, down to 3% in 2022/23 from 4.8% in 2021/22. However, the proportion of civil servants leaving the civil service altogether remained at its post-pandemic peak of 8.9% in 2023/23 – the highest level it has been since 2015/16. This is a particular concern, given declining morale among civil servants, addressed in detail below. Demotivated civil servants are more likely to be open to new and often higher paid employment options outside the service – something that should be seen as a red flag for civil service leaders aiming to retain top talent.
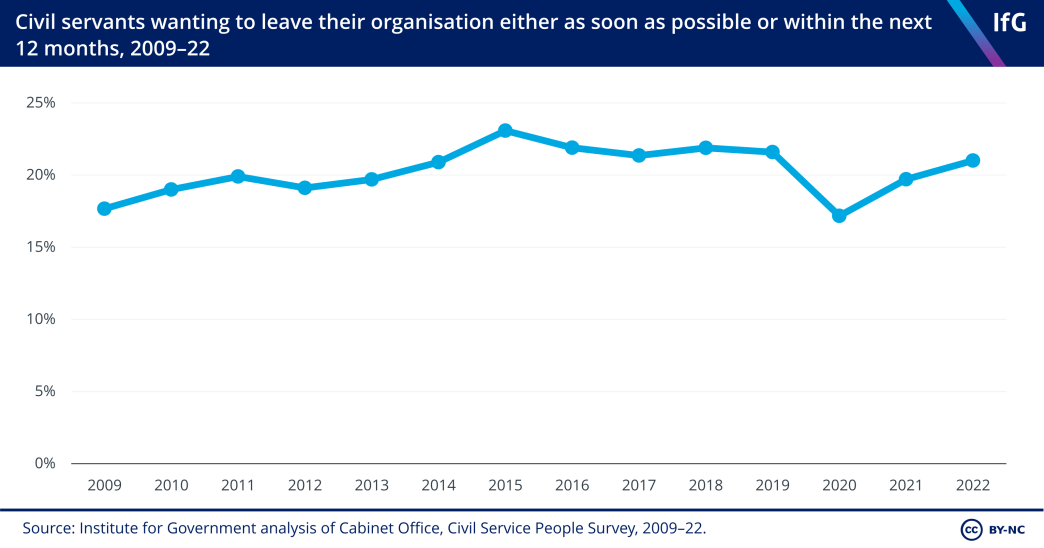
The data also chimes with the results of the Civil Service People Survey, which has found that the proportion of civil servants who want to leave their organisation either as soon as possible or in the next year has increased for the past two years, from a recent low of 17% in 2020 to 21% in 2022. This increase, however, has reversed a sharp fall in the proportion of officials who wanted to leave during the pandemic, and remains comparable to pre-pandemic levels.
Turnover is highest at the centre of government, at around a quarter in both the Treasury (26.2%) and the Cabinet Office (23.7%). In some senses this is understandable, given the common model for civil servants to serve a period at the centre of government before moving back into departments, in a mutually beneficial exchange. But this churn also causes problems. For example, the Institute has previously identified high turnover in the Treasury as undermining the department’s ability to take a long-term strategic view of government spending. 219 Sasse T and Norris E, Moving On: The costs of high staff turnover in the civil service, Institute for Government, 2019, www.instituteforgovernment.org.uk/publications/moving-on-staff-turnover-civil-service
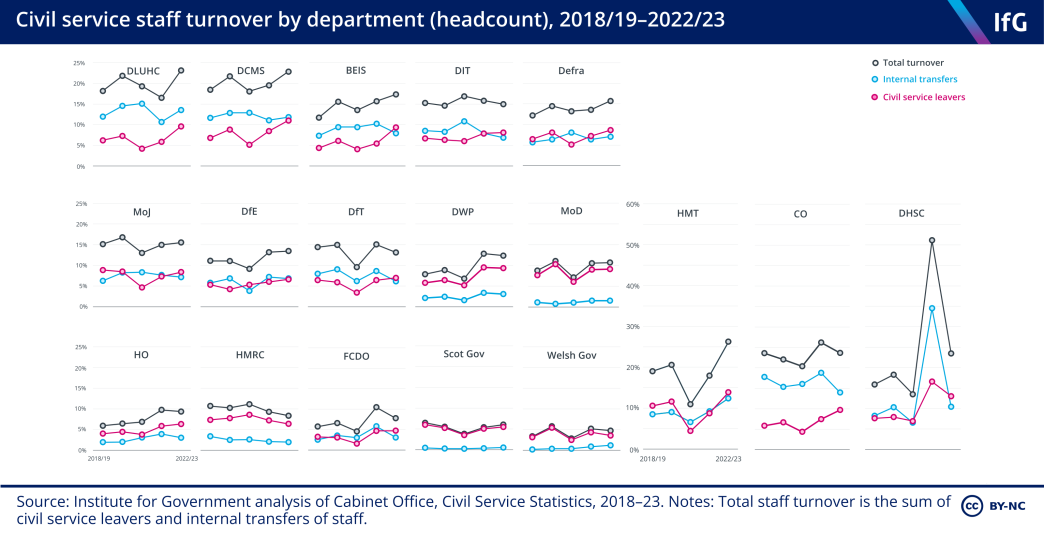
Elsewhere, smaller departments, those focused on policy and those with higher concentrations of staff in London tend to have higher than average levels of turnover. DHSC, DLUHC, DCMS, BEIS, Defra and DIT****** each had turnover at oe above 15% in 2022/23.
By contrast, bigger departments and those operating more front-line services tend to have relatively low levels of turnover. HMRC, the Home Office and MoD – the first two of which, as shown above, have high proportions of staff in the operational delivery profession – each had turnover below the civil service average of 11.9%. Turnover is, however, slightly above average at DWP – at 12.4% – and is notably above average at MoJ at 15.5%, likely reflecting high rates of turnover among HM Prison and Probation Service staff.
220
Davies N, Hoddinott S, Fright M, Nye P, Shepley P and Richards G, Performance Tracker 2022/23: Spring update,
Prisons, www.instituteforgovernment.org.uk/performance-tracker-2022-23/prisons
Turnover remains lowest in the Scottish and Welsh governments, at 6% and 4.7% respectively.
* The Department for Culture, Media and Sport. For a list of department initialisms, see Methodology.
** More than 800 staff moved from DCMS to DSIT following the February 2023 MoG change, but are still within DCMS’s payroll and so are reported within that department. In the future, these staff will be reported under DSIT, considerably increasing the reductions in DCMS.
*** This report refers to the digital, data and technology (DDaT) profession, though in November 2023 this was rebranded as government digital and data.
**** Here and throughout we refer to departments, including DIT, that were closed or merged as part of the machinery of government changes in February 2023. We do this where relevant to the analysis to which we are referring.
***** These conclusions must be treated with some caution, again given the historic poor quality of the data. In some departments, for example, the proportion of the workforce whose profession is not reported has fallen in recent years – making it difficult to determine whether apparent growth in some professions is real, or the result of roles that have always existed being reported for the first time. This is true of MoD in particular, where our ‘all other professions’ category includes large numbers of staff with an unreported profession, and apparent increases in some professions in recent years coincide with falls in the ‘unreported’ category. It is also the case that historic poor reporting can suggest unrealistically large changes. In DCMS, for example, the policy profession appears to be no less than 87 times larger in 2023 than in 2016 – which is likely explained by the 510 staff with an unreported profession in 2016.
****** Prior to the full implementation of the MoG changes announced in February 2023, in which BEIS and DIT were merged to become DBT.
Structure and location of the civil service
Restructuring departments
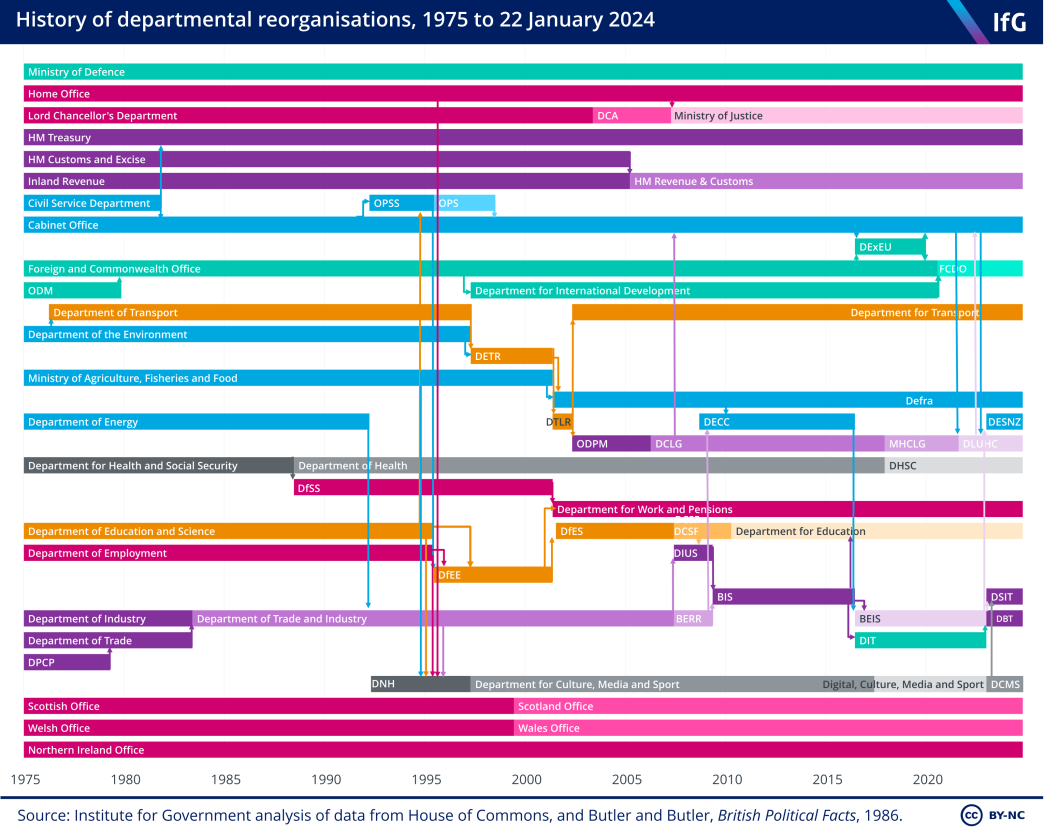
Machinery of government changes are disruptive, but there was a logic to Sunak’s 2023 restructuring
Prime ministers often change departmental structures – whether to signal their commitment to a policy area, bring together areas they feel fit well or for more political reasons. 241 Dalton G, ‘Machinery of government changes’, Institute for Government, 4 April 2023, www.instituteforgovernment.org.uk/explainer/machinery-government-changes In February 2023, a few months after becoming prime minister, Rishi Sunak embarked on a significant set of such departmental reorganisations. Three new departments were created: energy and net zero policy were combined into the Department for Energy Security and Net Zero (DESNZ), in an echo of the former Department of Energy and Climate Change. Business and trade policy were reunited in the Department for Business and Trade (DBT). The Department for Science, Innovation and Technology (DSIT) was more novel, created from various parts of the rest of government, especially the Department for Digital, Culture, Media and Sport, since renamed as the Department for Culture, Media and Sport (DCMS).
Machinery of government (MoG) changes are only rarely worth the cost, disruption and distraction. 242 Durrant T and Tetlow G, Creating and dismantling government departments: How to handle machinery of government changes well, Institute for Government, 15 November 2019, www.instituteforgovernment.org.uk/ publication/creating-dismantling-government-departments Sunak’s reorganisations, like all others, created difficulties with unclear lines of responsibility as well as more mundane but important factors like email and IT confusion. These and other issues – which are real but often imperceptible to ministers – take a long time to address: at the time of writing there are still cases where file sharing within the new departments is impeded between staff formerly of separate departments, and problems with security passes and other logistical frustrations have persisted. In a further sign of disruption, it remained unclear for most of 2023 how many staff the new departments had – despite the changes formally occurring in February, they were unable to report quarterly staff numbers in March, June or September.* The first data on the new departments’ staff numbers came in December.
All that said, the latest MoG changes do have merit and will likely prove worthwhile in the longer term. BEIS, the main forerunner department, had become large, with a vast remit spanning very different areas of policy. In this context, there was a logic in returning to a structure that had previously existed, and the transition was made less disruptive than others by the fact that the relevant teams had remained distinct within BEIS. Similarly, business and trade sit naturally alongside one another in DBT. The mistake was arguably the creation of the Department for International Trade in the first instance, which created an incentive to prioritise concluding trade agreements over securing the best outcome from a business or economic perspective. Internalising more of the trade-offs in one department may lead to better decision making.
DSIT, with fewer direct policy and operational levers, has the most uncertain future. Its formation is clearly a result of the prime minister’s personal interest in its agenda, and there is a risk that it currently relies overly on political influence for its clout. Building on DCMS’s success in expanding its data, digital and technology capacity was an alternative option. Now that the department is established, however, it is important that it is fully embedded into Whitehall – for example, by ensuring it has an established working relationship with the Cabinet Office on digital and data issues.
Public bodies
There has been progress in reviewing public bodies…
While less eye-catching than large departmental reorganisations, changes to the landscape of public bodies also have a significant impact on the functioning of the state. Since 2010, there have been a series of programmes reviewing the need for, and performance and governance arrangements of, the hundreds of public bodies, including arm’s-length bodies (ALBs), 243 Dalton G and Gill M, ‘Public bodies’, Institute for Government, 25 January 2022, www.instituteforgovernment. org.uk/explainer/public-bodies that deliver public or government services.
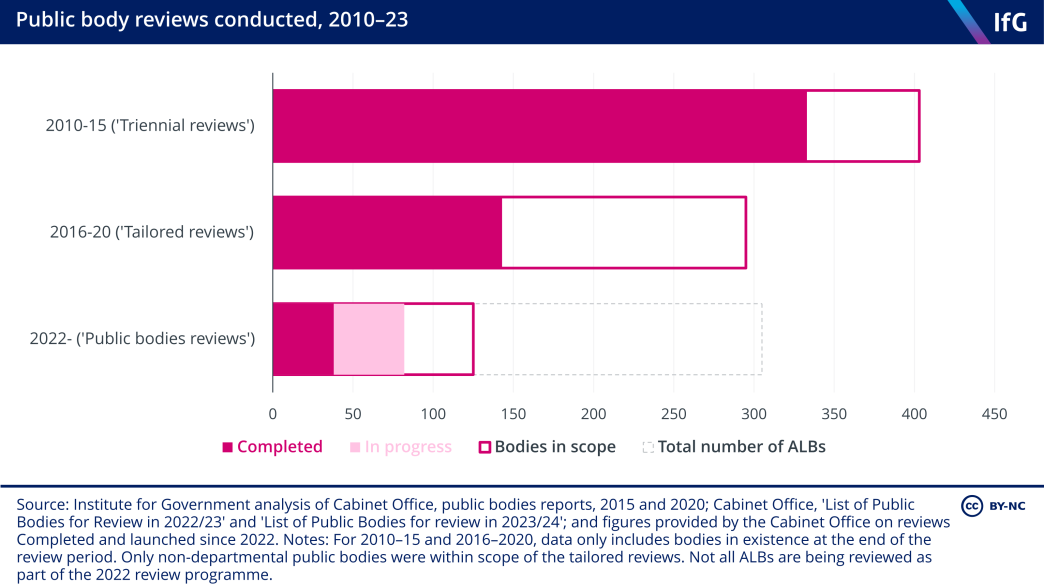
The current public bodies review programme was launched in April 2022. 244 Cabinet Office, ‘Public Bodies Review Programme’, Gov.uk, 26 April 2022, updated 25 September 2023, https:// www.gov.uk/government/publications/public-bodies-review-programme It has more realistic goals than its predecessors – using a self-assessment process and departmental prioritisation to determine which arm’s-length bodies require full-scale reviews, rather than aiming to review all such bodies within one parliament. Reflecting this emphasis, the Cabinet Office has committed to an ‘initial’ 125 reviews 245 Quin J, ‘Speech: Skills, Efficiency and Technology in the Civil Service’, GOV.UK, 19 July 2023, www.gov.uk/ government/speeches/speech-skills-efficiency-and-technology-in-the-civil-service – with a focus on larger bodies meaning that the vast majority of ALB activity by expenditure is in scope. 246 Quin J, ‘Speech: Skills, Efficiency and Technology in the Civil Service’, GOV.UK, 19 July 2023, www.gov.uk/ government/speeches/speech-skills-efficiency-and-technology-in-the-civil-service
In all, the programme appears to be progressing more in line with expectations than did the ‘tailored reviews’ of 2016–20. Of the 82 reviews launched as of January 2024 approaching half have been completed (although nearly a third of this 38 have not yet been published). The number of bodies scheduled for review in 2023/24 is slightly larger than last year, with three reviews carried over. 247 Cabinet Office, ‘List of Public Bodies for Review In 2023/24’, GOV.UK, last updated 25 September 2023, retrieved October 2023, www.gov.uk/government/publications/public-bodies-review-programme/list-ofpublic- bodies-for-review-in-202324 Interviews with reviewed bodies suggest that while the self-assessment process is detailed, it is helpfully explicit as to how bodies are being assessed, giving them greater clarity and certainty than before.
There are, however, some potential concerns about the programme. While the emphasis on prioritisation should focus resources towards the highest-risk bodies, many reviews completed in the first year of the programme have been of smaller, lower-spending bodies – with the danger that reviews of higher-spending, more strategically important bodies are delayed.
Interviews with reviewed bodies also suggest that sponsorship arrangements between ALBs and their parent departments are not being properly considered, partly because of the major role departments themselves play in the process – and despite consideration of sponsorship arrangements being an explicit aim of the reviews.
Recruiting independent reviewers to lead each process was intended to help with this, but their levels of experience and robustness have varied. Departments should welcome critical feedback and take the learning approach to reviews that they would expect of ALBs.
Finally, compliance with the requirement to identify savings of more than 5% of day-to-day spending through the reviews has been inconsistent. While the imposition of fairly arbitrary financial targets across the diversity of ALBs is unhelpful, in the absence of any change to the review guidance the Cabinet Office should ensure this requirement is consistently observed.**
…and a welcome shift of focus, away from reducing numbers as an end in itself
Previous reviews of public bodies have focused explicitly on reducing their number. The Cameron government’s ‘bonfire of the quangos’ and its aftermath saw the overall number of ALBs fall by 62% between 2010 and 2020. 248 Dalton G and Gill M, ‘Public bodies reform’, Institute for Government, 25 January 2022, www.instituteforgovernment.org.uk/explainer/public-bodies-reform While the Cabinet Office has not published the number of ALBs since the start of the pandemic, when there were 295 bodies, 249 Cabinet Office, ‘The Arms Length Body (ALB) landscape at a glance’, GOV.UK, 2020, https://assets.publishing. service.gov.uk/government/uploads/system/uploads/attachment_data/file/1001885/Public_Bodies_2020. pdf it told us that there are now 305 – a level last seen in 2017.
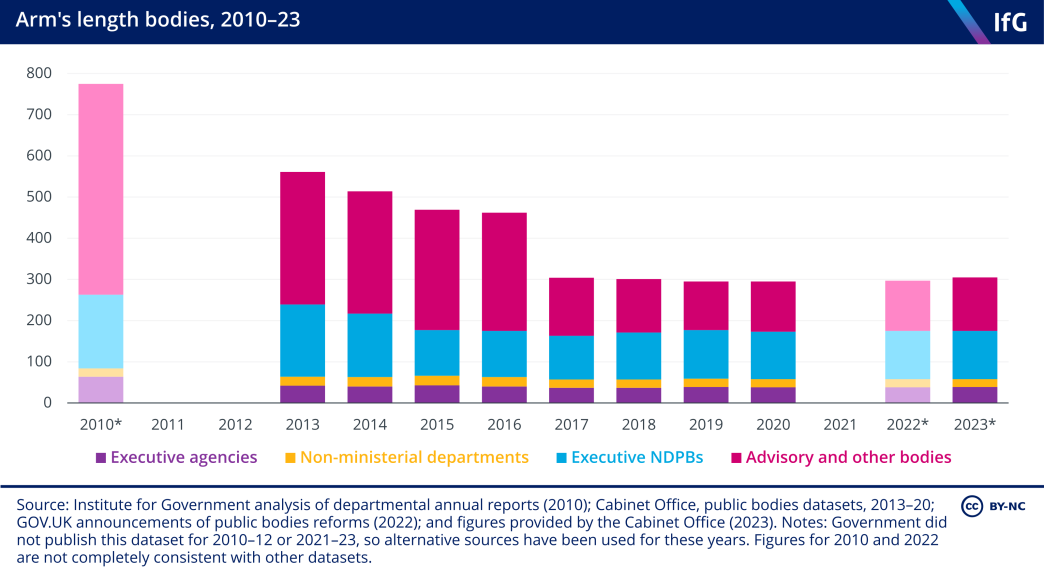
The rising number of ALBs partly reflects new bodies being created to administer functions previously undertaken by EU institutions; for example, the Trade Remedies Authority and the Office for Environmental Protection. But new bodies have also been established for other reasons: to provide infrastructure finance (the UK Infrastructure Bank); to fund scientific research (the Advanced Research and Invention Agency); to approve and inspect schemes to enable walking and cycling (Active Travel England); and to deliver broadband and 4G to rural areas (Building Digital UK). The remainder of the increase reflects the reclassification of existing organisations; for example, bodies previously ‘unclassified’ being brought into the more strictly defined category of ALB,*** or largely state-funded private or third-sector organisations being incorporated into government.**** 250 Johal R and Davies N, IfG case study: Oak National Academy, Institute for Government, August 2022, www.instituteforgovernment.org.uk/publication/oak-national-academy
The increase in the number of ALBs obscures the fact that 11 have been closed since 2020. The Birmingham Organising Committee for the 2022 Commonwealth Games closed, as planned. Other organisations were brought into their sponsoring departments (such as NHS Improvement) or merged with other public bodies. 251 NHS England, ‘Health Education England, NHS Digital and NHS England have merged into a single organisation’, 2023, www.england.nhs.uk/nhs-digital-merges-with-nhs-england Some were simply abolished, such as the Independent Commission on Civil Aviation Noise, which was closed in 2021 following a review by the Department for Transport. 252 Department for Transport, Review of the Independent Commission on Civil Aviation Noise (ICCAN), GOV.UK, September 2021, www.gov.uk/government/publications/review-of-the-independent-commission-on-civilaviation- noise
Nonetheless, this modest rise in the number of ALBs suggests that the government has tempered its ambition to reduce the number of public bodies as an aim in itself. The new review programme has so far emphasised cost efficiency instead. This is welcome, as governments’ preoccupation with driving down numbers has previously led to the short-sighted abolition of useful (if flawed) bodies like the Audit Commission, 253 Dalton G, Amos N and Gill M, Abolishing Public Bodies: Ten lessons from previous restructures, Institute for Government, March 2023, www.instituteforgovernment.org.uk/publication/abolish-public-bodies or mergers of bodies whose functions were mismatched, as was arguably the case with the creation of Public Health England. 254 Timmins N, ‘Strengthening health protection: right idea, wrong time’, The King’s Fund, 20 August 2020, www.kingsfund.org.uk/blog/2020/08/strengthening-health-protection-right-idea-wrong-time; Gill M and Dalton G, When Should Public Bodies Exist: Rewriting the ‘three tests’ for when government does things at arm’s length, Institute for Government, 2023, www.instituteforgovernment.org.uk/publication/public-bodies-tests
It is, however, important to note that officials conducting these reviews of public bodies are still required to consider the government’s ‘three tests’ for the existence of a public body. 255 Cabinet Office, ‘Guidance on the undertaking of Reviews of Public Bodies’, GOV.UK, updated 25 September 2023, retrieved 5 October 2023, www.gov.uk/government/publications/public-bodies-review-programme/ guidance-on-the-undertaking-of-reviews-of-public-bodies#purpose-of-alb-reviews These tests should be changed – as the Institute set out in our 2023 report When should public bodies exist?, the current ‘three tests’ unhelpfully stipulate that ALBs should be treated as a ‘last resort’ – even when they would be the most effective mechanism for delivering government objectives. 256 Gill M and Dalton G, When Should Public Bodies Exist: Rewriting the ‘three tests’ for when government does things at arm’s length, Institute for Government, 2023, www.instituteforgovernment.org.uk/publication/publicbodies- tests
Moving civil servants out of London
The government has made progress moving civil servants out of London
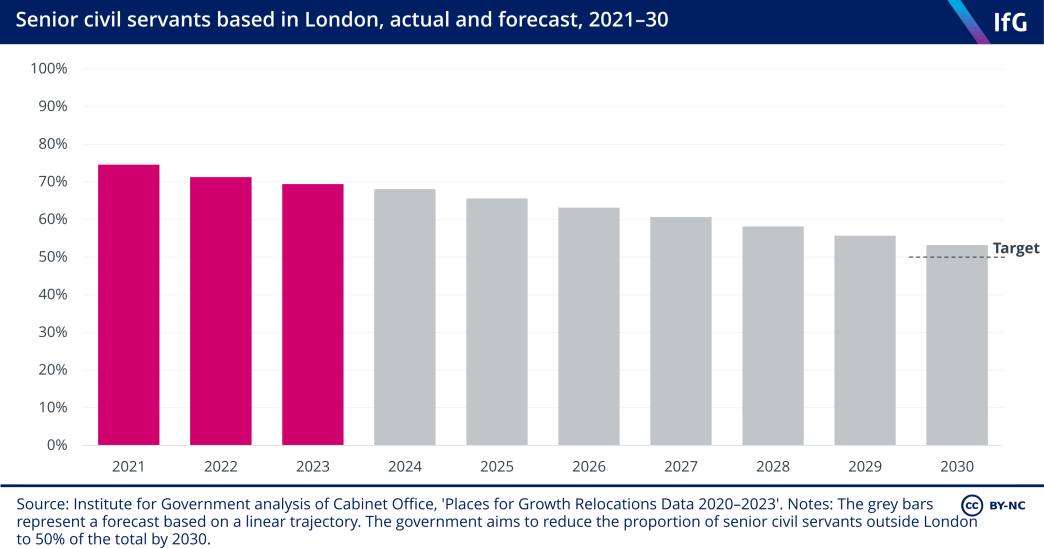
Efforts to make the civil service less London-centric have been a long-running, but recently increasingly successful, theme of civil service reform. The Johnson government instigated a renewed effort to relocate civil servants following the 2019 general election and, at the March 2020 budget, a target was set for 22,000 more roles to be based outside London by 2030. June 2021’s Declaration on Government Reform subsequently added a target of 50% of senior civil service roles being based outside London by the same year. While we are critical of targets for overall headcount reductions, because they target a proxy (people) rather than the root ambition of the policy (to reduce the cost of the civil service), headcount targets for relocation are more useful because the end goal is the precise change sought: to move people.
In December 2023 the government announced it was bringing the 22,000 target forward to 2027, in part because it had already relocated just over 16,000 roles. It also explained that the government excludes Scottish and Welsh government civil servants from Places for Growth targets, although stopped short of explaining exactly how the 22,000 target itself is calculated. A recent Public Administration and Constitutional Affairs Committee (PACAC) report suggested the figures referred to the number of new roles created outside London, rather than the number of London roles moved outside the capital. 257 Public Administration and Constitutional Affairs Committee, ‘Where Civil Servants Work: Planning for the future of the Government’s estates’, Eighth Report of Session 2022-23, 27 July 2023, https://publications. parliament.uk/pa/cm5803/cmselect/cmpubadm/793/report.html
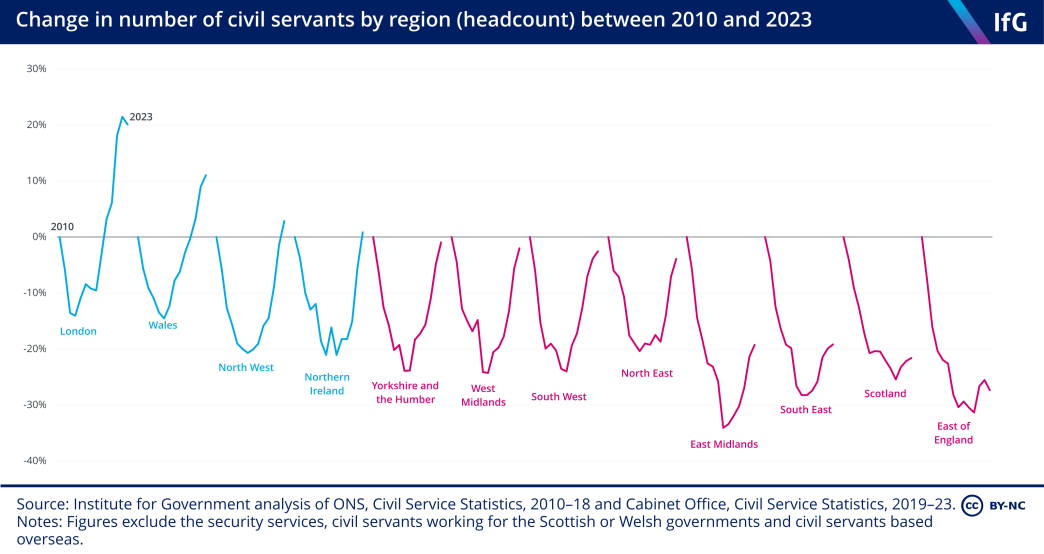
The recent progress made is positive. Between 2022 and 2023 the number of civil servants in London reduced for the first time since 2017, while the number in most other regions increased.
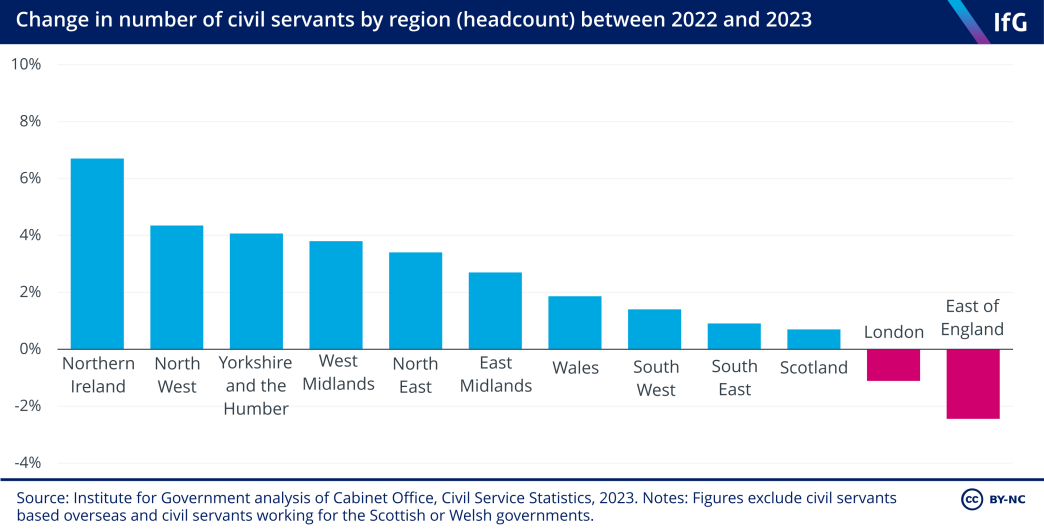
But this progress must be set in the context of a civil service that has become substantially more London-centric since 2010. As the civil service contracted from 2010–16, all regions in England saw a deeper proportional decline in staff numbers than London. During the post-Brexit expansion, London bounced back more strongly, and from a higher base. This means that, in total, the number of civil servants in London has grown by 20% over the past 13 years – the most of any region (see figure below).
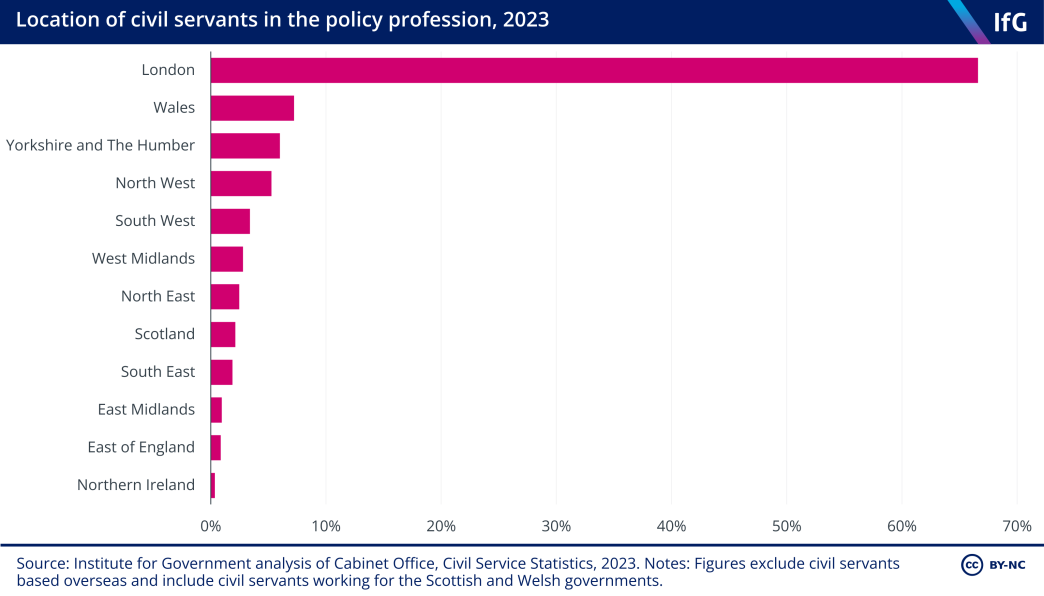
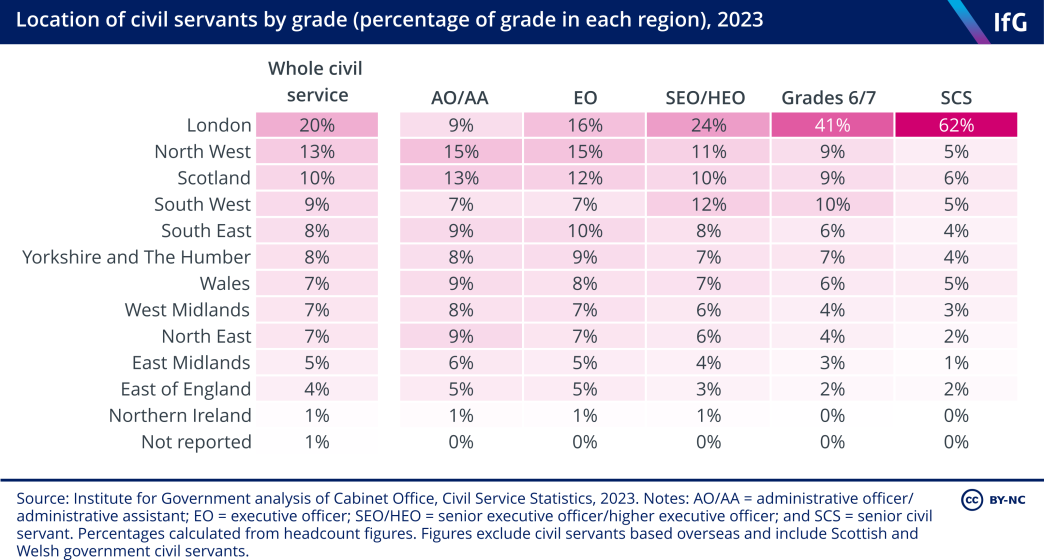
The percentage of senior civil servants in London has decreased from 74% in 2020 to 69% in 2023. This demonstrates progress towards the government’s 50% target (see second figure below). But it also shows the scale of the challenge the government still faces. A large proportion of policy professionals also remain based in London (67%) compared to the other nations and regions of the UK (see third figure below), while an analysis of the regional composition of the whole civil service shows the extent to which even grade 6 and 7 roles are concentrated in the capital (see fourth figure below).*****
There is increasing evidence that relocation improves the civil service’s effectiveness
As the number of relocated roles grows, there is increasing practical evidence that moving more civil servants – particularly policy professionals and senior civil servants – outside the capital can make the civil service more effective, in three main ways. 258 Urban J, Pope T and Thomas A, Settling In: Lessons from the Darlington Economic Campus for civil service relocation, Institute for Government, 2023, www.instituteforgovernment.org.uk/publication/darlington-civilservice- relocation
First, it offers talented people who cannot or do not want to live or work in London more opportunities to take on senior or policy roles. For example, over two thirds of Treasury officials at the Darlington Economic Campus are new to the civil service (69%), and most of the DEC’s staff have been recruited from Darlington and its surrounding areas (80%). This allows civil servants from different backgrounds to more effectively contribute to the civil service. For example, the Cross Government Social Mobility Network chair described relocation as “game-changing” for the civil service’s ability to attract people from lower socio-economic backgrounds. 259 ‘London office exodus a ‘game-changer’ – Cross Government Social Mobility Network chair reflects on 2023’, Civil Service World, 9 January 2024, www.civilserviceworld.com/in-depth/article/any-sickly-christmascocktail- is-a-hit-for-me-kate-lalor-on-her-most-and-least-favourite-parts-of-the-season
Second, it helps to change the way policy is made by exposing policy makers to different views and stakeholders. As one interviewee for our research into Darlington put it: “In London, we read what Torsten Bell thinks. Up here, we’re talking to different people, hearing different things.”
Third, it helps to increase ‘pride in place’ and give an (albeit limited and highly localised) economic boost, and in so doing supports the government’s levelling up agenda. One interviewee in Darlington described how the campus had put the town “on the map”; another called it “a beacon you can hold up to show what a great place we can be”.
But setting up new offices is one thing; making them work in the long term is another. There are several factors critical to the relative success of relocation so far:
- Support from key stakeholders. There must be continued senior civil service presence and leaders must inject a sense of identity and purpose into a new office; ministers must give positive permission for staff to practise hybrid ways of working and continue to visit; staff should have viable and varied career routes.
- A focus on attracting and retaining the best people. Jobs in the civil service must be more accessible to external recruits; career paths should be adapted to suit local workforces and should model best practice to the rest of the civil service, with reduced churn; and offices must establish and maintain their own versions of sought-after ‘accelerator roles’, which advance people’s civil service careers.
- Keeping focused on being national policy makers. While embracing and demonstrating the benefits of developing and providing policy advice from outside London, staff must retain a national focus and be alert to the risks posed by working across multiple sites and away from parliament.
- Co-locating departments in a thematic campus. Co-location, ideally in the same building, can reduce departmental silos. It can also give civil servants varied career paths, while also channelling movement between jobs more productively to allow officials to develop greater subject-specific knowledge.
- Leaning into the existing strengths of an area when deciding which departments to base there. This makes it easier to recruit staff with the necessary skills and improves the chances of an economic multiplier effect.
There is evidence that the civil service has learnt the right lessons from relocation success so far. For example, recent Places for Growth guidance encouraged departments and public bodies to co-locate in thematic campuses, while the December 2023 announcement of a DSIT second HQ in Greater Manchester and DBT second HQ in Darlington leant into the existing strengths of those areas. 260 Cabinet Office, ‘Plan to move government roles out of Westminster brought forward and new headquarters unveiled’, Gov.uk, 12 December 2023, https://www.gov.uk/government/news/plan-to-move-governmentroles- out-of-westminster-brought-forward-and-new-headquarters-unveiled
But other aspects of the December announcement were less encouraging. DESNZ’s second HQ seems to be a standalone office located in Aberdeen, a city that currently only has around 50 UK civil servants. As it stands, building a meaningful civil service career in the city will be hard and so it may not be a magnet for policy professionals or senior staff – the two groups it is particularly important for relocated offices to attract if they are to make an impact. Building a thematic campus around net zero could be a more viable long-term approach.
* In each of these three quarterly releases of public sector employment figures, which include civil service staff numbers, the ONS noted regarding the machinery of government changes that “the full transition programme is yet to complete and consequently the new departments were not in a position to report per the new structure for the [month] 2023 statistics. All affected departments and their associated agencies will appear under existing hierarchies until the transition programme is complete.”
** The Institute has previously argued that while improving value for money is an important consideration, the imposition of arbitrary financial targets is unhelpful, particularly when improving the performance of public bodies might entail short-term investments to improve efficiency in the long term.
*** British Technology Investments and the Financial Reporting Council are examples.
**** Oak National Academy, which began as an online classroom and teaching resource hub during the pandemic, is an example.
***** The data used in the figures showing the location of civil servants in the policy profession and the location of civil servants by grade (percentage of grade in each region) include civil servants in the Scottish and Welsh government. This is because the Civil Service Statistics do not break down in a way that allows Scottish and Welsh civil servants to be excluded from these analyses, as per Places for Growth’s clarified methodology.
Budgets and major projects
Departmental spending
Inflation is squeezing already tight departmental budgets – with staff costs set to shrink significantly
Departments are struggling with increasingly tight budgets. The 2021 spending review, which covered three years to 2024/25, was viewed as relatively generous at the time of announcement. Day-to-day spending was set to increase substantially relative to (non-Covid) spending in 2021/22 in the following three years.
Since then, inflation has been much higher than expected. This has meant higher costs facing departments, most importantly through higher pay awards to public sector workers.* The government has provided some extra money to prop up struggling public services, but even so the overall generosity of plans has now been eroded (as shown in the figure below). What began as a spending review of comparable generosity to the 2004 exercise – which included relatively generous settlements for most departments – now resembles the plans laid out in 2007, which many commentators at the time considered tight. 283 Emmerson C and Tetlow G, The 2007 comprehensive spending review: a challenging spending review?, Institute for Fiscal Studies, October 2007, https://ifs.org.uk/sites/default/files/output_url_files/bn75.pdf
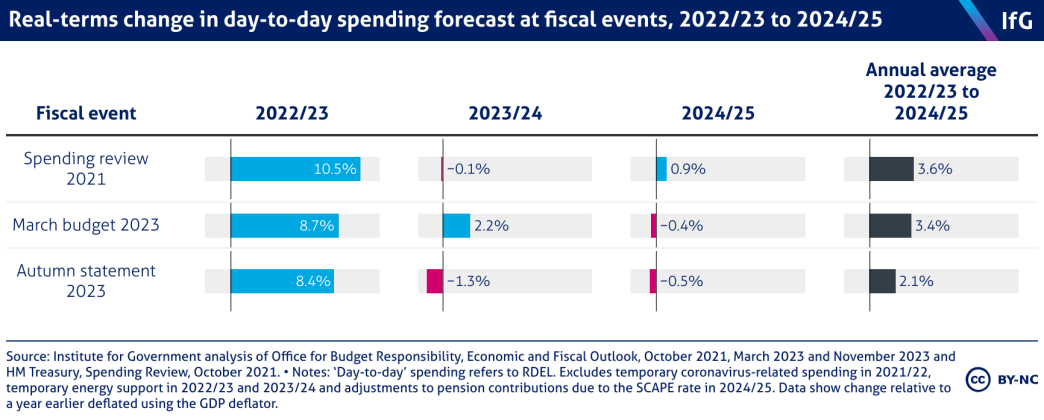
As this shows, spending increases have not been even across the three years covered by the spending review but were ‘front-loaded’. This means departments planning their budgets for next year (2024/25) are, on average, facing real-terms reductions following cuts this year. Delivering these cuts will be difficult given growing demands on government spending, not least due to declining public service performance outlined in the Institute’s Performance Tracker. 284 Hoddinott S, Davies N, Fright M, Nye P and Richards G, Performance Tracker 2023, Institute for Government, October 2023, www.instituteforgovernment.org.uk/sites/default/files/2023-10/performance-tracker-2023_0. pdf
These pressures also have an impact in Whitehall. Most government spending is on the programmes it delivers through the NHS, schools and defence. Only a fraction – around 3.5% of day-to-day spending – goes directly on the civil service. This spending is not exempt from the planned squeeze next year; in fact, the government’s official spending plans imply very large cuts in spending on civil servants over this financial year and next.
As the below figure shows, administration staff cost budgets submitted by departments in the middle of 2023 show spending 22% lower in real terms in 2024/25 than 2022/23. If we assume a similar fall to the overall civil service pay bill, these plans have total spending on civil servants falling by £2.5bn in cash terms between last financial year and next year.** Given likely inflation-linked increases in pay, this would require cutting civil service numbers by over 20%, or approximately 100,000, within the year. It would take spending on the civil service relative to total spending to its lowest level since at least 2010.
![[Tuesday 15:59] Rhys Clyne A line chart from the Institute for Government of the civil service pay bill and administration staff costs 2010/11 to 2024/25 (in 2023/24 prices) where spending is shown to be 22% lower in real terms in 2024/25 than in 2022/23.](/sites/default/files/styles/wysiwyg_full_width_desktop/public/2024-01/civil-service-pay-bill.png?itok=9M1CiMt7)
These plans appear to be undeliverable. To meet Jeremy Hunt’s target to reduce headcount to pre-pandemic levels, the number of civil servants would need to fall by more than 70,000 roles, but not until some time after the current spending review ending in 2024/25. These plans are also only indicative, and departments retain flexibility to spend their overall administration budgets differently, spending more on staff and less on other costs. As a result, we should expect spending plans for the next financial year to be updated to present a more realistic path. Even if these plans become more realistic, it is likely that spending on the civil service will still be a target for some savings next year, via Hunt’s cap on existing headcount and targeted recruitment freezes. If spending on staff followed planned overall administration budgets (rather than being cut more severely, as current pencilled-in plans imply), spending would still be slated to fall by 7.5% in real terms in 2024/25.***
Beyond 2025, no firm departmental totals have been allocated, nor a budget for spending on Whitehall. However, the overall spending envelope pencilled in to the government’s fiscal plans is extremely tight. Whether or not the government after the next election, whoever it may be, commits to Hunt’s planned reduction in civil service numbers, these tight overall plans imply Whitehall budgets are likely to be very tight for several years to come.
That means government is likely to focus on achieving better value for money where it is being spent, although Institute for Government analysis suggests that improving public services will also require more money. 285 Hoddinott S, Davies N, Fright M, Nye P and Richards G, Performance Tracker 2023, Institute for Government, October 2023, www.instituteforgovernment.org.uk/sites/default/files/2023-10/performance-tracker-2023_0. pdf Spending money more efficiently in public services will also depend on an effective civil service. A major squeeze on administrative spending, as implied by current plans, could make that more difficult.
The proportion of departments’ day-to-day spending via ALBs has increased
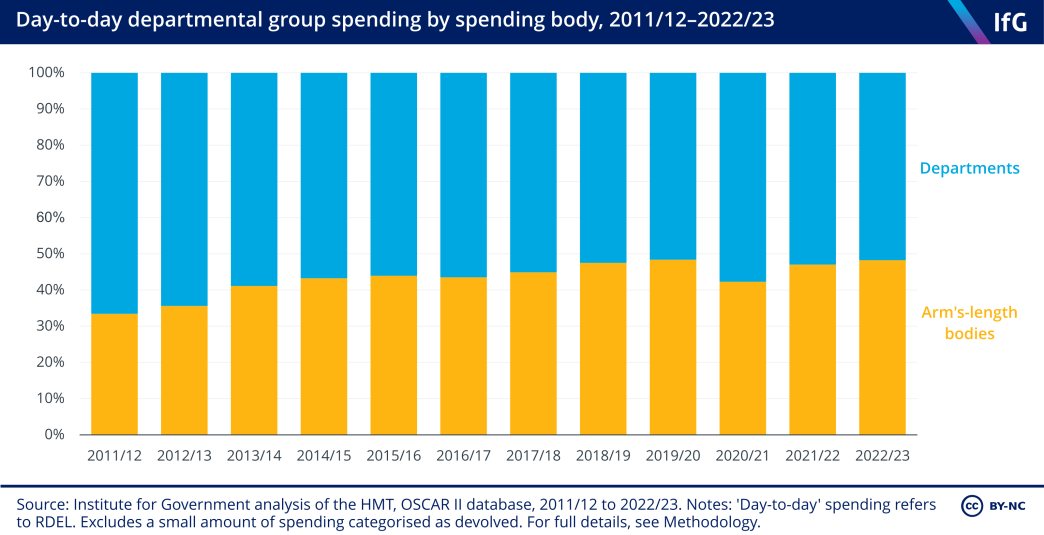
A significant proportion of departmental budgets is spent by their ALBs – and these proportions have increased slightly in 2022/23 in comparison to the ‘core’ departments. While this increased share of spending may partly result from a rise in the number of ALBs, it also reflects spending in core departments like DHSC and DfE beginning to fall back to pre-pandemic levels, following a period of unusually high spending by central government. 286 HM Treasury, Public Expenditure: Statistical Analyses 2023, CP 905, The Stationery Office, 2023, www.gov.uk/ government/statistics/public-expenditure-statistical-analyses-2023 NHS England is the highest spending ALB, accounting for more than half of the total ALB spending shown.
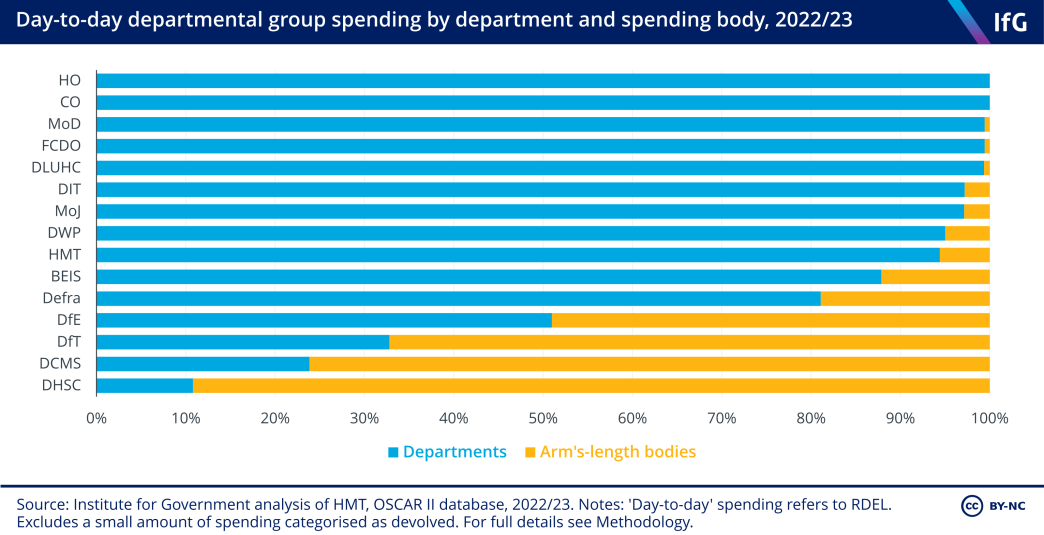
The amount spent through ALBs varies considerably between departments. The department with the highest proportion of day-to-day spending delivered via ALBs is, by a significant margin, DHSC – reflecting the scale of spending channelled through NHS England. By contrast, other departments such as DWP deliver major public services directly from the core department.
Major projects
The government’s major projects portfolio continues to grow in size and cost
Many of the government’s most complex, expensive and long-term projects are brought together in the government major projects portfolio (GMPP)* 287 HM Treasury, Treasury approvals process for programmes and projects, March 2020, https://assets.publishing. service.gov.uk/government/uploads/system/uploads/attachment_data/file/1173963/Treasury_Approval_ Process_Guidance_.pdf , maintained by the Infrastructure and Projects Authority (IPA). For projects of sufficient size and significance – from the delivery of T levels to the replacement of Trident – this allows the IPA to monitor their progress and support departments with delivery. The GMPP therefore provides a useful snapshot of the government’s ability to manage and deliver these complicated projects.
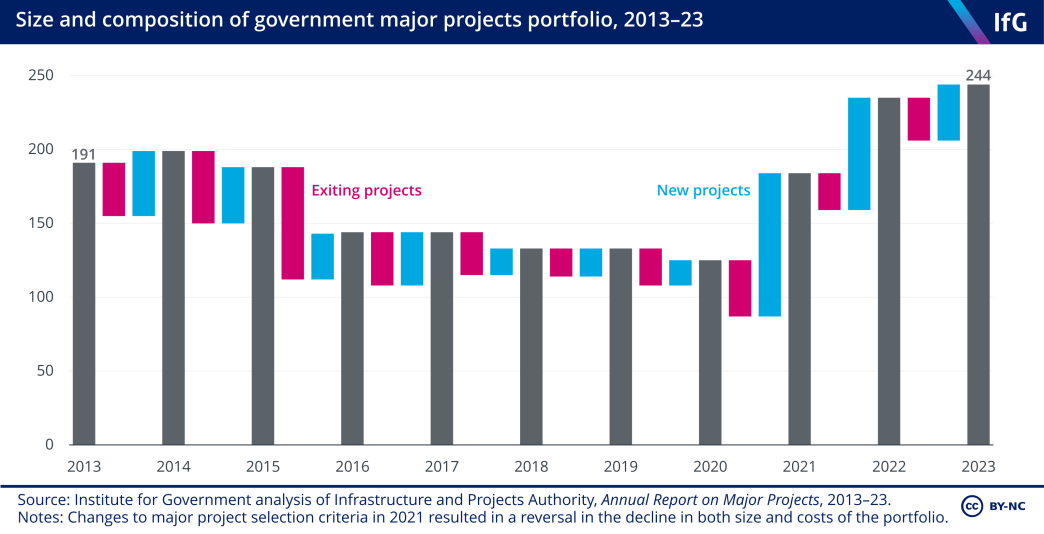
After a five-year period of reduction between 2015 and 2020, in 2021 the portfolio grew by nearly half to 184 projects from 125 in 2020. As well as an increase in the number of large projects being undertaken by departments, this growth was, at least in part, due to a change in the IPA’s approach. It is now doing more ‘front-loading’ – including projects in the GMPP at an earlier stage of their development.
The rate of growth slowed last year: the number of new projects joining the portfolio halved between 2022 and 2023. Some 38 projects were added in 2023, including HMRC’s Northern Ireland delivery programme to ease customs checks on goods shipped from Great Britain to Northern Ireland, in line with the terms of the Windsor framework. Most of these 38 projects were previously existing initiatives reclassified as major projects 288 Infrastructure and Projects Authority, Annual Report on Major Projects 2020–21, 14 July 2021, https://assets. publishing.service.gov.uk/media/60eefe0d8fa8f50c797792d2/IPA_AR2021_final_14Jul.pdf – only nine were entirely new in 2023.
The individual costs of most projects are published – the most expensive include the geological disposal of radioactive waste, the Universal Credit roll-out and Dreadnought- class submarines, each of which costs more than £20bn. 289 Infrastructure and Projects Authority, Annual Report on Major Projects 2022–23, 20 July 2023, https://assets. publishing.service.gov.uk/government/uploads/system/uploads/attachment_data/file/1175756/IPA-Annualreport- 2022-2023.pdf Some costs of individual projects are exempt from publication on grounds of commercial sensitivity or national security. But the total cost of exempt projects is published. This now accounts for 40% of the total cost of the portfolio (an increase from £208bn in 2022 to £348bn in 2023 in 2023/24 prices); as the criteria for exemption hasn’t changed, this may be a function of the phasing of projects in scope but it presents an unwelcome reduction in the extent to which parliament and the public can scrutinise the government’s delivery of major projects.
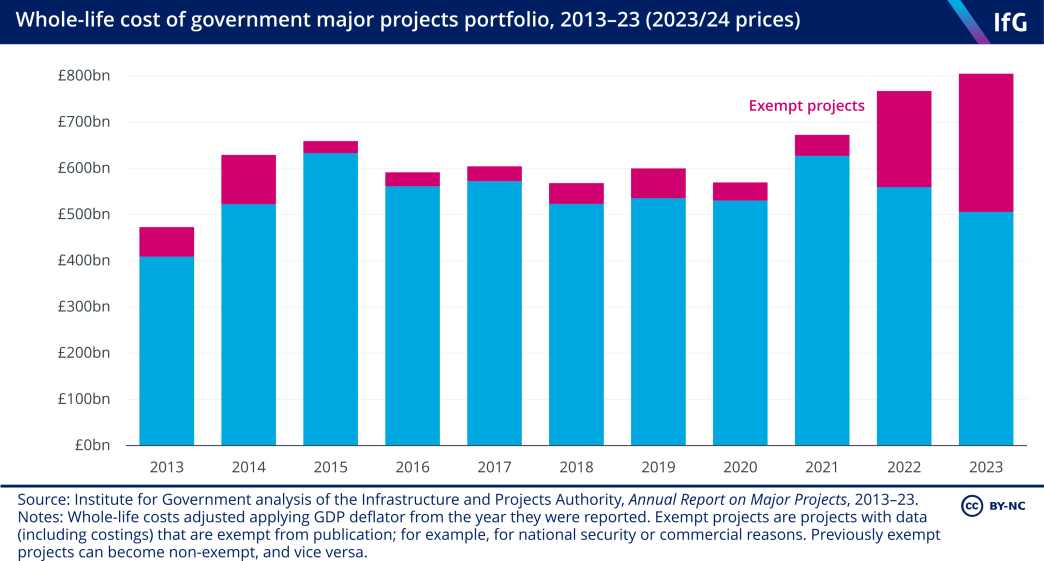
The whole-life cost of the GMPP has increased by £87bn to £853bn (in 2023/24 prices) between 2022 and 2023. Nearly two thirds of this increase came from projects new to the GMPP, while exempt projects are of relatively higher value within the portfolio: the number of exempt projects grew by 21%, their cost increased by 67% in real terms.
It is also notable that the monetised benefits of the programme have fallen below the total whole-life cost, returning £758bn from £805bn of cost. However, the portfolio includes projects that bring non-monetary benefits including those relating to national security and the provision of justice. 290 Infrastructure and Projects Authority, Annual Report on Major Projects 2022–23, 20 July 2023, https://assets. publishing.service.gov.uk/government/uploads/system/uploads/attachment_data/file/1175756/IPA-Annualreport- 2022-2023.pdf.pdf
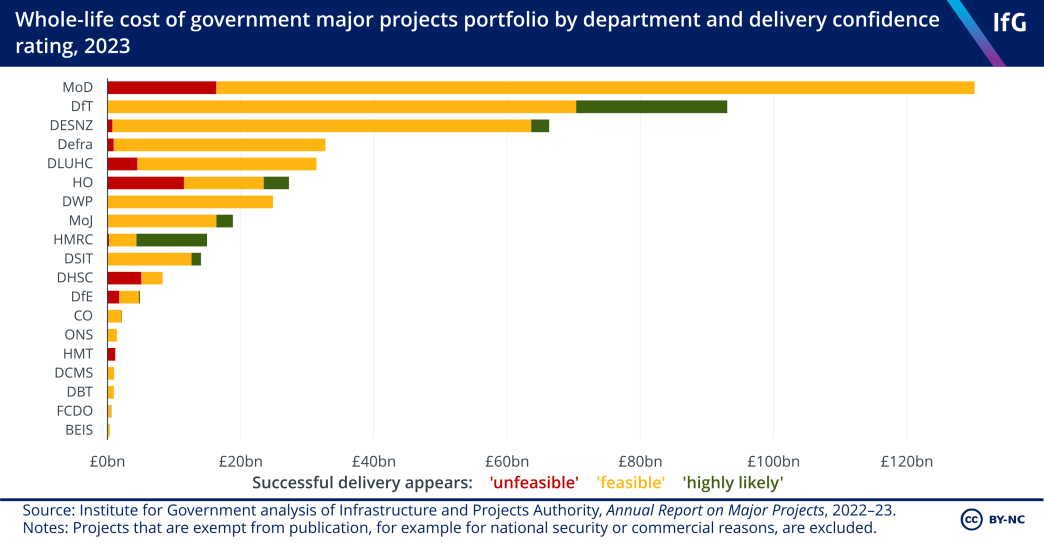
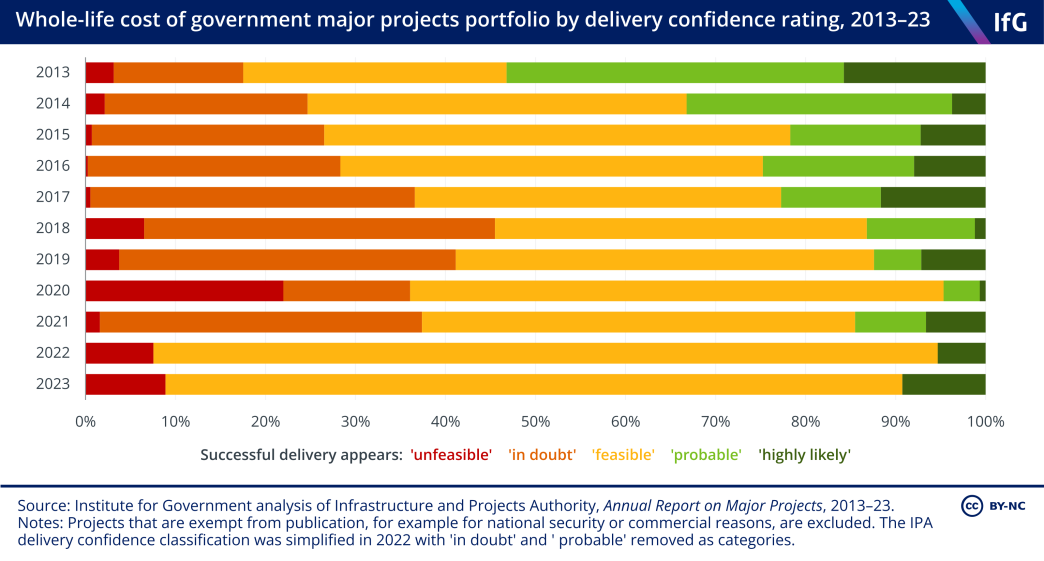
There has been a small improvement in confidence of successful delivery of these projects
A key part of the IPA’s function in monitoring major projects is assessing the confidence in successful delivery, assigning them red, amber or green ratings, with red projects considered undeliverable and prioritised for extra support. The system of classification was simplified in 2022,***** 291 Infrastructure and Projects Authority, Annual Report on Major Projects 2021–22, 20 July 2022, https://assets. publishing.service.gov.uk/media/62d6bba4d3bf7f28630924f9/IPA_AR2022.pdf making comparison over time more difficult
– but while the proportion of projects rated ‘red’ has fallen from 12% in 2022 to 10% in 2023, 292 Baroness Neville-Rolfe, Letter to Chair of PACAC, 20 July 2023, https://committees.parliament.uk/ publications/41044/documents/199862/default the value of these projects has increased year on year. Confidence in delivery has declined over time, with the proportion of the portfolio rated ‘green’, and previously ’amber/green’, falling from 53% of total cost in 2013 to 15% in 2021.
Eleven per cent of the cost of the portfolio was rated highly likely to be delivered successfully by 2023, though the change in the methodology from 2022 makes it difficult to assess whether this marks a further deterioration.
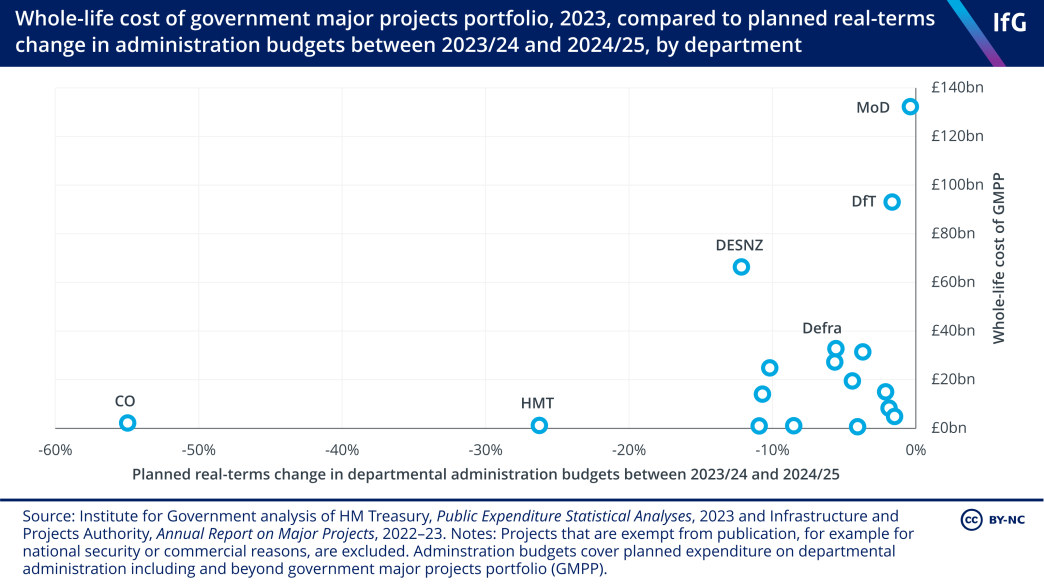
Given the increase in the number and total whole-life cost of the projects within the portfolio, the IPA is likely to be spreading limited resource more thinly across the portfolio. Part of its response to this is to focus on those projects that align most closely with government’s priorities, as set out in the latest (unpublished) outcome delivery plans for departments.
The IPA’s chief executive has also highlighted the continued work of the organisation to develop project management capabilities elsewhere in government. For example, 37% of senior responsible owners have completed the Major Projects Leadership Academy****** 293 Baroness Neville-Rolfe, Letter to Chair of PACAC, 20 July 2023, https://committees.parliament.uk/ publications/41044/documents/199862/default and a further 2,000 will have been accredited by the government project delivery profession by the end of 2024. 294 Infrastructure and Projects Authority, Annual Report on Major Projects 2022–23, 20 July 2023, https://assets. publishing.service.gov.uk/government/uploads/system/uploads/attachment_data/file/1175756/IPA-Annualreport- 2022-2023.pdf.pdf This progress could be threatened by reductions to administration spending, if they result in a contraction of project delivery capability within departments.
Spending on consultants and temporary labour
Whitehall is over-reliant on consultants
Departments and public bodies often employ consultancies to bring in specialist skill sets or to provide an external perspective on key programmes. The advice this provides can be used to identify options, recommendations and solutions for business transformation. Temporary staff, or ‘contingent labour’, are also often used to cover short-term needs, such as unexpected peaks in workload, absences or vacancies.
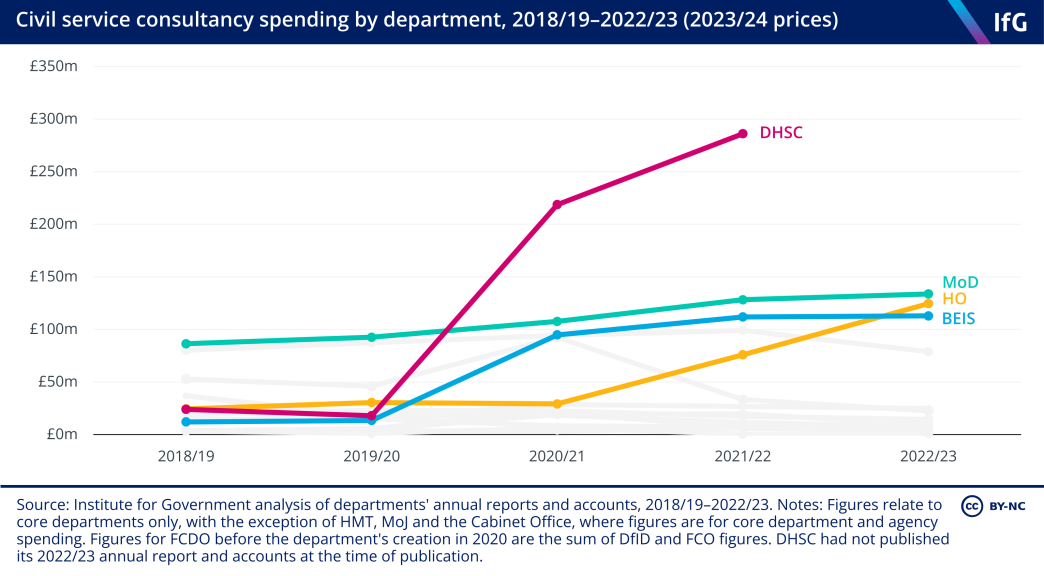
Limits on consultancy spend were introduced in 2011, with central authorisation required if contracts exceeded nine months in length or £20,000 in cost (rising to £600,000 in early 2023). 295 Elgot J, ‘Ministers quietly scrap limits on Whitehall spending on consultants’, The Guardian, 6 February 2023, www.theguardian.com/politics/2023/feb/06/ministers-quietly-scrap-limits-on-whitehall-spending-onconsultants Spending decreased initially, and it has been suggested that consultants may have begun offering lower rates. 296 Collington R and Mazzucato M, ‘Britain’s public sector is paying the rice for the government’s consultancy habit’, The Guardian, 20 September 2021, www.theguardian.com/commentisfree/2021/sep/20/britain-publicsector- consultancy-habit-pandemic-private-services More recently, a number of issues have precipitated an increase in consultancy spend. The government did, for example, spend significant sums to aid its EU exit preparations. 297 Comptroller and Auditor General, Use of consultants and temporary staff, Session 2015–16, HC 603, National Audit Office, 2016, www.nao.org.uk/wp-content/uploads/2016/01/Use-of-consultants-and-temporary-labour. pdf The pandemic was also a driver of increased spend – Test and Trace, for example, was reported to have signed a contract with Deloitte for around £1m per day. 298 ‘Test and Trace spends £1 million per day on Deloitte consultants’, 2 July 2021, Consultancy.uk, www.consultancy.uk/news/28374/test-and-trace-spends-1-million-per-day-on-deloitte-consultants Total spend on consultancy by core departments, as reported in departments’ annual reports and accounts, increased by an estimated 40% in real terms between 2018/19 and 2022/23.******* BEIS and the Home Office have seen the greatest proportional increases in this period.
The government has made efforts to improve the management of consultancy contracts. The Consultancy Playbook, which aims to help departments to make informed decisions on employing consultants and managing their contracts, 299 Cabinet Office, The Consultancy Playbook, Version 1.1, September 2022, https://assets.publishing.service.gov. uk/government/uploads/system/uploads/attachment_data/file/1103954/The_Consultancy_Playbook_ Version_1.1_September_2022.pdf was launched in 2021. However, the short-lived Crown Consultancy Hub, an intended in-house consultancy arm for Whitehall, deploying civil servants in a similar capacity to consultants, was scaled back to be a ‘centre of excellence’, before being scrapped in early 2023. The limits imposed in 2011 were then scrapped in February 2023, raising the limit for central authorisation to £20m. 300 Elgot J, ‘Ministers quietly scrap limits on Whitehall spending on consultants’, The Guardian, 6 February 2023, www.theguardian.com/politics/2023/feb/06/ministers-quietly-scrap-limits-on-whitehall-spending-onconsultants
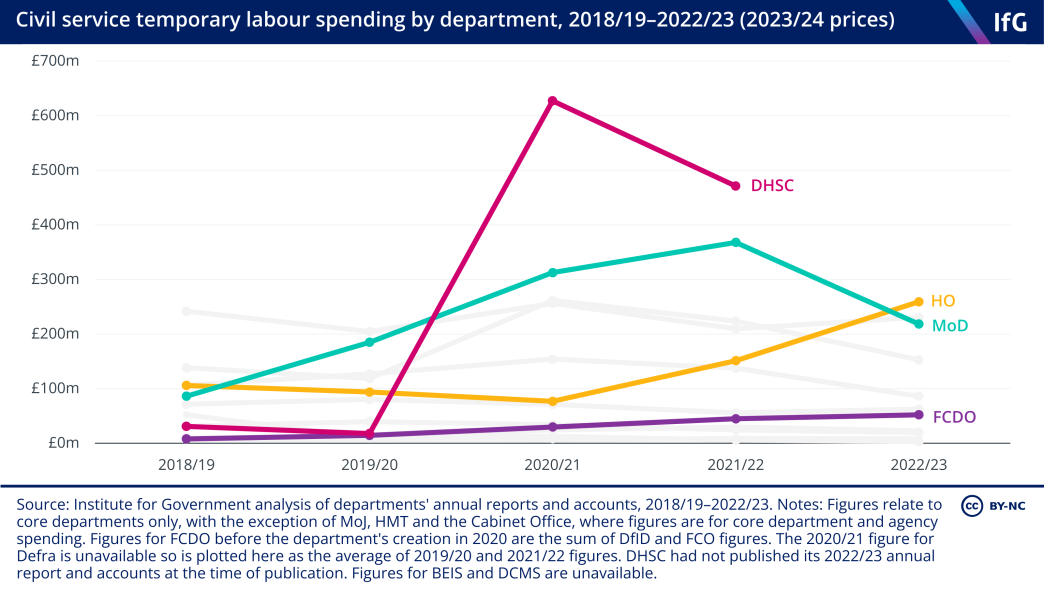
Our analysis also identified significant increases in spending across Whitehall on temporary labour. DHSC spent approximately 15 times as much on temporary labour in 2021/22 as in 2018/19, due to the immense pressure placed on the department during the pandemic, which created an urgent, short-term demand for labour.
In 2022/23 the Foreign Office spent more than six times as much on temporary labour as in 2018/19.******** The department lists the DfID–FCO merger, IT/digital activity, the pandemic and the war in Ukraine as the main causes of high temporary labour spend. 301 Foreign, Commonwealth and Development Office, Annual Report and Accounts 2021–22’, 2022, https://assets. publishing.service.gov.uk/media/62e3bd54e90e07143d51932f/FCDO_Annual_Report_2021_2022_ Accessible_290722.pdf MoD has seen the second largest proportional increase in temporary labour spend from 2018/19 to 2022/23, citing an increased demand for specialist and private-sector expertise due to changes in defence business practices.
The Home Office, showing an increase of 145% in real terms from 2018/19 to 2022/23, has cited various workstreams high on ministerial agendas as being responsible for this, including small boat crossings and post-Brexit border arrangements. Backlogs in the Passport Office caused by Covid have also driven increased temporary labour spend.
Consultancy and contingent labour spending can be justified – but should not be used to cover poor workforce planning
Such spending will sometimes be necessary. It is understandable, for example, that crises such as the pandemic, or complex issues like the UK’s exit from the EU, should trigger a significant increase in Whitehall calling in external support. Equally, an outside perspective can be useful for the delivery of corporate functions or strategy. But the civil service is reaching too readily for expensive external support. Officials should more carefully consider whether an outside perspective is valuable enough to justify the expense.
There should also be more careful consideration given to the development of in-house skills and expertise. The civil service has made progress in developing the skills of its workforce through its professions and functions over the past decade. But while Jeremy Quin, the former minister for the Cabinet Office, said that 70% of consultancy spend is on specialists and technical experts, 302 Jeremy Quin MP, X, 9 October 2023, https://twitter.com/JeremyMQuin/status/1711382840800411912 many of those specialist skills may be needed repeatedly by the civil service. We have previously argued, for example, that the civil service needs more project management and portfolio management capabilities, and should publish a workforce strategy that evaluates and sets out the skills it needs. 303 Guerin B, Thomas A, Clyne R and Vira S, Finding the right skills for the civil service, Institute for Government, 16 April 2021, www.instituteforgovernment.org.uk/publication/report/finding-right-skills-civil-service
The increased spend on contingent labour is particularly hard to justify. As with consultants, there will sometimes be a genuine need for such support. Unforeseen events may require surge capacity in some areas and the civil service should not employ a large reserve of under-employed staff in case of such events. Yet this is less understandable when contingent labour is used to address vacancies or peaks in workload that could or should have been foreseen. As noted above, arbitrary targets to reduce civil service headcount can make effective planning far harder, and lead to further boom and bust cycles in civil service staff numbers, resulting in the need for makeshift staffing habits.
In both cases, there is a risk of over-reliance on external support tipping into dependency. This in turn, as well as being an ongoing expense, prevents the accumulation of institutional memory and expertise in departments, particularly in times of crisis, ultimately leading to the civil service becoming less well-equipped to handle future crises.
The Labour Party has announced that, if elected, it will aim to cut consultancy spend in half and departments will need to demonstrate the value-for-money case for employing consultancies. Departments employing consultancies must already demonstrate value for money (although it is unclear how many requests are denied) and contingent labour employment already requires central approval if contracts are worth £1,000 per day or more.
304
Cabinet Office, HM Treasury, ‘Contingent Labour Spend Control’, guidance, GOV.UK, 26 January 2022, last
updated 1 February 2023, www.gov.uk/government/publications/contingent-labour-spend-control
The proposal shows a welcome focus on reducing Whitehall’s reliance on consultancy, though the 50% target should be kept under review, should it not prove the optimum balance of spend. Ultimately a thorough approach to workforce planning, and a more careful assessment of what skills the civil service should have in-house, are more likely to effectively drive down costs in the long term.
* Throughout this section, we use the GDP deflator to capture inflation. This is a measure of economy-wide inflation that is used to assess real-terms changes in departmental budgets. Over the past couple of years this has increased less than the Consumer Price Index, which measures prices facing households. This is because many of the goods that have increased fastest are imports, and so are not captured by the GDP deflator. Costs facing government have increased less than costs facing households, though: while energy makes up 10% of household budgets it accounts for only around 1% of public service budgets.
** Though some civil servants are not classified within administrative spending.
*** The path for overall administration DEL set out in official Treasury documents implies spending remaining flat in real terms in 2023/24, before falling in 2024/25. This seems like a more realistic path for spending than the figures for staff costs, given 2023/24 is three quarters completed.
**** The GMPP is a list of complex projects delivered by government departments. Projects are included in the portfolio after approval by the Treasury after consideration of the following characteristics: cost above the ‘designated authority limit’; risk of breaching the ‘departmental spending limit’; significant contractual obligations beyond the agreed spending plan; contentious or a risk to the public sector; requirement for primary legislation or statutory requirement for HMT approval.
***** In April 2021 the IPA moved from a five-category classification to three categories of ‘unfeasible’, ‘feasible’ and ‘highly likely’ represented by red, amber and green. The simplification was introduced to refocus the approach to make proactive interventions in the lowest rated projects. However, it has also reduced the capacity to differentiate between the projects subsequently grouped together as amber.
****** The senior responsible owner (SRO) is accountable for a project’s delivery of its outcomes and benefits. The SRO owns the project business case and is accountable for project governance. See: Infrastructure and Projects Authority, Government Functional Standard GovS 002: Project delivery, 15 July 2021, https://assets.publishing. service.gov.uk/government/uploads/system/uploads/attachment_data/file/1002673/1195-APS- CCS0521656700-001-Project-Delivery-standard_Web.pdf
******* This excludes DHSC because, at the time of writing, the department had not yet published its annual report and accounts for 2022/23. It also excludes the territorial offices and HMRC. For further information on our analysis of consultancy spend, see Methodology.
******** For the years prior to the merger of FCO and DfID in 2020, we aggregate spend on temporary labour from both departments.
Morale, pay and industrial relations
Civil service morale
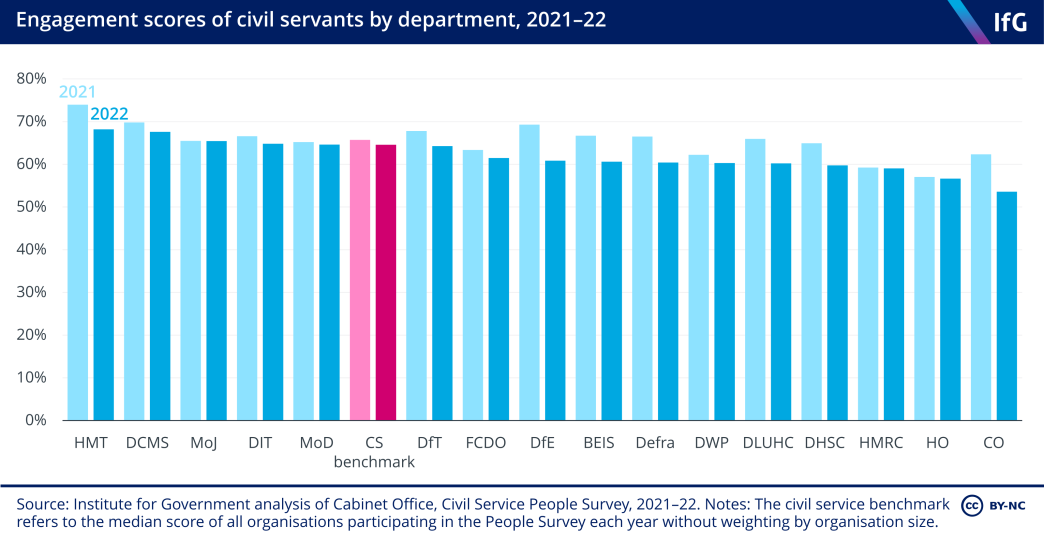
After rising every year since 2010, the civil service’s engagement scores – a headline indicator reflecting civil servants’ motivation, pride, advocacy and attachment to their organisation – fell in its 2021 staff survey, and fell again more sharply in 2022. Falls were experienced in every department, including a stark decrease of 9 percentage points in the Cabinet Office – a major shift in a measure that normally only shows small changes over time.
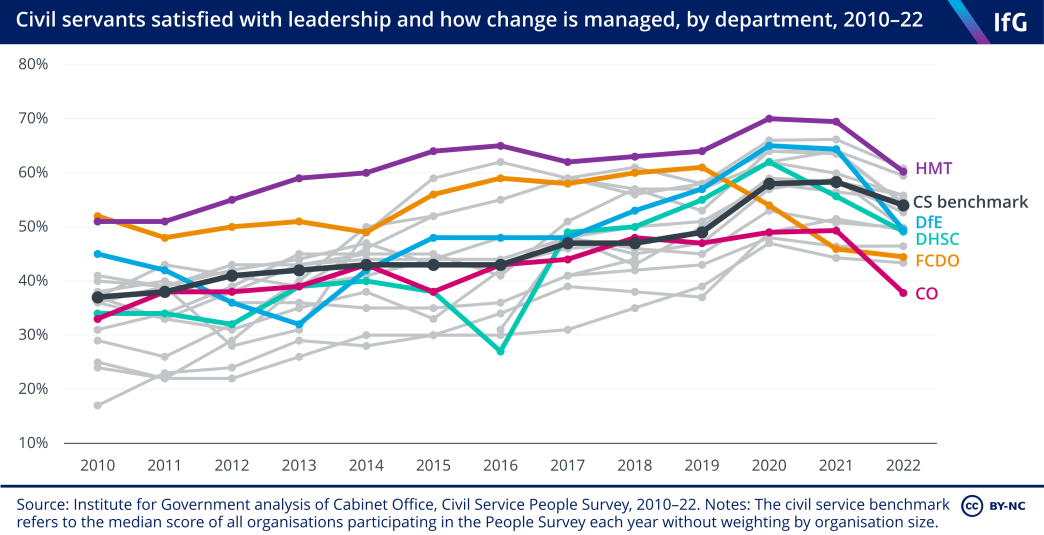
The political disruption of 2022, with high ministerial churn, is one possible reason for poor scores that year – as was the on-off ‘war on Whitehall’ that resulted in often strained ministerial–official relationships (discussed more in Part 2). In this context of instability, civil servants’ satisfaction with their leadership and how change is managed either fell or remained the same in every government department. There were six secretaries of state for education in 2022 – DfE’s score for managing change dropped by 15 percentage points between 2021 and 2022.
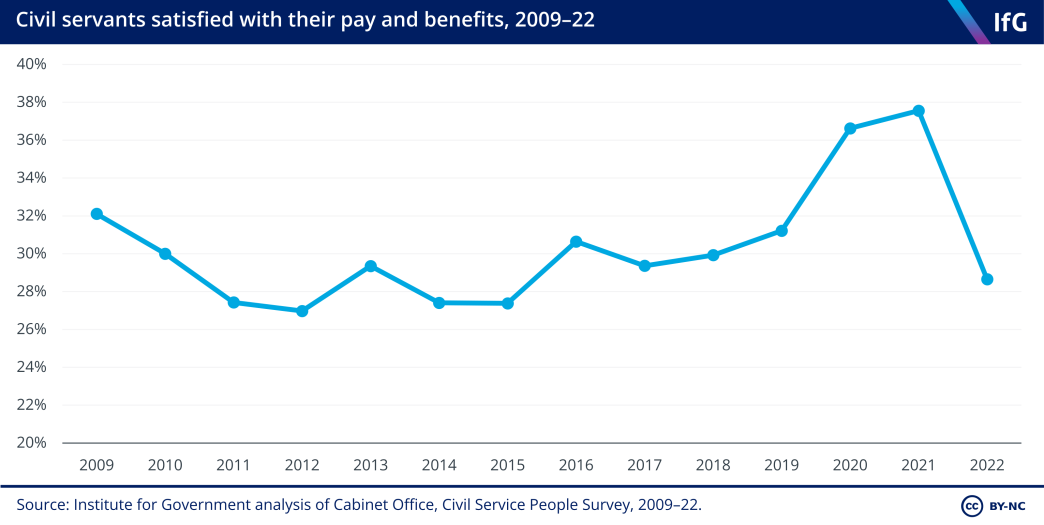
Civil servants in 2022* were particularly unhappy about pay – under a third of staff were satisfied with their pay and benefits package (29%), a fall of 9 percentage points from 2021. This year’s addendum to the government’s pay remit guidance, allowing departments to make a one-off payment of £1,500 to officials below SCS level, will likely go some way to improving morale in the short term. But the non-consolidated awards will not address the real-terms cuts to civil service salaries in the longer term.
The continuing problem of low pay
Pay settlements paused industrial action, but pay remains low
In 2022, civil servants were offered a pay increase of 2%, with departments having flexibility to pay up to 3% in certain circumstances. This guidance was published in March 2022 – but with inflation climbing to 11% by October, civil servants’ salaries rapidly decreased in real terms, leading to a series of strikes over the winter of 2022/23.
The industrial action was resolved with a pay settlement in June 2023. Non-senior civil servants received a lump sum of £1,500, and a headline pay increase of 4.5%, rising to 5% for the lowest earners. Senior civil servants received a 5.5% pay rise, in line with the recommendation of the Senior Salaries Review Body.
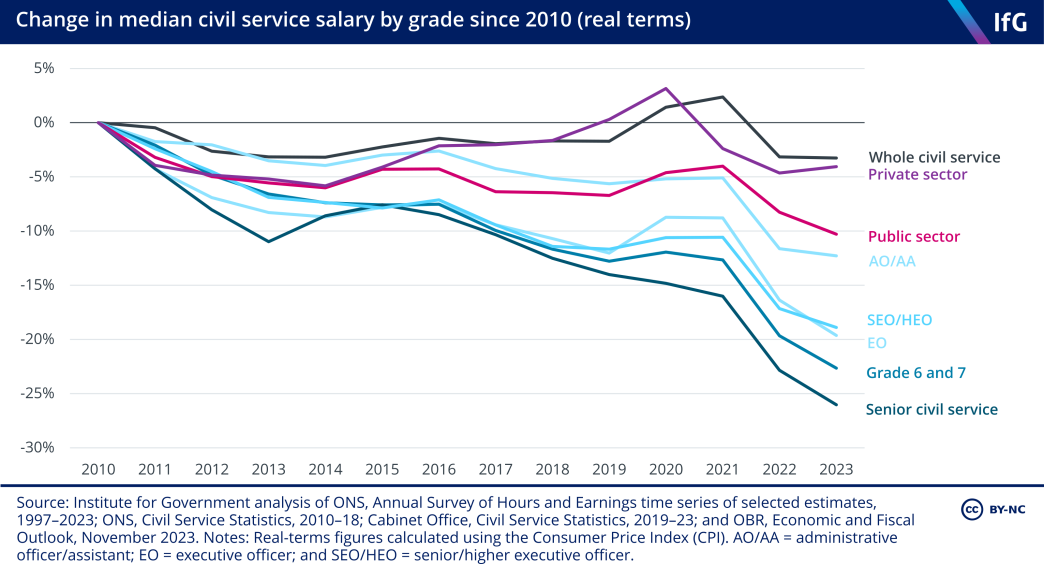
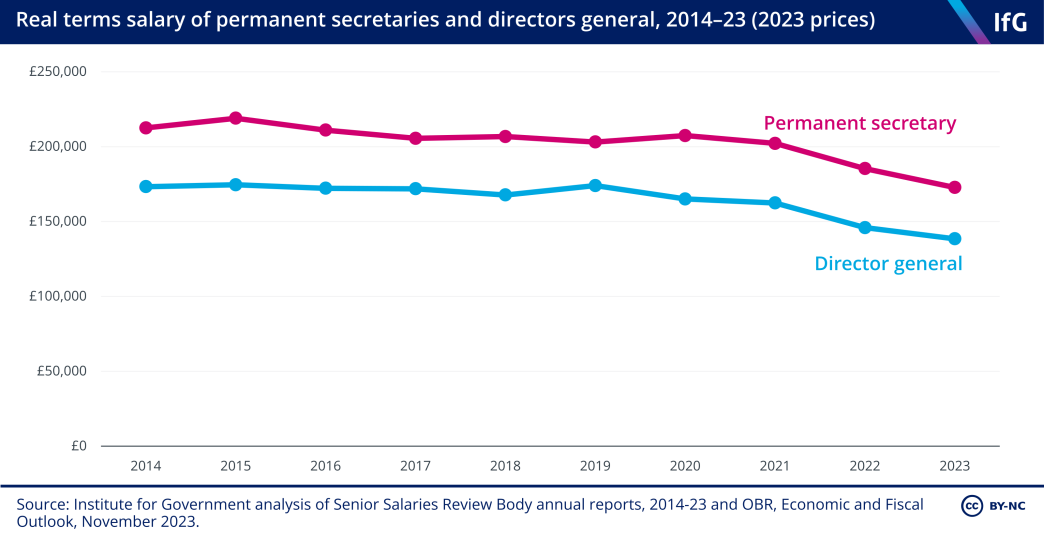
Overall, however, civil service pay remains relatively low. Pay fell in real terms in 2022/23, albeit not by as much as in 2021/22. Every civil service grade has seen a reduction in real-terms pay of 12–26% between 2010 and 2023. The gap is greatest for senior civil servants (SCS), whose median salary has fallen by more than 25% in real terms over the same period.
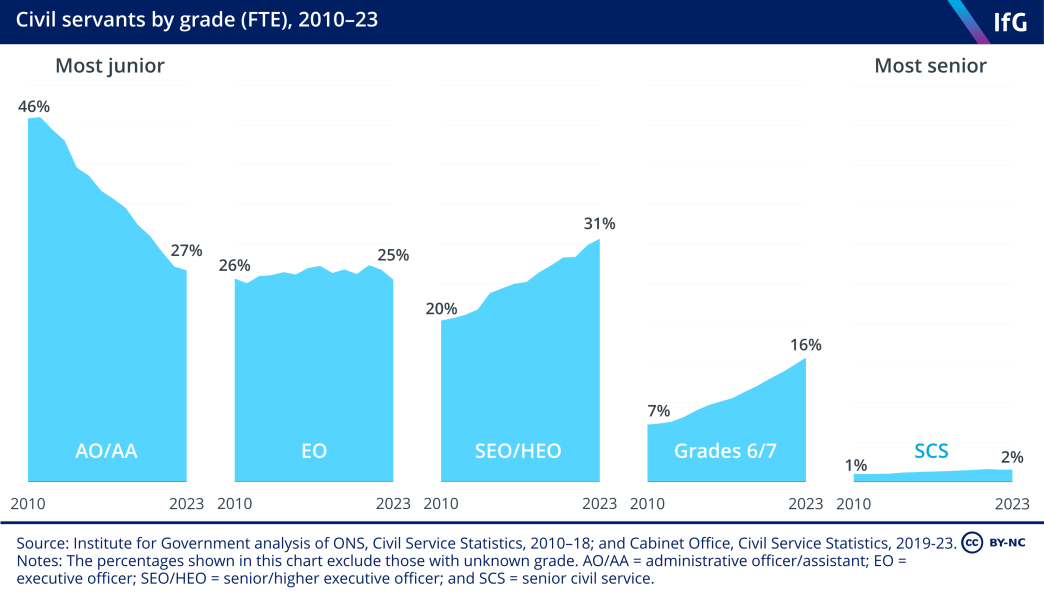
As in previous years, the median pay of the whole civil service fell far less than that of individual grades. This is because the composition of grades has shifted substantially over time, with the civil service becoming more top heavy. The number of AO/AAs (the most junior ranks), for example, has fallen by around 45% from 224,200 in 2010 to 123,560 in 2023, while the number of those at grades 6 and 7 (the levels just below SCS) has doubled from 35,290 to 72,610.
There are several factors that could be driving this pattern. One is that a changing civil service composition reflects a genuine need for a different skill mix. It could be, for example, that the need for the most junior staff may have reduced through increased automation and digitisation of services. That much of the fall in AO/AAs has been driven by reductions in DWP and HMRC supports this: the increased use of technology in the implementation of tax and benefit policy could have reduced the need for administrative employees. Indeed we were told that business transformation and automation was a factor behind DWP’s phasing out of the AA grade, and that the automation of clerical tasks has driven an approximate 15% reduction in the AO grade in operational areas of DWP over the past two years. Nevertheless, it is still difficult to distinguish between instances in which automation and improved processes have driven change in the grade composition, and where other forms of staff cuts are also a contributing factor.
Grade inflation poses problems for the management of the civil service
It is also likely that low pay in the civil service is itself an important factor in the civil service’s changing grade composition. The trends in different grades point to ‘grade inflation’ – where departments promote civil servants before they previously might have done, to increase their pay sufficiently to stop them leaving the civil service for the private sector, where pay options have significantly improved in relative terms over the past decade. While a combination of automation and job reductions may explain the fall in the most junior grades, grade inflation is also likely to explain, in part, the increases of staff at SEO/HEO, grades 6/7 and SCS level. This does not, however, detract from the real-terms pay cuts felt across the civil service.
Grade inflation caused by low pay comes with two main problems. The first is that, while civil servants may be doing the same or similar work to what they previously would have done but from a higher graded role, a gradual shift in expectations around what civil servants at each grade can and should do makes recruitment more difficult, with people not always sure what they are signing up to. That this shift may happen faster in some departments than others also undermines consistency of expectations between departments and the civil service’s coherence as an institution.
The second problem is that, for those such as directors general and permanent secretaries with no grade to inflate to, real-terms pay has got far worse and the positions less attractive. It also means that difficulties competing with the private sector will be concentrated in the most senior ranks of the civil service, precisely where the most capable people should be employed.
Holding down pay may not have even saved the government a significant amount of money. For example, if the civil service had the same grade composition in 2023 as it did in 2010, the total pay bill would be approximately £1.6bn lower than it is (£15.4bn, rather than £17.0bn). Put another way, grade inflation may have contributed to increased costs to the government, undermining any savings from holding down pay.
Contrast this with an illustrative scenario in which grade inflation had not happened (and the civil service in 2023 again had the same grade composition as in 2010) because pay for each civil service grade had risen in line with the private sector since 2010.** In this scenario, we estimate that the total pay bill would be £17.6bn, not too dissimilar to the cost the government currently faces. In other words, had pay risen more in line with the private sector in recent years, the government would likely be facing a similar cost to resource the civil service that it currently does, but without the morale, recruitment and retention problems that come with low pay.***
Low pay undermines recruitment and retention of civil servants
Low pay makes joining the civil service less attractive. As one interviewee we spoke to while writing our report Opening up put it: “Pay shouldn’t be the reason you come and work in government – but it genuinely is a huge barrier to getting the right people in.” 309 Urban J and Thomas A, Opening up: how to strengthen the civil service through external recruitment, Institute for Government, 1 December 2022, www.instituteforgovernment.org.uk/publication/civil-service-externalrecruitment
Our research into the Darlington Economic Campus found that even civil service salaries in Darlington are uncompetitive, despite local private sector salaries being lower than in London. One interviewee gave an example of a financial controller of a local business who they had encouraged to explore the opportunities available at the Treasury. The interviewee said: “I assumed the gap between private sector and civil service salaries would be less of a problem in the North East, but that wasn’t the case. The individual in question would have taken a 50% pay cut to go to HMT, but their offer was even lower than that.” They didn’t pursue the opportunity.
It is not only private sector salaries against which government struggles to compete, but pay in other parts of the public sector that are not bound by civil service pay guidance. As Lord Macpherson, a former Treasury permanent secretary, highlighted as far back as 2014, the Treasury faces challenges competing with the Bank of England (BoE) and Financial Conduct Authority (FCA). 310 Letter from Lord Macpherson, then permanent secretary at the Treasury, to Andrew Tyrie MP, chair of the Treasury Select Committee, 11 September 2014, www.parliament.uk/globalassets/documents/commonscommittees/ treasury/Macpherson_letter.pdf
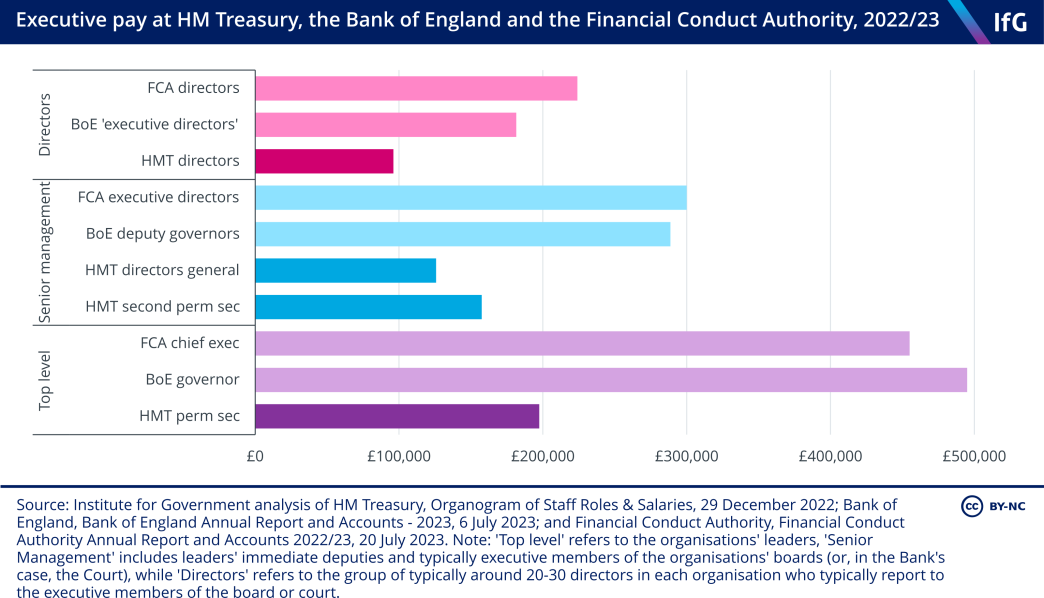
Low pay also makes it more likely that good people will leave. The 2022 people survey found that 55% of civil servants who intend to leave their role, either as soon as possible or in the next year, wish to do so “for a better pay and benefit package”. 311 Cabinet Office, ‘Civil Service People Survey: 2022 results’, GOV.UK, 30 March 2023, www.gov.uk/government/ publications/civil-service-people-survey-2022-results This was by some way the most common reason for wanting to leave, followed by the desire for career progression within the civil service (31%) and in response to poor leadership (30%). Similarly, satisfaction with pay and benefits was the only ‘theme’ of the 2022 survey that was significantly positively correlated to civil servants wanting to stay working for their organisation.**** And a 2023 survey of the FDA union for senior civil servants similarly found that as many as 87% of civil servants thinking about leaving the civil service entirely cited pay as the main factor. 312 FDA, ‘The state of pay in the civil service’, 23 November 2023, www.fda.org.uk/home/Newsandmedia/News/ The-state-of-pay-in-the-civil-service.aspx
Real-terms pay cuts are a problem across the civil service, but particularly so among the most junior and most senior ranks. For the former, median salaries (£22,510 for AA/AO in 2023) were especially squeezed by high inflation. Among senior civil servants, there are fewer opportunities for promotion and salary comparisons with equivalent private sector roles are stark. So it is at the top and bottom of the civil service that we can expect the impact of comparatively low pay to hit hardest in terms of recruitment and retention.
The relationship between low pay and overall morale in post is less clear
Pay is clearly a driving factor behind civil servants choosing to leave the civil service, and so must be instructive as to their satisfaction within the service. However, the relationship between civil servants’ satisfaction with their pay, their overall satisfaction with their role and other factors behind morale is less clear.
This is demonstrated by the correlation between the main themes of the Civil Service People Survey and the staff ‘engagement index’ – its headline estimate of morale. Satisfaction with pay and benefits is less strongly correlated with staff engagement than every other theme of the survey. In other words, civil servants’ satisfaction with their workload, manager, team, working culture, their organisation’s objectives and approach to leadership and change were all more strongly correlated with engagement levels than their satisfaction with pay.
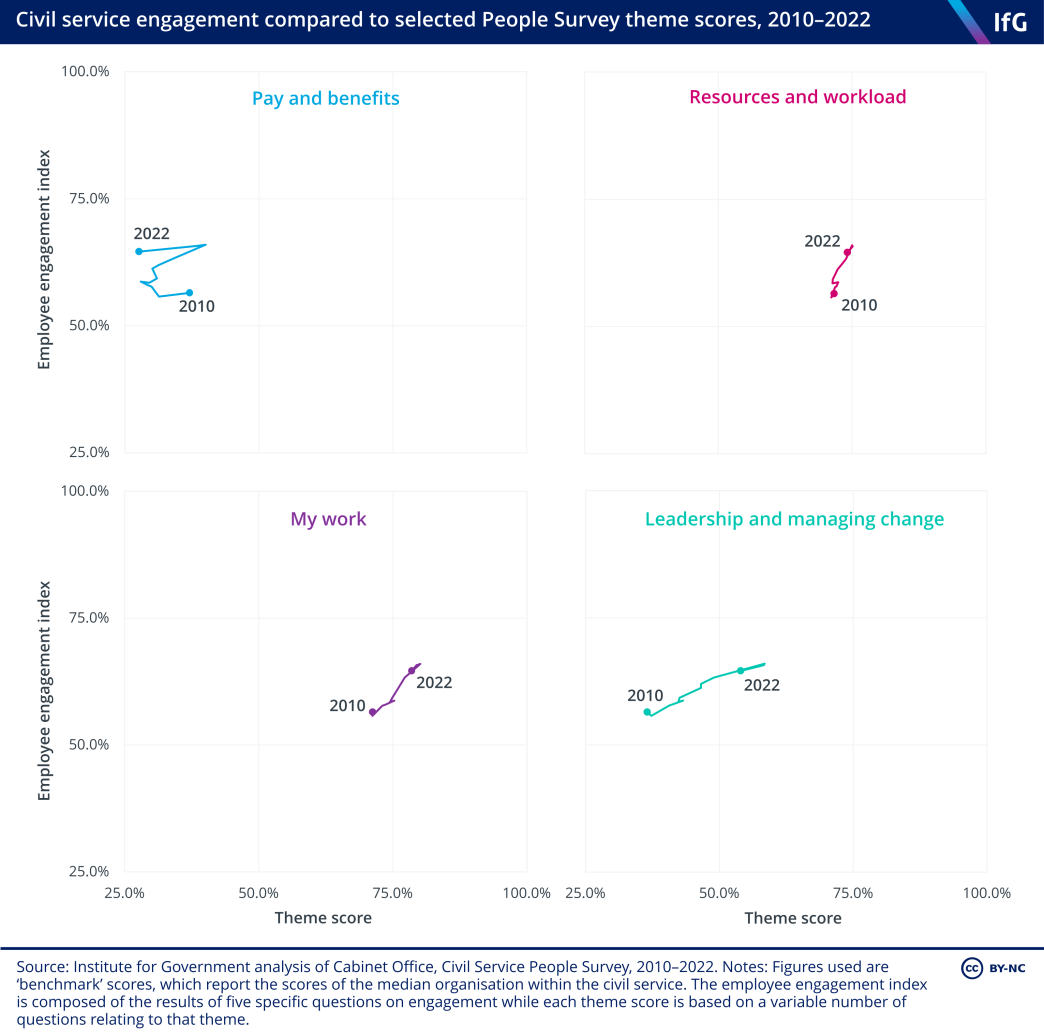
This does not mean that satisfaction with pay is not important. And part of the weak correlation between pay and engagement may be explained by the consistently low satisfaction with pay over time. But pay should be understood as one of a range of factors that affect how civil servants view their work and careers.
* We are using the 2022 data because it is the latest publicly available Civil Service People Survey results. There is often a significant delay between the completion of the annual survey and the publication of results. For example, this survey was conducted in Autumn 2022 but the headline results were not published until March 2023.
** In reality, even if grade inflation did not take place, we would expect to have seen some changes in grade composition for the reasons described above, such as technological change and the changing demands on services.
*** For further information on how we estimated these scenarios, see the Methodology.
**** For further information on the Institute’s analysis of the Civil Service People Survey, see Methodology. For more information on the people survey itself, see our explainer on the topic.
Diversity
The civil service has, correctly, long recognised the need to increase the diversity of its workforce. 324 Cabinet Office, A Brilliant Civil Service: Becoming the UK’s most inclusive employer’, GOV.UK, 16 October 2017, www.gov.uk/government/publications/a-brilliant-civil-service-becoming-the-uks-most-inclusive-employer Its latest efforts to do so are framed by the Civil Service Diversity and Inclusion Strategy 2022–2025. As we noted in 2022, 325 Bishop M, A crossroads for diversity and inclusion in the civil service: Assessing the 2022 D&I strategy, Institute for Government, 6 December 2022, www.instituteforgovernment.org.uk/publication/diversity-inclusion-civilservice this new strategy introduced a focus on socio-economic background. It also incorporated the geographic location and professional backgrounds of civil servants in a broader definition of diversity.
These are welcome conceptions of diversity of thought but, as we argued at the time, should not reduce the attention paid to diversity of protected characteristics such as ethnicity and disability.
Long-running improvements in representation continued last year
For at least the last two decades there has been an upward trend in the proportions of female civil servants, those from ethnic minorities and those with a disability – both in the civil service overall and in the senior civil service. These trends continued in 2023.
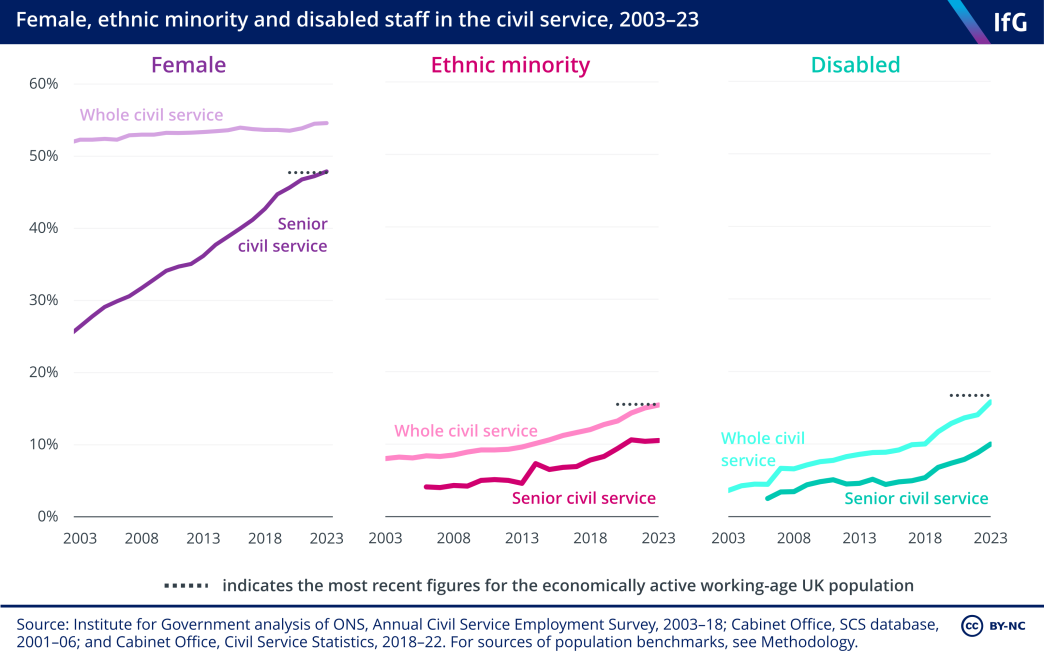
As of March 2023, over half of civil servants were female (55%). This includes 48% of senior civil servants, and compares to 48% of the economically active population. While female representation across the whole civil service has consistently been higher than in the economically active population, 2023 was the first time that the senior civil service reached the population benchmark. Female representation has also recently improved at the most senior ranks, though has still been better in the past. In 2011 there was, briefly, a gender-balanced team of departmental permanent secretaries. There was a low of three female permanent secretaries in 2016; this has risen to seven today.
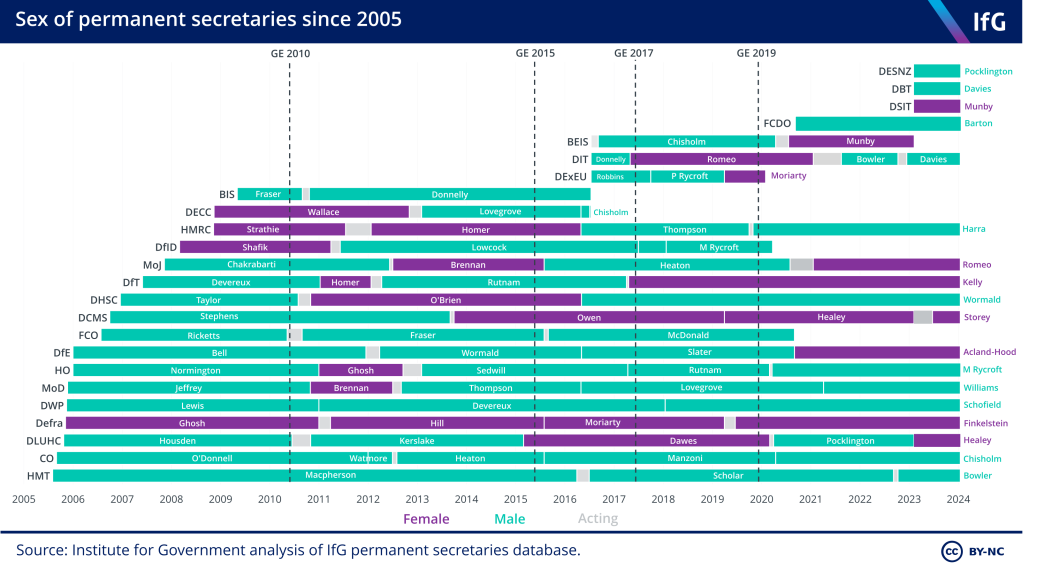
By contrast, minority ethnic representation across the civil service has still not reached that of the economically active population. It is close, though: 15.4% of civil servants come from a minority ethnic background, compared to the population benchmark of 15.5%. The senior civil service is, however, some way behind, at just 10.5%. This proportion fell in 2022 for the first time since 2015, and rose again in 2023, but remains just below the 2021 level.
The representation of disabled people across the civil service has continued to increase. Across the civil service, the proportion of staff with a disability is less than a percentage point below that of the economically active population, while the senior civil service is almost 7 percentage points behind.
There are also increasing proportions of civil servants at all levels of seniority identifying as gay, lesbian, bisexual, or recording their sexual orientation as ‘other’ (LGB+).* As a proportion of those providing information on their sexual orientation, in 2023 the number of staff identifying as LGB+ continued to increase at almost all levels of seniority in the civil service. Only the proportion for grades 6 and 7 (6.6%) was unchanged on 2022. At all grades, the proportion is significantly higher than the population benchmark figure of 4%.
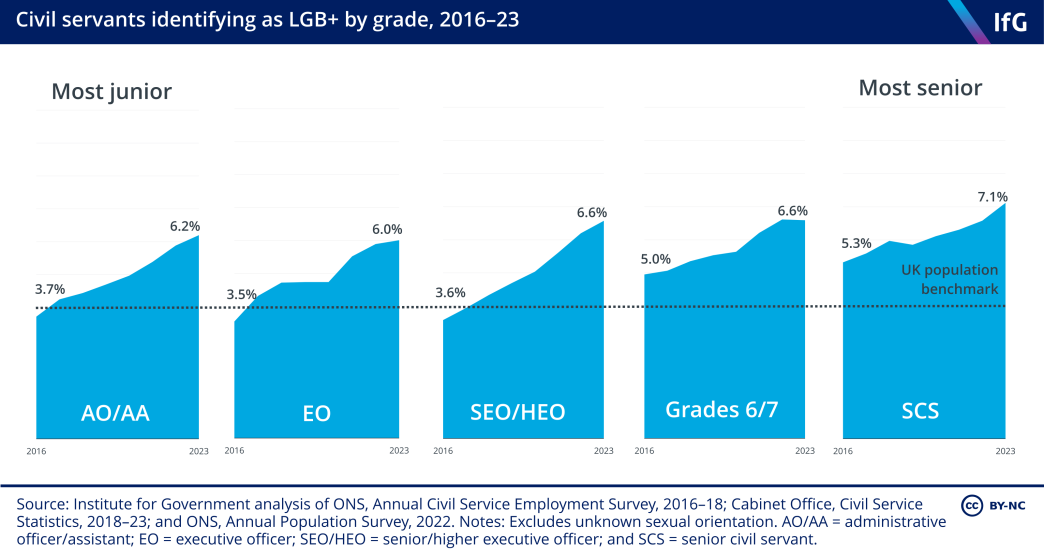
The civil service faces a big challenge in improving socio-economic diversity
One area where diversity has not improved is the socio-economic background (SEB) of civil servants. We have estimated that in 2022 the proportions of the civil service as a whole coming from low, intermediate and high socio-economic backgrounds** are 33.7%, 13.2% and 53.1% respectively. Compared to 2021, this is a lower proportion of low-SEB and a higher proportion of high-SEB civil servants – although the change for both cases is less than half a percentage point.
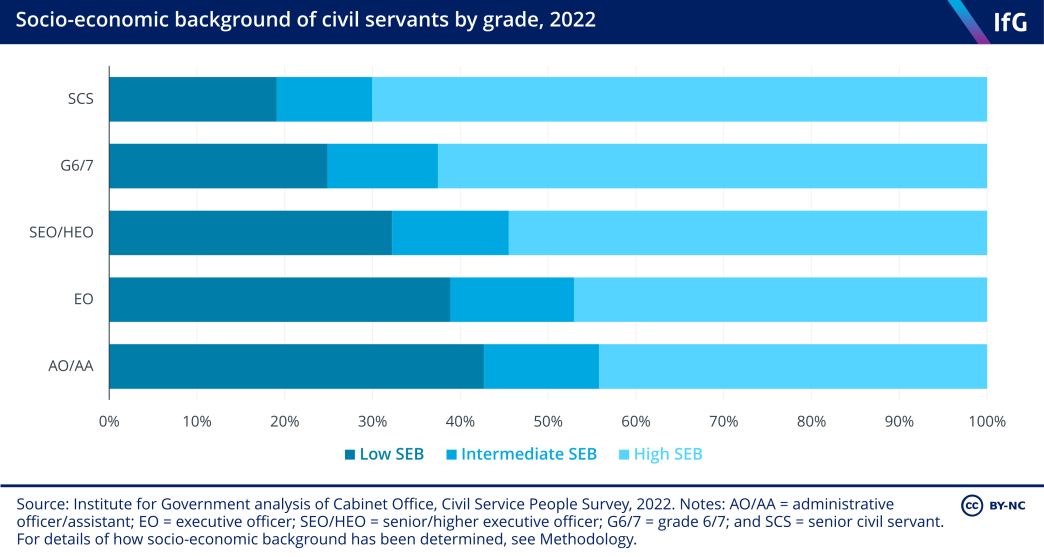
Discrepancies in SEB between grades also persist. Of the most junior grade (AO/AA), 44.2% can be estimated to be from a high SEB in 2022, compared to 70% of the senior civil service, while 42.7% of the most junior grade were from a low SEB, as opposed to 19.1% of the senior civil service. Compared to 2021, this is a higher proportion of the SCS coming from a high SEB and a lower proportion from a low SEB. The proportion of the most junior grades from a low SEB has decreased, and that from a high SEB has increased.
The senior civil service being unrepresentative of the population also extends to educational background. In research for an upcoming report on the senior civil service, we found that 53% of current permanent secretaries and directors general attended Oxford or Cambridge universities in some capacity, with 46% attending as undergraduates. Seventeen of the 22 permanent secretaries that we could find a full educational history for also attended Oxbridge in some capacity. 326 Institute for Government database on permanent secretaries and directors general
These discrepancies demonstrate the importance of the new D&I strategy. However, it will require better defined plans to be a success: as we noted in 2022, the strategy does not include many clear actions relating to SEB. There are, for example, no plans to target the recruitment of individuals from lower SEBs, or to address bottlenecks in operational career paths, where those from lower SEBs are over-represented – although its reference to delivering induction to new starters making clear some of the ‘unwritten rules’ around career development opportunities in the civil service was welcome.
One of the simplest things the civil service could do in this area would be to start publishing robust statistics. While it has developed new measures for SEB, it still does not include them in its annual workforce statistics – meaning that the figures above are drawn from the less robust annual survey of staff attitudes.***
There has been modest progress in improving the diversity of the Fast Stream
The Fast Stream is the civil service’s flagship graduate programme. As a future talent pipeline, it is particularly important that it recruits from a diverse range of backgrounds. The programme has become increasingly ethnically diverse, with the proportion of minority ethnic appointees having been on an increasing trend since 2019 (see first figure below).
The proportion of lower-SEB appointees, however – when assessed by whether they had been eligible for free school meals – is still lower than the population benchmark, even though it has increased in every year since 2019 and stood at 21% in 2022 (see second figure below). This is welcome progress, and shows that the Civil Service Fast Stream is increasingly accessible to those from more disadvantaged backgrounds.
However, more progress needs to be made before the Fast Stream is representative of the population as a whole. Around 70% of the 2022 cohort was from outside London, down from 73% in 2021 and unchanged from 70% in 2019.
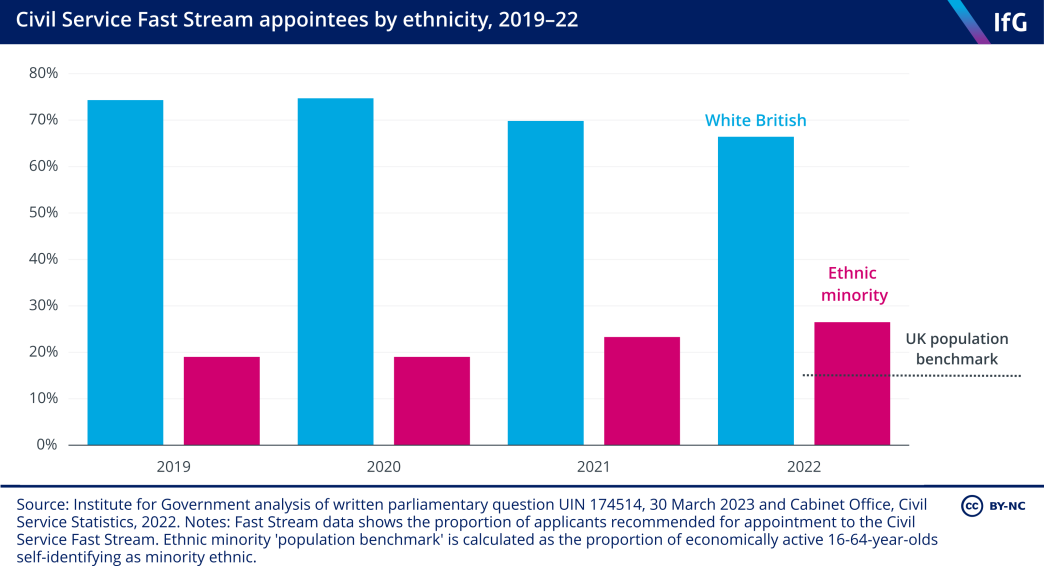
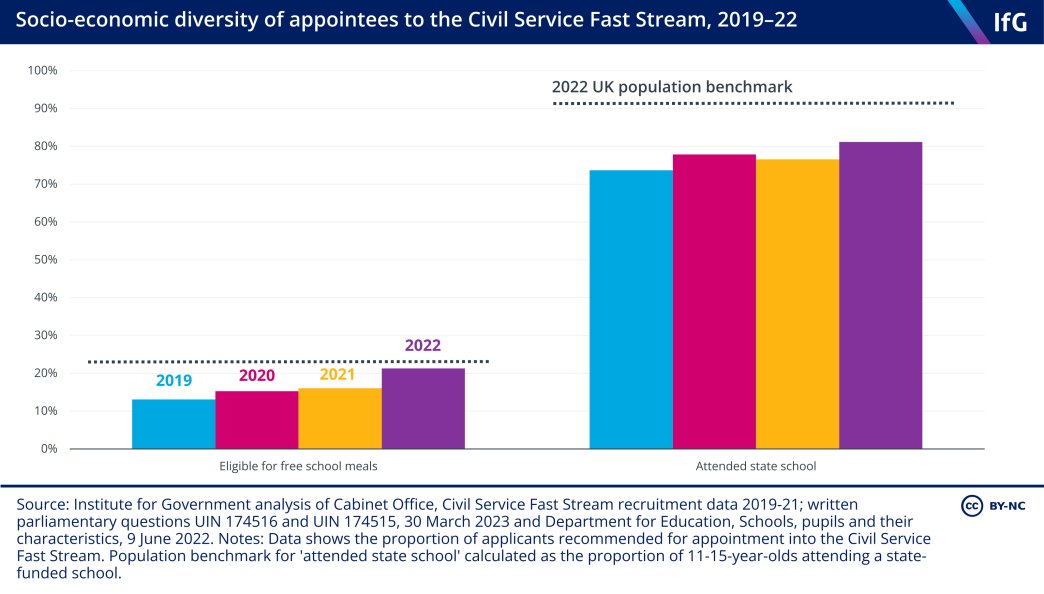
Better progress has been made in recruiting individuals with more diverse tertiary educational experiences. In 2022 the head of the civil service, Simon Case, announced that the government would aim for at least half of the Fast Stream intake to have STEM degrees as part of a wider effort to diversify thought in the civil service and increase civil servants’ ability to work with data and digital systems. This target was reached with the cohort of Fast Streamers starting in September 2023, and achieved through the creation of a generalist ‘STEM stream’, identical to the generalist stream but where only those with STEM backgrounds were eligible to apply.
There are signs the civil service may have stopped its trend of getting younger
Since the mid-2010s, the civil service has been trending towards a younger make-up, including at senior levels. Yet in 2023, the median age of the civil service remained at 44, having declined from 47 in 2015. The median age of the senior civil service has remained constant at 48 for five years.
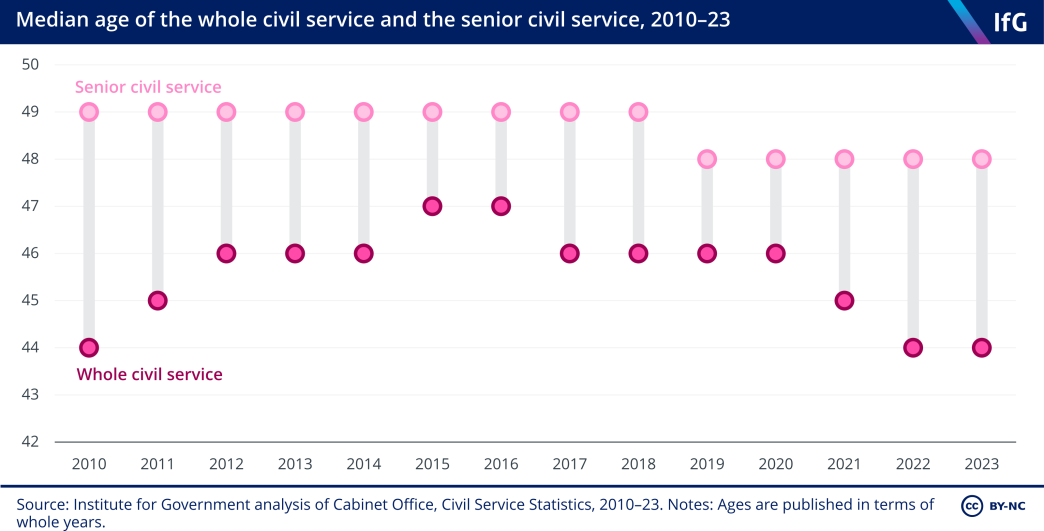
At grades 6 and 7, the trend of having more under-40s has continued. At EO level, the proportions of civil servants aged under 40 and under 30 have declined for the first year since an upward trend began in the earlier 2010s. At SEO/HEO level there has also been a very small decrease in the number of civil servants aged under 30. Overall, the civil service has been getting younger since 2010, but it may be possible that this trend is beginning to reverse.
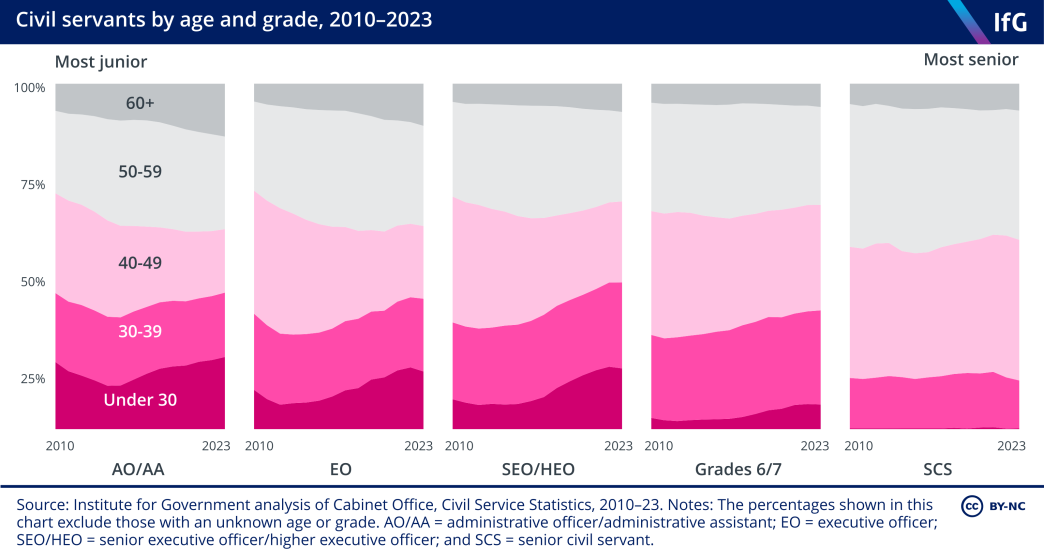
Improving diversity is too important to be derailed by culture war distractions
The civil service’s D&I initiatives, and politicians’ views of them, have at times caused controversy. In 2022, for example, Liz Truss said she planned to remove D&I professionals from the civil service, saying they “distract from delivering on the British people’s priorities”. 327 Stewart H and Allegretti A, ‘Liz Truss plan to cut £11bn in Whitehall waste ‘ludicrous’, The Guardian, 1 August 2022, https://www.theguardian.com/politics/2022/aug/01/liz-truss-plan-to-cut-11bn-in-whitehall-wasteludicrous Jacob Rees-Mogg, meanwhile, described D&I schemes as a “job creation scheme created by the woke for the woke” and said he did not believe that people in D&I roles are “doing anything useful”. 328 Markson T, ‘’We need focused learning, not woke folderol’: Rees-Mogg slams ‘nonsense’ civil service training’, Civil Service World, 2 August 2022, www.civilserviceworld.com/professions/article/jacob-rees-mogg-civilservice- training-woke-folderol-diversity-inclusion-check-yo-priviledge-witchcraft
In 2023 the chancellor, Jeremy Hunt, announced a review of spending on equality, diversity and inclusion initiatives – with departments asked to confirm how many officials work on such initiatives, and “how that work supports government priorities”. 329 HM Treasury, ‘End to Civil Service expansion and review of equality and diversity spending announced in productivity drive’, GOV.UK, 2 October 2023, www.gov.uk/government/news/end-to-civil-service-expansionand- review-of-equality-and-diversity-spending-announced-in-productivity-drive At the reshuffle in November, when Esther McVey was appointed minister without portfolio in the Cabinet Office, there was briefing that she would be fulfilling a role as a ‘common sense’ tsar, leading ‘the anti-woke agenda’ 330 Allegretti A and Wright O, ‘Esther McVey’s ‘anti-woke’ role to keep Tory right on side’, The Times, 14 November 2023, www.thetimes.co.uk/article/esther-mcveys-anti-woke-role-to-keep-tory-right-on-side-qjcv39k0x – with various pieces of reporting suggesting that this would include a focus on cutting D&I efforts in the civil service. 331 Burke D and Cowburn A, ‘No10 won’t say what new ‘common sense’ minister Esther McVey will actually do’, Daily Mirror, 14 November 2023, www.mirror.co.uk/news/politics/no10-wont-say-what-new-31435016; McKeon C, ‘‘Common sense minister’ McVey returns to represent Tory right at Cabinet table’, The Standard, 14 November 2023, www.standard.co.uk/news/politics/esther-mcvey-suella-braverman-cabinet-whitehallcivil- service-b1120192.html
In the autumn statement in November, the government reported on its audit of equality, diversity and inclusion spending – saying that it was “considering introducing a presumption against external EDI spending and increasing ministerial scrutiny of EDI spending whilst streamlining EDI training and HR processes with a view to getting value for the taxpayer”. 332 HM Treasury, Autumn Statement 2023’, GOV.UK, 22 November 2023, www.gov.uk/government/publications/ autumn-statement-2023
Spending public money efficiently, either directly or indirectly via the civil servants’ time, is vital. Ministers are right to assure themselves of this, to rigorously assess the effectiveness and impact of such efforts, and to raise questions where they see fit. But in doing so, it is also sensible to recognise that the core purposes of D&I efforts are to attract varied skill sets and diverse perspectives, while making civil servants feel welcome in their work environment. As the new civil service ‘People Plan’ describes, it is to “set the standard for inclusive workplaces where people achieve their full potential”. 333 Government People Group, Cabinet Office, Civil Service People Plan 2024–2027’, GOV.UK, 10 January 2024, www.gov.uk/government/publications/civil-service-people-plan-2024-2027 This is critical for better serving the public, but also because the civil service, like any employer, has an interest in and obligations to its staff.
A relentless focus on what is and is not ‘woke’ – accompanied by media highlighting of eye-catching events or initiatives in Whitehall, including those focused on wellbeing 334 Guido Fawkes, ‘Civil servants holding Q&A with a witch’, 10 November 2021, https://order-order. com/2021/11/10/exclusive-civil-servants-to-spend-work-hours-holding-qa-with-a-witch; Guido Fawkes, ‘Cabinet Office offers crystal healing session for civil servants’, 26 November 2021, https://order-order. com/2021/11/26/cabinet-office-hosts-crystal-healing-session-for-civil-servants; Cole H, ‘Beyond a woke: Fury as civil servants attend £500 ‘Queer Leadership’ training on taxpayer cash’, The Sun, 25 August 2022, www.thesun.co.uk/news/19620313/woke-civil-servants-queer-leadership-conference – skews public debate and distracts from the core aims of D&I that ministers say that they support.
Often this is an issue with unofficial communications such as off-the-cuff comments by (then) ministers. Official government language is more measured. The announcements in the autumn statement (referenced above), for example, avoid inflammatory language. But the wider political environment does matter. As we discuss in Part 2,
it is easy to see how these issues – and the civil service more broadly – could become
political footballs this year. Ministers should try to ensure that they do not.
* This LGB+ categorisation is used because it reflects the data as reported by the Cabinet Office in the 2023 edition of its Civil Service Statistics. This dataset does not include civil servants identifying as transgender.
** These figures are estimates because the civil service does not include measures of SEB in its annual workforce statistics – only in its survey of staff attitudes. We have reached these figures by looking at the number of responses to the staff survey that answered a question on SEB in different ways. It should be noted that only 222,000 civil servants responded to the relevant question in 2021, and 237,000 in 2022. For full details, see Methodology.
*** For more on how we use survey data see Methodology.
Transparency
Some departments have struggled to meet their key transparency obligations
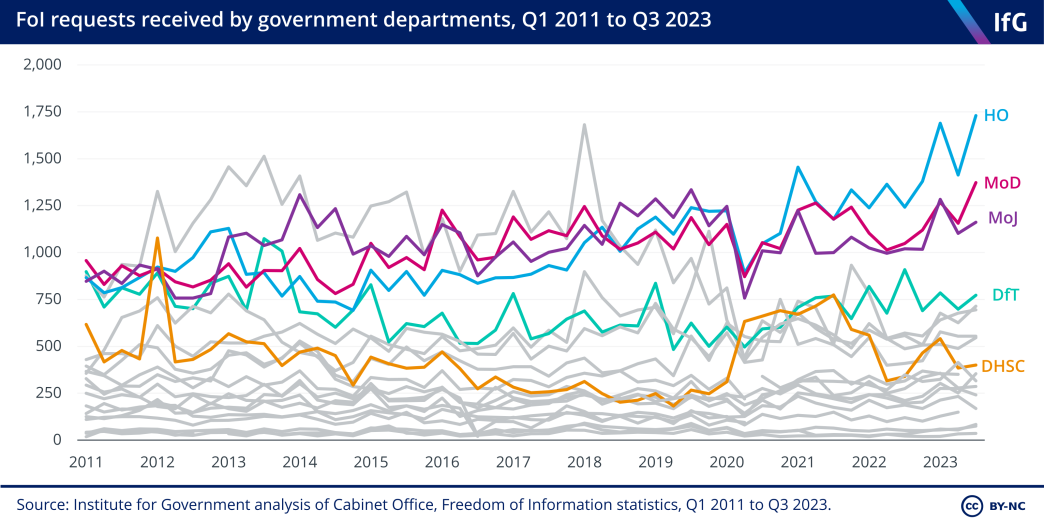
Departments continued to receive a high volume of Freedom of Information (FoI) requests in the last year. There has been a significant increase in the volume of FoI requests to the Home Office, probably reflecting the centrality of the department to Rishi Sunak’s small boats and asylum backlog commitments. In Q3 2023, the Home Office received 1,730 FoI requests – the second highest* number ever received by a central government department in a single quarter.
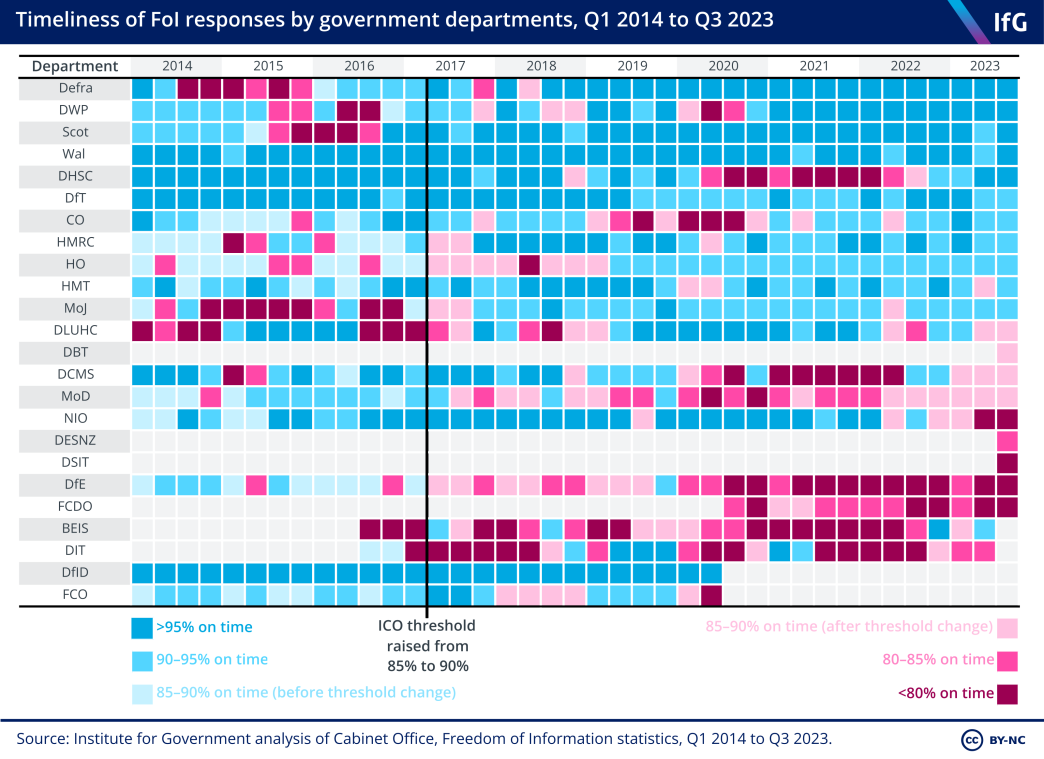
Government departments are legally required to respond (or claim extensions) to FoI requests within 20 working days for their response to be considered ‘on time’. If a department does not meet this target for at least 90% of its FoI requests, the Information Commissioner’s Office (ICO) may place it under special monitoring. In Q3 2023, 11 of 20 (55%) government departments met the ICO’s target, down from 11 of 19 (58%) in the same quarter in 2022.
The three departments created in February’s machinery of government changes failed to meet the ICO target in Q3 2023 – just under 90% of DBT’s responses were on time, while DSIT (77%) and DESNZ (81%) were further from the target. Ensuring timely responses to FoI requests may be a challenging task for the new departments, given the track record of their predecessors and the disruption caused by the departmental restructures. In September 2022, BEIS was issued recommendations by the ICO to improve the department’s procedures, while DIT received an enforcement notice** in the same month.
In June 2023, the ICO issued an enforcement notice to MoD, requiring the department to respond to hundreds of requests that had passed the 20 working day deadline. 348 Information Commissioner’s Office, ‘‘We are continuing to deliver for the public’ – ICO publishes practice recommendations and enforcement notices on FOI’, 10 August 2023, https://ico.org.uk/about-the-ico/ media-centre/news-and-blogs/2023/08/we-are-continuing-to-deliver-for-the-public-ico-publishes-practicerecommendations- and-enforcement-notices-on-foi MoD’s FoI performance worsened due to the pandemic (as happened in many departments), though the last time it met the ICO threshold in two consecutive quarters was in 2017.
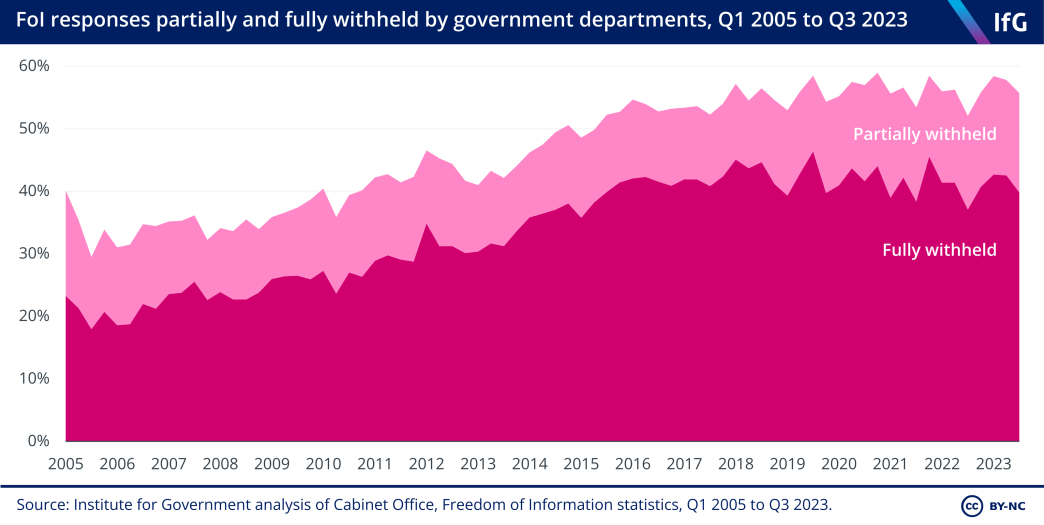
In the first six months of 2023, 15 government departments fully or partially withheld information in response to more than half of their FoI requests – only DfT, DfE, the Wales Office and the Northern Ireland Office granted information in full in a majority of cases. Across government, 58% of FoI responses were withheld in part or full.
The MoJ faced particular scrutiny for its transparency processes in August 2023, after it was revealed that officials had prepared “background notes” about an FoI requester – The Times reporter George Greenwood – for a special adviser (SpAd) to consider. 349 Ellery B, ‘Ministry of Justice tracks journalists who make information requests’, The Times, 26 August 2023, www.thetimes.co.uk/article/ministry-of-justice-tracks-journalists-who-make-information-requests- 9pmkpmsr5 In October 2023, the Cabinet Office published its guidance clarifying that SpAds should not be involved in making decisions about disclosing information in response to FoI requests, but acknowledged that they may give “assistance and advice” about aspects such as the presentation of information. 350 Cabinet Office, ‘FOI Cross Government Guidance on FOI and the Role of Special Advisers’, GOV.UK, 19 October 2023, www.gov.uk/government/publications/cabinet-office-and-freedom-of-information/foi-crossgovernment- guidance-on-foi-and-the-role-of-special-advisers-html The last quarter in which the MoJ granted information in full in more than 50% of its FoI responses was Q1 2009.
New transparency commitments are welcome – but more will need to be done to actually deliver them
As part of its ethics and integrity measures announced in July, 351 Barr B and Durrant T, The government’s response to the Committee on Standards in Public Life, Institute for Government, 21 July 2023, www.instituteforgovernment.org.uk/explainer/government-response-standardspublic- life the government accepted a number of recommendations around departments’ quarterly releases of information about lobbying and conflicts of interest. 352 Cabinet Office, Strengthening Ethics and Integrity in Central Government, CP 900, The Stationery Office, July 2023, www.gov.uk/government/publications/strengthening-ethics-and-integrity-in-central-government In December, the Cabinet Office published its update to guidance about how these returns should be published, 353 Cabinet Office, ‘Guidance: Ministers’ gifts (given and received), travel, hospitality received and meetings with external organisations and individuals’, 7 December 2023, https://assets.publishing.service.gov.uk/ media/657b0769095987000d95e122/2023_12_07_Ministers__Transparency_Guidance.pdf including clear guidance for meeting descriptions – the Institute has previously criticised the inconsistent quality of departmental releases, such as the Treasury minister responsible for financial services attending 39 meetings described only as being about “financial services”. 354 Durrant T, Mills-Sheehy J, Pannell J and Olajugba S, Government transparency: Departmental releases: ministers and officials, Institute for Government, 30 September 2021, www.instituteforgovernment.org.uk/publication/ report/government-transparency
The Cabinet Office is also reportedly developing “a single platform to collate and publish” these transparency returns – replacing the existing system under which individual departments publish separately. The SCS will also be required to report the same information as ministers, and government will publish a central register of senior officials’ second jobs. 355 Trendall S, ‘Cabinet Office to create register of senior civil servants’ second jobs’, Civil Service World, 9 May 2023, www.civilserviceworld.com/professions/article/senior-civil-servants-second-jobs-cabinet-officecreate- online-register These reforms are welcome, but the government has not yet been clear about when many of them will take effect. The government should implement its pledges in a timely manner to continue making progress on improving transparency and ethics in government.
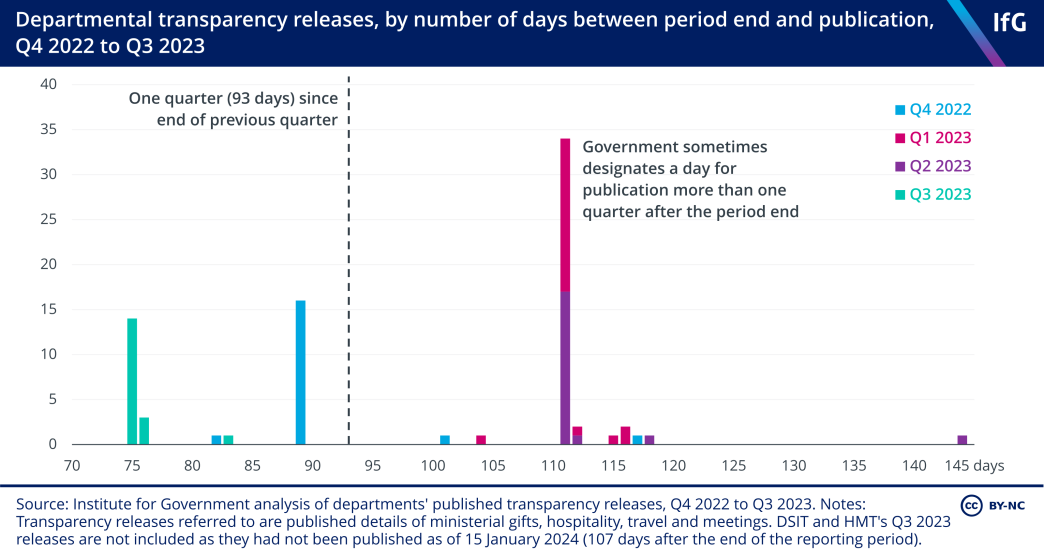
The Cabinet Office’s December guidance clarified that this transparency information – on their ministers’ meetings, travel and hospitality received, as well as similar information for some senior civil servants and special advisers – is now supposed to be published by departments within three months of the end of each reporting period (previously this was defined as “on a quarterly basis”). However, these releases do not always appear at regular quarterly intervals, as they are managed as part of the government communications ‘grid’ and therefore sometimes are delayed to fit around other announcements. Of the 81 transparency returns published by core government departments in 2023, only 35 (43%) were published within one quarter (we have defined this as 93 days) of the quarter to which they refer. A further 34 (42%) were published at the same time as the Cabinet Office (where the Cabinet Office did not publish within 93 days), or earlier – that is, on or before the day designated by the government for transparency releases to be published as part of its communications ‘grid’. The majority (90%) of the most recent returns, relating to Q3 2023, were published well within one quarter, though this is partly due to the timing of December’s parliamentary recess.
In response to the Committee on Standards in Public Life’s recommendation that departments’ transparency releases should be published more frequently, the government said only that it would “look to” move to a monthly reporting cycle once the central database is developed. It is welcome that departmental transparency performances have generally improved in recent years – the Institute found in 2021 that some releases were being published after more than two quarters. 356 Durrant T, Pannell J, Mills-Sheehy J and Olajugba S, Government transparency: Departmental releases: ministers and officials, Institute for Government, September 2021, www.instituteforgovernment.org.uk/publication/ report/government-transparency But officials will need to step up their efforts in light of the government’s commitments: DSIT’s late publication of its April–June 2023 release, 33 days after most other government departments, would be a substantial problem under a more frequent reporting system.
The repeated failure to publish departments’ outcome delivery plans hampers scrutiny of government strategy
The importance of transparency in government goes beyond requests from the public for information, or releasing information to avoid potential conflicts of interest. It has far wider benefits to the effective operation of government.
Outcome delivery plans (ODPs), for example, are intended as the principal strategic document agreed by each Whitehall department with No.10, the Cabinet Office and Treasury. 357 Clyne R and Davies N, Outcome Delivery Plans: The case for keeping and improving the government’s performance framework, Institute for Government, 5 September 2022, www.instituteforgovernment.org.uk/publication/ report/outcome-delivery-plans They are part of the government’s performance framework, through which departments’ progress towards their stated priorities – and how they are using their resources to do so – can be tracked. These are important planning documents that would benefit from outside input and scrutiny. 358 Institute for Government evidence to the Liaison Sub-Committee on Scrutiny of Strategic Thinking in Government, House of Commons, 19 October 2023, https://committees.parliament.uk/committee/677/ liaison-subcommittee-on-scrutiny-of-strategic-thinking-in-government/publications
But for the past two years, the centre of government has blocked the publication of departments’ plans. 359 Markson T, ‘’Wholly unconvincing’: PACAC chair slams ministers’ decision to block release of outcome delivery plans’, Civil Service World, 26 July 2023, www.civilserviceworld.com/news/article/wholly-unconvincing-pacacchair- slams-government-decision-to-block-release-of-departments-outcome-delivery-plans The last publicly available versions of these plans were published in July 2021 (two prime ministers ago). 360 Cabinet Office, ‘Outcome Delivery Plans’, GOV.UK, 15 July 2021, www.gov.uk/government/collections/ outcome-delivery-plans And these were heavily redacted compared to the internal, unpublished versions used by departments.
Redaction is right in the small number of cases where publication of these plans would endanger national security or market sensitivity. But these defences are not generally applicable to departments’ ODPs. Transparency would help to make these plans more robust. The government should rectify this next year by publishing ODPs in full wherever possible, as well as publishing regular updates on departments’ progress against their plans.
* The highest ever number was 1,843 to the MoD in Q1 2005, the first quarter the FoI Act came into force
** The Information Commissioner’s Office issues enforcement notices in cases where there are “repeated and/or significant or systemic issues” with a public body’s obligations under the Freedom of Information Act.