Working to make government more effective

Report chapter

Performance Tracker 2026: Schools

The government must better measure success across its school priorities and set out a clear long-term vision for the structure of the school system.

A classroom

By the time Andy Burnham entered government earlier this year, an ambitious education agenda was already well under way. Over its two years in office, the Starmer government had queued up a crowded set of priorities: schools asked to raise attainment, improve attendance, tackle teacher shortages, transition to a new model of governance, and help to rebuild a broken special educational needs and disabilities (SEND) system – alongside much more.

Some of those objectives are well within reach. Attendance is moving in the right direction, and the Department for Education has a route to further improvement, particularly through better data and improved communication with parents. The headline target on teacher workforce is also highly achievable.

Others however are far harder. Halving the ‘disadvantage gap’* by 2040 would require a near-immediate reversal of recent trends, and the government has said little about how it plans to make this happen. Its wider schools funding package – potentially the funding package for the whole parliament – also appears to hang on the government quickly stemming the growth in education, health and care plans (EHCPs), yet its SEND reforms deliberately take a slower, phased approach. If the growth in EHCPs does not slow, or indeed increases, the result could be the SEND system swallowing up much of the planned funding increase, frustrating the wider schools agenda.

A recurring weakness across the schools agenda is the government’s approach to measuring success. Progress on its teacher workforce target says little about whether there are enough teachers to meet demand, or whether it is achieving its wider goals in the area. In SEND, some of its central objectives – notably on prevention and inclusion – are not yet defined clearly enough to measure at all. It has also yet to acknowledge the tension between inclusion and its ambitious attainment and attendance targets, or properly assess whether its performance framework strikes the right balance between them.

As for the structure of the schools system, the government has not yet set out what it wants the end state to look like. Instead, successive administrations have let the system drift into a state of incoherence that could threaten the Burnham government’s wider agenda on public service reform.

The three years before the next election will therefore be less a test of the government’s ambition than of its ability to prioritise. It will need to decide what success looks like, confront the trade-offs between its objectives and ensure that the SEND crisis does not crowd out other priorities.

This report, part of our Public Services Performance Tracker 2026 series, discusses the government’s goals on attainment and absence, the teacher workforce, SEND reform, the funding schools have at hand to meet those goals, and the structure of the school system. It draws on analysis of publicly available data and 20 semi-structured interviews with policy experts and staff working in government, schools and trusts, representative bodies and the third sector.

* Here meaning the difference in attainment between disadvantaged pupils and their peers at the end of secondary school.

Key findings and recommendations in brief
  • On most metrics the SEND system is moving in the wrong direction. Fewer than half of pupils with SEND say they enjoy coming to school. The average secondary pupil with an EHCP now misses nearly a day of school every week.
  • Current growth would see nearly one in ten pupils having an EHCP by 2030 and SEND pressures could absorb around two thirds of the generous schools funding uplift over this parliament. DfE should review its timetable for reducing reliance on EHCPs and ensure the reforms are properly resourced.
  • The ‘disadvantage gap’ is growing, not closing. Meeting the 2040 target requires the gap to narrow by 0.5 points every year for 15 years – despite it only widening in recent history. DfE should publish a detailed plan for getting back on track.
  • Absence is on course to fall at the fastest sustained rate since the mid-2010s, but this would only partly unwind the pandemic’s disruption. DfE should back its approach to severe absence with clear expectations and aligned funding and incentives across services.
  • Teacher numbers are rising – at the current rate, the government could add around 20,000 teachers in target phases by the end of the parliament – three times its 6,500 goal. But DfE should develop better ways to measure success in tackling teacher shortages.
  • There is no coherent model of school governance in England. Some groupings of schools are run by trusts, others overseen by local authorities; some span the whole country, others a single neighbourhood. Burnham’s government should set out a clear long-term vision for the structure of the school system and use it to guide decisions about the trust sector and other public services.

Attainment and absence

The government has set ambitious attainment targets, with the greatest challenge at GCSE

In the 2010s, attainment increased and disparities narrowed across England’s schools.* But the effects of the pandemic – with schools closed for long periods, valuable learning time lost and exams and other functions severely disrupted – undid much of this progress.

In its schools white paper published in February 2026, the government announced it was renewing its focus on attainment, setting ambitious national targets spanning primary and secondary education. 276 Department for Education, ‘Every child achieving and thriving’, gov.uk, 27 April 2026, retrieved 10 September 2026, www.gov.uk/government/publications/every-child-achieving-and-thriving/every-child-achieving-and-thriving-html-version

* This report looks at the school system in England, as education is devolved.
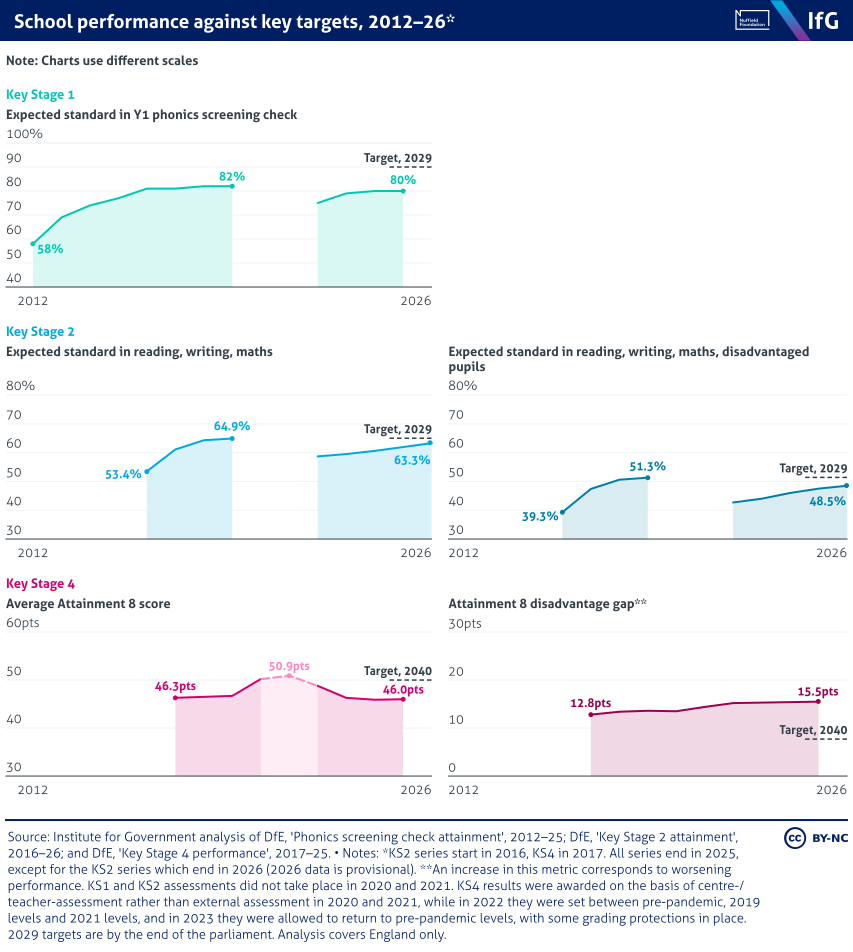
A small multiple area chart from the Institute for Government of school performance against key targets, 2012–26, where Key Stage 2 is on track, but Key Stage 1 phonics remains around 80% against a 90% target and the Attainment 8 disadvantage gap, at 15.5 points, is double its target.

Its Key Stage 2 targets are the most achievable. By 2029* the government wants more pupils, and more disadvantaged** pupils, to meet the expected standard in reading, writing and maths than ever before. In practice, this means increasing the proportion reaching the expected standard from 63.3% in 2026 to 65.0%, and from 48.5% to 51.4% respectively – exceeding the previous highs for both groups, set in 2019.

The good news is that if recent trends continue, those targets will be comfortably surpassed. Since attainment data resumed in 2022, progress has been strong enough that maintaining the current rate of improvement would mean 66.7% of pupils and 52.9% of disadvantaged pupils meeting the expected standard by 2029. 277 Department for Education, ‘Official statistics, Key stage 2 attainment, academic year 2024/25 revised’, gov. uk, 21 May 2026, retrieved 10 September 2026, https://explore-education-statistics.service.gov.uk/find-statistics/key-stage-2-attainment/2024-25-revised

However, the Key Stage 1 target will be harder to achieve. The government’s ambition for 90% of children to meet the expected standard in Year 1 phonics by 2029 would require breaking through a ceiling that has held for almost a decade. Attainment has remained stubbornly close to 80% since 2016,*** never rising above the peak of 82% achieved in 2018 and 2019. 278 Department for Education, ‘Official statistics, Phonics screening check attainment, academic year 2024/25’, gov.uk, 9 October 2025, retrieved 10 September 2026,https://explore-education-statistics.service.gov.uk/find-statistics/phonics-screening-check-attainment/2024-25

The government’s Key Stage 4 (GCSE stage) target on Attainment 8 (A8)**** scores is also tough. It wants the national A8 score to reach 50 by 2040, equivalent to the average pupil achieving a grade 5 (a strong pass) across each of eight GCSE subjects or approved qualifications they take. Even the unusually high grades awarded through teacher assessment in 2021, when exams were cancelled because of the pandemic, only took the national A8 score slightly above the government’s new target, to 50.9. 279 Department for Education, ‘Official statistics, Key stage 4 performance, academic year 2024/25’, gov.uk, 4 August 2026, retrieved 10 September 2026, https://explore-education-statistics.service.gov.uk/find-statistics/key-stage-4-performance/2024-25

Since assessments returned to normal, the score has remained around 46 – just below its pre-pandemic level – with no clear signs of improvement. Even if attainment improved at the rate it did between 2017 and 2019 (the only years pre-pandemic for which there is comparable data), it would take 20 years to reach a score of 50, meaning the government would hit the target in 2045.

* Throughout the chapter, we take 2029 (or the 2028–29 academic year) to be the end of this parliament.
** The Department for Education classifies as disadvantaged children who have been eligible for free school meals at some point in the last six years, and those who have ever been in the care of their local authority.
*** Data was not published in 2020 and 2021, due to the pandemic. In 2022, the first year that data resumed, this metric was at 75%, before returning to around the 80% mark.
**** Attainment 8 is a way of measuring how well pupils do at Key Stage 4. Each grade a pupil gets is assigned a point score from 1 to 9. Their A8 score is calculated by adding up the points from eight government-approved subjects, which must include maths and English. Maths is counted twice and so is English if both English literature and English language are taken.

Halving the disadvantage gap

The most ambitious target, however, is the plan to halve the Key Stage 4 attainment gap between disadvantaged pupils and their better-off peers by 2040 – a target some commentators have labelled “unbelievably tough”. 280 Tormey K, ‘“Unbelievably” tough DfE disadvantage target “lacks a huge plan”’, Tes Magazine, 15 April 2026, retrieved 10 September 2026, www.tes.com/magazine/news/general/unbelievably-tough-dfe-disadvantage-target-lacks-huge-plan  The government wants the gap, measured in A8 points, to fall to 7.7, but it has never come close to this level: the smallest on record is 12.8 points in 2017. 281 Department for Education, ‘Official statistics, Key stage 4 performance, academic year 2024/25’, gov.uk, 4 August 2026, retrieved 10 September 2026, https://explore-education-statistics.service.gov.uk/find-statistics/key-stage-4-performance/2024-25  Meeting the target would require a sustained reversal of recent trends, with the gap narrowing by 0.5 points every year for the next 15 years, despite widening by 0.4 points a year between 2017 and 2019.*

The scale of change implied is considerable. Meeting both Key Stage 4 ambitions – raising the national A8 score to 50 and halving the gap – would require disadvantaged pupils to improve their average score from 35.0 in 2025 to 44.4 by 2040. 282 Benyon K, ‘Halving the disadvantage gap’, FFT Education Data Lab, 24 June 2026, retrieved 10 September 2026, https://ffteducationdatalab.org.uk/2026/06/halving-the-disadvantage-gap  That is roughly equivalent to their achieving one grade higher in every subject they take.

The Department for Education (DfE) has not been that prescriptive about how schools should improve attainment – as indeed it has not been for much of the past two decades. Some interviewees thought this amounted to the government setting ambitious targets without providing concrete means for schools to achieve them. One said: “There is no programme or activity at all at national, regional or local level which could reasonably be thought to be likely to lead to the result desired.” 283 Institute for Government interview.

It would be unfair to suggest that the government is doing nothing to improve attainment. It has introduced measures to reduce absence, tackle teacher shortages and reform the SEND system, alongside more specific initiatives such as expanding free school meal eligibility, providing free breakfast clubs and establishing family hubs. These policies could all contribute to better attainment, with the latter three helping to tackle barriers to learning faced disproportionately by disadvantaged pupils.

But they do not yet add up to a clear strategy for delivering the government’s most difficult targets – not least halving the disadvantage gap.
*  As above, the only years pre-pandemic for which there is comparable data.

Schools are making good progress on absence, but the hardest challenges lie beneath the headline figures

The government has also set a target to reduce absence rates by nearly a fifth over the course of this parliament, from 7.15% in 2023–24* to 5.85% in 2028–29.**, 284 Department for Education, ‘Every child achieving and thriving’, gov.uk, 27 April 2026, retrieved 10 September 2026, www.gov.uk/government/publications/every-child-achieving-and-thriving/every-child-achieving-and-thriving-html-version  Achieving this would support its attainment ambitions, given the strong relationship between pupil attendance and educational outcomes, as well as providing wider benefits for pupils’ wellbeing and longer-term outcomes, such as labour market returns.

In the wake of the pandemic, absences reached heights not seen since at least the 1996–97 academic year. 285 Department for Education, ‘Official statistics, Pupil absence in schools in England, academic year 2024/25’, gov.uk, 21 May 2026, retrieved 10 September 2026, https://explore-education-statistics.service.gov.uk/find-statistics/pupil-absence-in-schools-in-england/2024-25  While they are now, for the most part, gradually declining, they remain well above pre-pandemic levels. In 2024–25, pupils missed 6.8% of school, up from 4.7% in 2018–19. 286 Ibid.  Recovery has been slowest in secondary schools, where absence only began to show clear signs of improvement in 2024–25 and remains more than 50% higher than before the pandemic.

Although final official figures are not yet available, early data for 2025–26 shows a slight increase in absence, to 6.9%, 287 Department for Education, ‘Official statistics, Pupil attendance in schools, Week 29 2026, End of 25/26 AY)’, gov.uk, 6 August 2026, retrieved 10 September 2026, https://explore-education-statistics.service.gov.uk/find-statistics/pupil-attendance-in-schools/2026-week-29-end-of-25-26-ay  which commentators have attributed to factors such as heatwaves and an unusually early flu season. 288 Chantler-Hicks L, ‘Heatwaves and illness take their toll as annual school attendance falls’, Schools Week, 6 August 2026, retrieved 10 September 2026, https://schoolsweek.co.uk/heatwaves-and-illness-take-their-toll-as-annual-school-attendance-falls

* This chapter refers to both academic school years and financial years. We refer to school years as 20XX–YY, and financial years as 20XX/YY.
** Equivalent to children attending 20 million more days of school in 2028–29 than in 2023–24.

Hitting its target of 5.85% by 2028–29 would require the fastest sustained fall in absence rates since the mid-2010s.* That is within reach – if the recovery seen since the post-pandemic peak in 2021–22 continues, absence would fall to 5.76% in 2028–29. 304 Department for Education, ‘Official statistics, Pupil absence in schools in England, academic year 2024/25’, gov.uk, 21 May 2026, retrieved 10 September 2026, https://explore-education-statistics.service.gov.uk/find-statistics/pupil-absence-in-schools-in-england/2024-25  But even this would only partially unwind the disruption of the pandemic and absence would remain around a fifth higher than in 2018–19.

Behind these headline figures lie two different attendance challenges. The first is a volume problem: a large number of children who are now missing a little bit more school every year. The second is a complexity problem: a small, but growing, group of children who are severely absent, meaning they miss more than half of school.
* Between 2010–11 and 2014–15, absence fell by 1.17ppts over four years. The government’s current target requires absence to fall by 1.3ppts over five years.
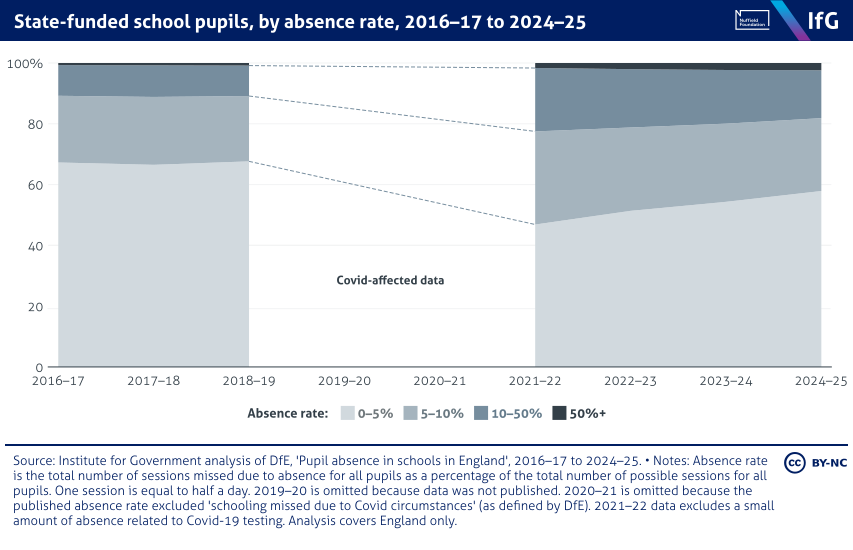
A 100% stacked area chart from the Institute for Government of state-funded school pupils, by absence rate, 2016–17 to 2024–25, where the share of pupils missing 5–10% of sessions rose from 21.5% in 2018–19 to 30.6% in 2021–22. It has since fallen to 24.0%, still above pre-pandemic levels.

The volume problem is visible in the sharp rise in pupils missing between 5% and 10% of school – from 21.5% in 2018–19 to 30.6% in 2021–22. 305 Ibid.  Although it has since fallen to 24.0%, it remains higher than before the pandemic.

The drivers of this increase are varied, but many appear to stem from changes in behaviour. Two interviewees highlighted how changes in social attitudes towards illness since the pandemic mean that what might once have meant one day away from school can now mean three. 306 Institute for Government interviews.  Equally, the attitude that every missed day of school matters has weakened among some parents, who saw classrooms close for prolonged periods during lockdowns. 307 Burtonshaw S and Dorrell E, Listening to, and learning from, parents in the attendance crisis, Public First, 2023, https://assets.nationbuilder.com/stonehaven/pages/3202/attachments/original/1772582658/ATTENDANCE-REPORT-V02-compressed.pdf?1772582658

Tackling this matters not only because it affects large numbers of children, but because early action can prevent problems becoming entrenched. 308 Institute for Government interview.

The government’s response to the volume problem has focused on taking a more structured, evidence-led approach to absence: bringing together its various initiatives and improving its understanding of what works among them. 309 Comptroller and Auditor General, Improving educational outcomes for disadvantaged children, Session 2024-25, HC 125, National Audit Office, 2024, www.nao.org.uk/wp-content/uploads/2024/07/improving-educational-outcomes-for-disadvantaged-children-1.pdf  This is important because, as the Education Endowment Fund (EEF) concluded in 2022, there is limited evidence on effective interventions for improving attendance, particularly in the post-pandemic context where some of the barriers have changed. 310 Education Endowment Foundation, ‘Summary of evidence, what does the evidence tell us about the best ways to improve attendance?’, (no date), retrieved 10 September 2026, https://educationendowmentfoundation.org.uk/education-evidence/leadership-and-planning/supporting-attendance/summary-of-evidence

This structured approach has been aided by DfE’s work on data sharing. Historically, the department collected attendance data only three times a year through the school census, meaning it could take up to eight months to become available to central and local government for analysis. 311 Institute for Government, event, ‘Data Bites #46: Getting things done with data in government’, 18 October 2023, www.instituteforgovernment.org.uk/event/data-bites-46-getting-things-done-data-government DfE’s automated daily attendance data pipeline now gives responsible bodies near real-time information on attendance patterns, which, if used well, enables earlier intervention and better benchmarking. 312 Ibid.

The pipeline has also generated new insights into attendance patterns and helped to shape targeted initiatives. For example, an interviewee told us that the data shows the fall in attendance during the transition from primary to secondary school, which existed before the pandemic, has since become more pronounced. In response, DfE has provided secondary schools with data on their incoming Year 7 cohort, allowing them to identify potential challenges and work with families before pupils make the transition. 313 Department for Education, guidance, ‘Monitor your school attendance: user guide’, gov.uk, 3 September 2026, retrieved 10 September 2026, www.gov.uk/government/publications/monitor-your-school-attendance-user-guide/monitor-your-school-attendance-user-guide

DfE has also sought to spread effective practice across the system. It has produced attendance toolkits drawing on approaches used by schools that have improved attendance, 314 Department for Education, ‘RISE attendance improvement’, gov.uk, 9 June 2026, retrieved 10 September 2026, www.gov.uk/government/publications/rise-support-for-improving-attendance-in-schools/rise-attendance-improvement  and shared this learning through conferences for school leaders. 315 Institute for Government interviews.  It has also developed resources to help schools communicate more effectively with parents about absence 316 Department for Education, ‘Communicating with parents about school attendance’, gov.uk, 9 June 2026, www.gov.uk/government/publications/communicating-with-parents-about-school-attendance  – an area the EEF found to be promising in its effects on absence. 317 Education Endowment Foundation, ‘Summary of evidence, what does the evidence tell us about the best ways to improve attendance?’, (no date), retrieved 10 September 2026, https://educationendowmentfoundation.org.uk/education-evidence/leadership-and-planning/supporting-attendance/summary-of-evidence

The other end of the attendance challenge is severe absence: defined as those missing more than half of their time in school. This doubled after the pandemic, from 0.8% of pupils in 2018–19 to 1.7% in 2021–22. 318 Department for Education, ‘Official statistics, Pupil absence in schools in England, academic year 2024/25’, gov.uk, 21 May 2026, retrieved 10 September 2026, https://explore-education-statistics.service.gov.uk/find-statistics/pupil-absence-in-schools-in-england/2024-25  Unlike wider absence trends, however, it has continued to increase (but is now slowing). In 2024–25, as many as 2.4% of pupils were severely absent – including 3.9% of secondary pupils – the highest levels recorded since comparable data began.

Although severely absent pupils represent a relatively small share of the school population, their impact on lost learning is much larger. In 2024–25, the 2.4% of pupils who were severely absent accounted for 16.6% of all missed school sessions. 320 Freedom of Information request.  That imbalance has grown over time, as absence among the most severely affected pupils has continued to deepen.

The drivers of severe absence are often complex and extend beyond what schools can address alone. 330 House of Commons, ‘Question for Department for Education on pupils, absenteeism, by Mr Tamanjeet Singh Dhesi, to Nick Gibb’, UIN 174413, tabled 27 March 2023, retrieved 10 September 2026, https://questions-statements.parliament.uk/written-questions/detail/2023-03-27/174413; Ofsted, ‘Securing good attendance and tackling persistent absence’, gov.uk, 7 February 2022, retrieved 10 September 2026, www.gov.uk/government/publications/securing-good-attendance-and-tackling-persistent-absence/securing-good-attendance-and-tackling-persistent-absence; Institute for Government interviews.  Interviewees highlighted the role played by unmet SEND needs, poor mental health, poverty and housing insecurity. 331 Institute for Government interviews.  For example, NHS data from 2023 shows that 20% of children aged 8 to 16 had a probable mental health disorder, up from 12% in 2017. 332 NHS England, ‘Mental Health of Children and Young People in England, 2023 – wave 4 follow up to the 2017 survey’, digital.nhs.uk, 21 November 2023, retrieved 10 September 2026, https://digital.nhs.uk/data-and-information/publications/statistical/mental-health-of-children-and-young-people-in-england/2023-wave-4-follow-up  This appears to be contributing to severe absence, with pupils highlighting how aspects of school such as crowded corridors, and academic and social pressures can exacerbate feelings of anxiety. 333 Arnot E, The relationship between mental ill health and absence in students aged 13 to 16: Results from the longitudinal study of young people – cohort 2, research report, Department for Education, 2025, https://assets.publishing.service.gov.uk/media/681b676c9ef97b58cce3e518/The_relationship_between_mental_ill_ health_and_absence_in_students_aged_13_to_16.pdf; Macmillan L and Anders J, ‘Rising school absence: what do we know and what can we do?’, blog, University College London, 16 January 2024, retrieved 24 October 2025, https://blogs.ucl.ac.uk/ioe/2024/01/16/rising-school-absence-what-do-we-know-and-what-can-we-do; Moore E, Martin K, Classick R and Welbourne S, Pupil wellbeing and persistent absence, National Foundation for Educational Research, 2026, www.nuffieldfoundation.org/wp-content/uploads/2025/03/NABS_InterimReport_July2026_FINAL.pdf  Equally, increasing poverty may mean more families struggle to afford school transport, spare uniforms and trips. 334 House of Commons Education Committee, Persistent absence and support for disadvantaged pupils (HC 970), The Stationery Office, 2023, https://committees.parliament.uk/publications/41590/documents/205047/default

Re-engaging severely absent children therefore often requires schools to work with wider public services, particularly local authorities and health and social care partners. The government’s attendance guidance, made statutory from August 2024, aimed to strengthen this shared responsibility by setting out clearer roles for schools, trusts and local authorities in tackling severe absence. 335 Department for Education, ‘Working together to improve school attendance’, gov.uk, guidance, 2026, https://assets.publishing.service.gov.uk/media/6a4f9ec6a6586e258d371bd0/Working_together_to_ improve_school_attendance_2026.pdf

But this cannot by itself resolve the deeper barriers to cross-service working. Wider experience across children’s services illustrates the challenge: despite NHS integrated care boards and police forces becoming child safeguarding partners alongside local authorities in 2017, evidence from the social care sector suggests joint working has deteriorated over time. Other services’ priorities are not aligned with schools’, and in many cases they lack the capacity to meet their own targets.

Conclusion and recommendations

The government’s ambitions on attainment and attendance are a mixture of achievable milestones and genuinely stretching goals. Delivering them will require the government to be clear about both what it intends to do and how progress will be judged.

On attainment, DfE should publish a detailed plan for halving the disadvantage gap – its most ambitious target – bringing together initiatives into a more structured, coherent approach. Alongside this, it should also set interim targets on the path to 2040, keeping itself accountable and allowing progress to be tracked.

The government must also continue to be clear about how success will be measured. Expected changes to the definition of disadvantage 336 Chantler-Hicks L, ‘Income data to replace free school meals as trigger for disadvantage funding’, Schools Week, 8 December 2025, retrieved 10 September 2026, https://schoolsweek.co.uk/pupil-premium-income-data-to-replace-free-school-meals-as-trigger-for-disadvantage-funding  and the composition of Attainment 8 337 Department for Education, ‘Progress 8 and Attainment 8 – an explanation of the proposed improved model’, gov.uk, 2025, https://assets.publishing.service.gov.uk/media/690a8e5388a98da87e2922cb/Progress_8_and_ Attainment_8_-_an_explanation_of_the_proposed_improved_model.pdf  risk making progress harder to interpret. DfE has, to its credit, committed to monitoring both of these challenges, while stating that regardless of any changes, “the ambition will remain commensurate with halving the gap”. 338 Department for Education, ‘Every child achieving and thriving’, gov.uk, 27 April 2026, retrieved 10 September 2026, www.gov.uk/government/publications/every-child-achieving-and-thriving/every-child-achieving-and-thriving-html-version#technical-annex-our-aspiration-…

The picture on attendance is more positive. The government has a clearer route to reducing overall absence, supported by better data, earlier intervention and the sharing of best practice – although it is still developing the evidence base on which approaches are most effective. The government should continue to support schools to build trusting relationships with parents, which has been key to reducing absence in the past. Perhaps the hardest part of the challenge lies in severe absence. Tackling this will require more than what schools alone can provide, depending instead on effective co-operation across education, health, social care and other public services. DfE should ensure that its approach to severe absence is supported by clear shared expectations across services, realistic assessments of capacity, and funding and incentives that enable education, health and social care to work together effectively.

  • DfE should publish a detailed plan for halving the disadvantage gap and set interim targets on the path to 2040 for this
  • DfE should continue to be clear about how success on its attainment targets will be measured in light of future changes to the definition of ‘disadvantage’ and Attainment 8
  • DfE should continue to support schools to build trusting relationships with parents to help reduce absence
  • DfE should ensure that its approach to severe absence is supported by clear shared expectations across services, realistic assessments of capacity, and funding and incentives that enable education, health and social care to work together effectively.

Teacher workforce

In 2025, DfE described the shortage of high-quality teachers as a “major issue”, identifying it as one of the most critical challenges to departmental objectives. 344 Department for Education, Consolidated Annual Report and Accounts, 17 July 2025,https://assets.publishing.service.gov.uk/media/687794132bad77c3dae4dc67/DfE_consolidated_annual_report_and_accounts_2024_ to_2025 web-optimised_version_.pdf

Labour entered government in 2024 promising to “recruit 6,500 new expert teachers in key subjects” by the end of the parliament. 345 Labour Party, Change: Labour Party Manifesto 2024, 2024, p.75, https://labour.org.uk/wp-content/ uploads/2024/06/Labour-Party-manifesto-2024.pdf  Yet for its first 18 months in office it was unclear exactly what that pledge meant, with the commitment appearing to evolve multiple times. It was only in February 2026 that the government published a workforce delivery plan, clarifying its ambitions.

The government’s headline workforce target is to increase the overall stock of teachers in secondary schools, special schools, alternative provision (AP) and further education by 6,500 (2.3%) by the end of this parliament, relative to 2023–24.*, 346 Department for Education, ‘6,500 additional teachers delivery plan’, policy paper, gov.uk, 27 April 2026, retrieved 10 September 2026, www.gov.uk/government/publications/every-child-achieving-and-thriving/6500-additional-teachers-delivery-plan-html-version  But the delivery plan also states that, while progress will be judged against this headline measure, the government also hopes to focus investment on:

  • Targeting recruitment into shortage subjects
  • Recruiting ‘expert’ teachers
  • Supporting places that face recruitment challenges, such as areas with higher deprivation. 347 Ibid.

* Notably, the target excludes primary schools, where recruitment has historically been healthier than in the secondary sector.

The government is on course to far exceed its headline workforce target, but not necessarily to meet need

Between 2023–24 and 2024–25, the stock of teachers increased by 3,984 – meaning the government needs to add just 2,516 more over the remaining four years of parliament to hit its headline target. 348 Department for Education, ‘Official statistics, School workforce in England, reporting year 2025’, gov.uk, 4 June 2026, retrieved 10 September 2026, https://explore-education-statistics.service.gov.uk/find-statistics/school-workforce-in-england/2025; Department for Education, ‘Official statistics, Further education workforce, Academic year 2024/25’, gov.uk, 14 May 2026, retrieved 10 September 2026, https://explore-education-statistics.service.gov.uk/find-statistics/further-education-workforce/2024-25  If teacher numbers continue to grow at the rate they have over the last year, the government will have added around 20,000 teachers to secondary schools, special schools, AP and further education by the end of the parliament, dwarfing its target.

The government’s target therefore does not look especially ambitious – meeting it requires only modest growth over the next few years. Nor does it appear to be dictated by the scale and nature of the workforce challenge.* Indeed, DfE’s own estimates suggest that to meet demand, the system needs 1,400 additional secondary school teachers between 2023–24 and 2027–28, and between 8,400 and 12,400 additional college teachers by 2028–29. 356 Department for Education, ‘Official statistics, Teacher demand and postgraduate trainee need, academic year 2026/27’, gov.uk, 23 April 2026, retrieved 10 September 2026, https://explore-education-statistics.service.gov.uk/find-statistics/teacher-demand-and-postgraduate-trainee-need/2026-27#headlines-section; Comptroller and Auditor General, Teacher Workforce: Secondary and Further Education, Session 2024–25, HC 854, National Audit Office, 30 April 2025, www.nao.org.uk/wp-content/uploads/2025/04/teacher-workforce-secondary-and-further-education.pdf

* In fact, it is unclear what made the government pick this figure at all. In May 2025, the National Audit Office concluded that it was “not clear if, or how, [the target] relates to known and forecast shortages across different settings”. See Comptroller and Auditor General, Teacher Workforce: Secondary and Further Education, Session 2024–25, HC 854, National Audit Office, 30 April 2025, www.nao.org.uk/wp-content/uploads/2025/04/teacher-workforce-secondary-and-further-education.pdf

Increases to teacher pay, as well as slack in the wider economy, have likely helped the government make progress

The government is taking a range of actions to improve teacher recruitment and retention, with increases to teacher pay among the most significant. 357 Department for Education, ‘6,500 additional teachers delivery plan’, policy paper, gov.uk, 27 April 2026, retrieved 10 September 2026, www.gov.uk/government/publications/every-child-achieving-and-thriving/6500-additional-teachers-delivery-plan-html-version#actions-from-here  Following recommendations made by the School Teachers’ Review Body,* the government awarded teachers in local authority-maintained schools** a 5.5% pay increase in 2024–25, followed by a further 4.0% increase in 2025–26 (both in cash terms). 358 Department for Education and The Rt Hon Bridget Phillipson MP, ‘Government confirms above inflation pay award for teachers’, press release, gov.uk, 29 July 2024, retrieved 10 September 2026,www.gov.uk/government/news/government-confirms-above-inflation-pay-award-for-teachers; Department for Education and The Rt Hon Bridget Phillipson MP, ‘Teachers to benefit from pay boost’, press release, gov.uk, 22 May 2025, retrieved 10 September 2026, www.gov.uk/government/news/teachers-to-benefit-from-pay-boost  These uplifts produced among the largest increases in mean secondary and special school/ AP teacher pay since 2010. 359 Department for Education, ‘Official statistics, School workforce in England, reporting year 2025’, gov.uk, 4 June 2026, retrieved 10 September 2026, https://explore-education-statistics.service.gov.uk/find-statistics/school-workforce-in-england/2025  By November 2025, real-terms mean teacher pay was 6.7% higher among secondary school teachers and 7.0% higher among special school/ AP teachers than when Labour entered office. 360 Ibid.

Pay rises have been more modest in further education (FE). While FE teachers employed in local authority-maintained schools (such as in a school sixth form) receive the same pay awards as school teachers, colleges set their own pay and conditions. 361 Lewis J and Plaskitt H, ‘What is happening with college teacher pay in England?’, House of Commons Library, 2 December 2024, retrieved 10 September 2026, https://commonslibrary.parliament.uk/what-is-happening-with-college-teacher-pay-in-england  As a result, real-terms mean teacher pay in FE increased by 0.4% between 2023–24 and 2024–25 (the latest year for which we have data). 362 Department for Education, ‘Official statistics, Further education workforce, Academic year 2024/25’, gov.uk, 14 May 2026, retrieved 10 September 2026, https://explore-education-statistics.service.gov.uk/find-statistics/further-education-workforce/2024-25


* An independent pay review body.
** Academies can set their own pay and conditions, but many follow recommendations made by the School Teachers’ Review Body.

These increases to pay, especially in secondary and special schools, have likely contributed to improvements in teacher recruitment and retention. Pay is expected to increase in real terms again over the next two years, with pay awards of 3.5% in 2026–27 and 3.0% in 2027–28 (both in cash terms), 372 Department for Education, ‘Teacher pay: everything you need to know about the latest multi-year pay award’, gov.uk, 2 July 2026, retrieved 10 September 2026, https://educationhub.blog.gov.uk/2026/07/teacher-pay-everything-you-need-to-know-about-the-latest-multi-year-pay-award  although higher than expected inflation may erode those increases.

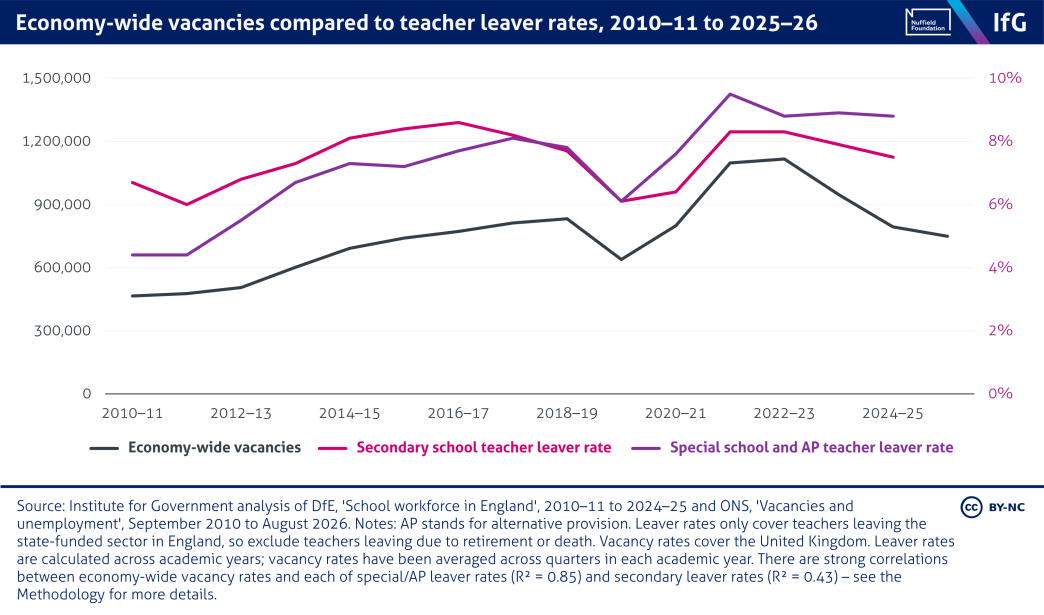
Wider economic conditions have also likely played an important role in reducing teacher shortages since 2022–23. As the labour market recovered after the pandemic, and economy-wide vacancies fell, the rates of teacher retention and recruitment to initial teacher training also improved.* In other words, when there were fewer employment opportunities elsewhere in the economy, teaching may have become a relatively more attractive option for both prospective entrants and existing teachers, contributing to the improvement in the stock of teachers.

* The R² for the relationship between secondary teacher training recruitment and economy-wide vacancies is 0.91; between secondary teacher leaver rates and economy-wide vacancies is 0.43; between special school/alternative provision teacher leaver rates and economy-wide vacancies is 0.85. These are all strong relationships according to our classification – detailed in the Methodology.
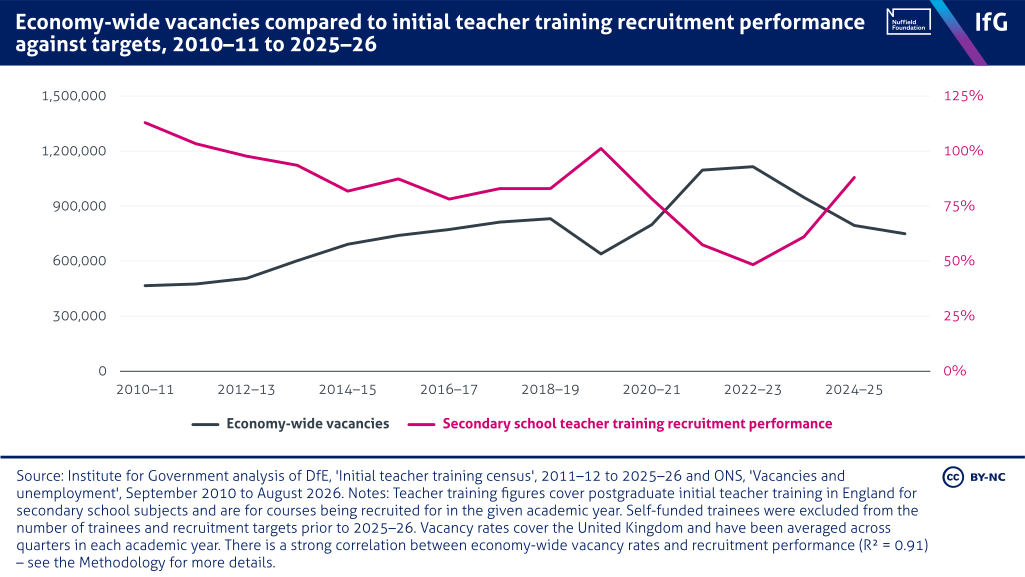
A line chart from the Institute for Government of economy-wide vacancies compared to initial teacher training recruitment performance against targets, 2010–11 to 2025–26, where recruitment falls when vacancies rise. As vacancies peaked above 1.1 million, secondary recruitment fell to 48% of target, before recovering to 88% as vacancies eased.
A line chart from the Institute for Government of economy-wide vacancies compared to teacher leaver rates, 2010–11 to 2025–26, where leaver rates rise and fall with vacancies. The special school and alternative provision leaver rate has doubled since 2010–11, from 4.4% to 8.8%, and is now above secondary schools at 7.5%.

This is consistent with academic research, which finds that factors such as rates of graduate unemployment have a significant influence over people’s decisions to enter teaching, with the profession often considered a ‘fall-back’ option for many graduates. 373 Hutchings M, ‘What impact does the wider economic situation have on teachers’ career decisions? A literature review’, Department for Education, 2011, https://assets.publishing.service.gov.uk/media/5a7b14e140f0b66a2fc05055/DFE-RR136.pdf  There is also evidence that wider labour market conditions have some influence over teacher retention: when earnings in teaching become more competitive relative to comparable occupations, fewer teachers leave. 374 Ibid.

Beneath the headline figure, progress on teacher shortages is a mixed picture 

As discussed above, the government’s headline metric on the teacher workforce is not a particularly good reflection of its wider objectives. Progress against that measure says nothing about whether the teachers recruited are being deployed in shortage subjects, in the parts of the country where they are most needed, nor whether they are ‘expert’ teachers – three areas the government has identified as priorities.

Performance against shortage subject recruitment targets has improved substantially, largely because targets have fallen

The government sets annual targets covering postgraduate training, which accounts for the bulk of initial teacher training. These targets are intended to make sure that the school system has sufficient numbers of teachers in future, based on trends in pupil numbers and assumptions about teacher recruitment and leaver rates.

Historically, some secondary subjects have fallen very short of these targets. Between 2021–22 and 2023–24, for example, physics and design and technology recruited an average of just 18% and 25% of the number targeted, respectively. 375 Department for Education, ‘Official statistics, Initial Teacher Training Census, Academic year 2025/26’, gov.uk, 4 December 2025, retrieved 10 September 2026, https://explore-education-statistics.service.gov.uk/find-statistics/initial-teacher-training-census/2025-26  These are among the ‘shortage subjects’ with the most substantial and persistent recruitment challenges.*

While the government continued to significantly under-recruit into these shortage subjects in 2024–25, performance improved markedly in 2025–26. Physics, for example, which had recruited only around two in 10 of its target trainees in the previous four years, recruited almost eight in 10 of its target number in 2025–26. 376 Ibid.

* We define shortage subjects as those that missed their target by half or more in the three years prior to 2024–25, the year in which Labour took office. We exclude low-entry subjects reported as an ‘other’ group in the source data.
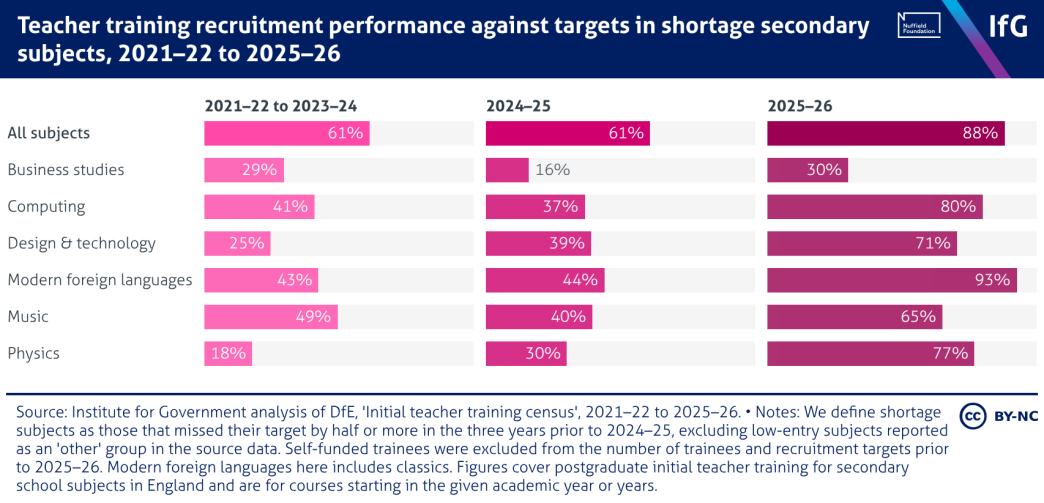
A small multiple bar chart from the Institute for Government of teacher training recruitment performance against targets in shortage secondary subjects, 2021–22 to 2025–26, where every shortage subject improved in 2025–26 but still missed target. Physics recruited 77% of target, up from 18% across 2021–22 to 2023–24.

This looks like a substantial improvement in teacher supply, but there are two reasons to be cautious that things have improved as much as this. First, meeting a recruitment target does not necessarily mean meeting demand for teachers. DfE’s approach to setting the targets does not account for shortages that have built up over previous years (it assumes that existing numbers of teachers are sufficient). 377 Department for Education, ‘Methodology for 2026 to 2027 PGITT trainee need and drivers analysis’, gov.uk, 23 April 2026, retrieved 10 September 2026, https://explore-education-statistics.service.gov.uk/methodology/methodology-for-2026-to-2027-pgitt-trainee-need-and-drivers-analysis  Second, the apparent improvement in 2025–26 was driven largely by reductions in recruitment targets rather than substantial increases in the number of recruits.
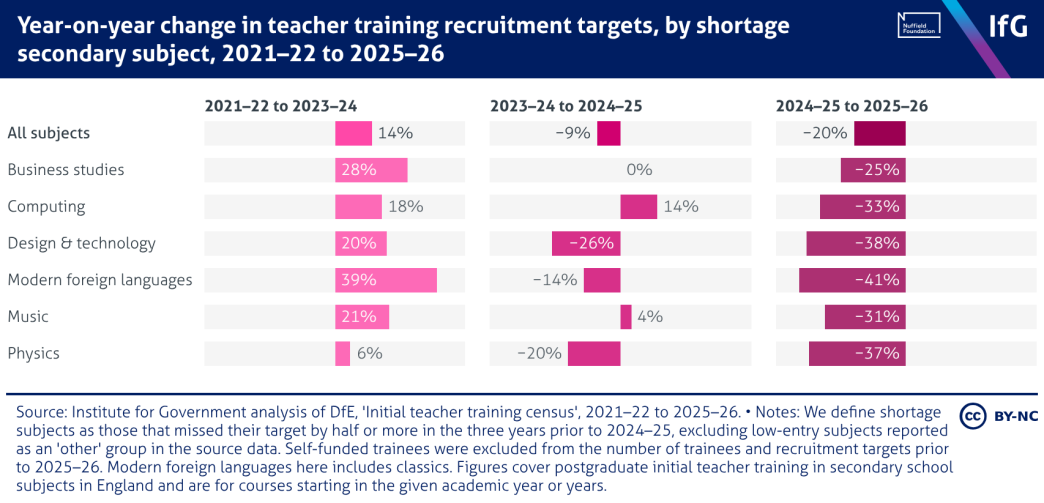
A small multiple bar chart from the Institute for Government of year-on-year change in teacher training recruitment targets, by shortage secondary subject, 2021–22 to 2025–26, where targets rose until 2023–24 but were cut in every shortage subject in 2025–26, by 20% overall and 41% for modern foreign languages.

In 2025–26, the government was aiming to recruit a fifth fewer teacher trainees than it was in 2024–25, at least in part because pupil numbers are starting to fall in secondary schools (albeit only by 0.3% in 2025–26) and because of recent improvements in teacher retention. 378 Department for Education, ‘Official statistics, Initial Teacher Training Census, Academic year 2025/26’, gov. uk, 4 December 2025, retrieved 10 September 2026, https://explore-education-statistics.service.gov.uk/find-statistics/initial-teacher-training-census/2025-26; Department for Education, ‘Official statistics, Schools, pupils and their characteristics’, Gov.uk, 14 July 2026, retrieved 10 September 2026, https://explore-education-statistics.service.gov.uk/find-statistics/school-pupils-and-their-characteristics/2025-26  The reduction in targets was particularly pronounced in shortage subjects – all saw their recruitment targets fall by at least 5 percentage points more than the overall target. This mechanically improved their performance against targets relative to non-shortage subjects. The most extreme example is modern foreign languages,* where the government reduced its target from 2,560 in the previous year to 1,520 – the lowest recruitment target for the subject since at least 2015–16. 379 Department for Education, ‘Official statistics, Initial Teacher Training Census, Academic year 2025/26’, gov.uk, 4 December 2025, retrieved 10 September 2026, https://explore-education-statistics.service.gov.uk/find-statistics/initial-teacher-training-census/2025-26

Across these shortage subjects, the actual number of teachers recruited increased by 32% (16% across secondary teachers as a whole). 380 Ibid.  This absolutely represents a success, but one that is overstated by the change in performance against recruitment targets.

* Which here includes classics.

The pace of progress in shortage subjects will be difficult to maintain

The pace of improvement seen in shortage subject recruitment in 2025–26 will be difficult to maintain. There is limited scope for the government to continue reducing recruitment targets at the pace seen in 2025–26: the 20% cut was much larger than the 0.3% fall in secondary pupils in that year.

Moreover, the government is scaling back on one of its main levers for attracting trainees into shortage subjects, in 2026–27 lowering its grants and bursaries for many of those subjects – and in the case of music, stopping them completely. 384 Department for Education, ‘Guidance, Funding: Initial teacher training (ITT), academic year 2026 to 2027’, gov.uk, 7 May 2026, retrieved 10 September 2026, www.gov.uk/government/publications/funding-initial-teacher-training-itt/funding-initial-teacher-training-itt-academic-year-2026-to-2027  Analysis from the National Foundation of Education Research has shown that bursaries are generally good at increasing teacher training recruitment, with early data for 2026–27 suggesting that reductions in bursaries have, on average, led to falls in applications for affected subjects. 385 Worth J and Scott M, The School Teacher Labour Market in England, National Foundation for Educational Research, 2026, www.nfer.ac.uk/publications/school-teacher-labour-market-in-england-annual-report-2026

More secondary teaching is being delivered outside teachers’ specialisms, despite the government’s ambition to recruit more ‘expert’ teachers

While the government has not publicly defined what it means by ‘expert’ teachers, various interviewees for this report suggested the best proxy in official data – and the one the government is using to track its own progress – is whether teachers are subject specialists, that is, teaching subjects that they have a relevant post-A-level qualification in. 386 Institute for Government interviews.  By this measure, the share of non-expert teaching has risen since Labour took office.

In the 2025–26 academic year, 2.6% of hours taught in state-funded secondary schools were delivered by non-qualified teachers, and a further 12.9% were taught by qualified, but non-specialist teachers – those without a relevant post-A-level qualification. 394 Department for Education, ‘Official statistics, School workforce in England, reporting year 2025’, gov.uk, 4 June 2026, retrieved 10 September 2026, https://explore-educationstatistics.service.gov.uk/find-statistics/school-workforce-in-england/2025  Non-specialist teaching is now at levels last seen a decade ago, eroding the gradual progress made during the late 2010s.

However, subject specialism is an imperfect measure of what the government ultimately wants from its focus on ‘expert’ teachers: better teacher quality. DfE’s own research from 2016 concludes (from limited available evidence) that having a teacher with a degree in the subject being taught has, at most, a small positive impact on pupil outcomes at GCSE.*, 395 Department for Education, Specialist and non-specialist teaching in England: Extent and impact on pupil outcomes, gov.uk, 2016,https://assets.publishing.service.gov.uk/government/uploads/system/uploads/attachment_data/file/578350/SubjectSpecialism_Report.pdf

This leaves a gap in the government’s workforce ambitions. Many of its targets focus, essentially, on quantity over quality. And while the ‘expert’ teacher goal is intended to put greater emphasis on teacher quality, it is unclear how good of a proxy it is, it is moving in the wrong direction and it is not part of the government’s headline measure.

* While having a teacher who knows the subject content on the curriculum does matter for pupil outcomes, the available evidence suggests there is no clear link between having that knowledge and having a degree in the subject. Other aspects of teacher quality, such as knowledge of effective teaching methods, also matter for pupil outcomes but are not reflected in teachers’ subject specialism.

It is difficult to understand – or track – how recruitment difficulties vary nationally

The government has stated that it wants to support the parts of the country where teacher recruitment is most difficult, including more deprived areas. But with just 0.4% of teacher positions recorded as vacant in 2025–26, and a further 0.4% recorded as temporarily filled, 396 Department for Education, ‘Official statistics, School workforce in England, reporting year 2025’, gov.uk, 4 June 2026, retrieved 10 September 2026, https://explore-education-statistics.service.gov.uk/find-statistics/school-workforce-in-england/2025  the available data implies a more mild set of recruitment difficulties across England than reports – and performance against initial teacher training targets – would suggest.

This may be partly because the data is collected in November, when vacancies are relatively low following the start of the school year. 397 Institute for Government interview.  Equally, the data does not capture how schools adapt to shortages before posts become formally vacant – for example, by recruiting non-specialists, increasing class sizes, or changing timetables. 398 Institute for Government interviews.  Likely as a result of these flaws, we did not find any relationship between vacancies or temporarily filled posts, and deprivation* – despite evidence from elsewhere that more deprived areas have the greatest difficulty recruiting teachers. 399 Chantler-Hicks L, ‘Disadvantaged schools recruiting fewer ‘strong’ teachers, analysis shows’, Schools Week, 25 June 2026, retrieved 10 September 2026, https://schoolsweek.co.uk/disadvantaged-schools-recruiting-fewer-strong-teachers-analysis-shows/

These data quality issues make it hard to know where recruitment difficulties are most severe and whether efforts to address them are making a difference. Better local data, collected at different points in the year and covering teacher quality as well as availability, would make it easier to target efforts geographically and track progress.

* See the Methodology for regression details.

Conclusions and recommendations

While the government’s headline teacher workforce target is highly achievable, progress against it says little about whether the government is solving teacher shortages, or achieving its wider goals in the area. Particularly absent is a sufficient focus on teacher quality, which according to the EEF “is the most important lever schools have to improve outcomes for their pupils”. 400 Education Endowment Foundation, ‘High-quality teaching’, EEF, (no date), retrieved 10 September 2026, https://educationendowmentfoundation.org.uk/support-for-schools/school-planning-support/1-high-quality-teaching

DfE should therefore develop better ways to measure success in tackling teacher
shortages. This should include ensuring its targets reflect its wider goals, as well as producing more timely and geographically detailed information on recruitment difficulties.

  • DfE should ensure its teacher workforce targets reflect its wider goals
  • It should also provide more timely and geographically specific data on recruitment.

Reforming the special educational needs and disabilities (SEND) system

No issue looms larger for schools over this parliament than the crisis in the SEND system. Described by the government itself as “broken”, 406 Department for Education and The Rt Hon Bridget Phillipson MP, ‘Radical expansion in rights for children with SEND’, press release, gov.uk, 23 February 2026, retrieved 10 September 2026, www.gov.uk/government/news/radical-expansion-in-rights-for-children-with-send  the system is overwhelmed by levels of demand far beyond what it was designed to handle. Spending is unsustainably high – and growing.* Outcomes are deteriorating and confidence in the system collapsing.**

In early 2026, after several delays, the Starmer government set out a plan to reform the system and launched a consultation on the proposals. 407 Department for Education, ‘SEND reform: putting children and young people first’, consultation, 27 April 2026, retrieved 10 September 2026, www.gov.uk/government/consultations/send-reform-putting-children-and-young-people-first/send-reform-putting-children-and-young-people-first-html-vers…  It was a high-stakes moment: fixing the SEND system was seen as a test of Labour’s ability to deliver public service reform, with pressure mounting from backbench MPs and campaigners and the fiscal risks of inaction becoming increasingly difficult to ignore.

While the detail of the reforms remains under development, the direction of travel is unlikely to change. The central ambition is to move towards a more inclusive and preventative system: where children are supported in mainstream settings wherever possible, and where needs are identified and addressed earlier.

Earlier this year, we examined these reform plans in detail, setting out a series of recommendations for how they could be strengthened. Building on that work, below we establish – as far as current data allows – a baseline for the government’s key objectives for SEND reform, setting out where the system stands today so that progress can be tracked over time.

* See our forthcoming Public Services Performance Tracker report on Local Government (November 2026)
** For an overview of the problems facing the SEND system, and recommendations to fix it, read Performance Tracker 2025: Schools and Joining up SEND

What are special educational needs and what support is available?

A child is considered to have special educational needs and disabilities (SEND) if they have a learning difficulty or disability that requires extra or different educational provision from what is typically available.

SEND provision is currently organised into three tiers:

  • At the base is ordinarily available provision – everyday adjustments that education settings are expected to make for all pupils through standard teaching practice.
  • Where this does not meet a child’s needs, non-statutory ‘SEN support’ offers more targeted interventions.
  • The highest, most acute tier is an education, health and care plan (EHCP), a legal document setting out a personalised package of support.

Plans to reduce reliance on EHCPs appear optimistic

One of the most controversial elements of the government’s reforms is the plan to reduce the number of children with EHCPs. Ministers intend to do this by tightening eligibility* while investing more in lower-tier provision, so that more children are supported earlier.

Reducing reliance on EHCPs is central to the SEND reform programme. Without it, the ambition of a more preventative SEND system becomes much harder to realise. Resources will likely continue to be pulled towards the highest tiers of support, leaving less for the lower tiers that can prevent needs from escalating in the first place. Equally, much of the government’s plans for bringing SEND spending under control depend on it being able to quell the rise in EHCPs. 408 Office for Budget Responsibility, Economic and Fiscal Outlook March 2026, The Stationery Office, 2026, https://assets.publishing.service.gov.uk/media/69a6d7b62e1f4fbda4252208/economic-and-fiscal-outlook-march-2026-web-accessible.pdf

But achieving this means turning the tide on a decade-long trend. Historically, the share of pupils with EHCPs has been remarkably stable at 2.8%.** But since 2017, it has risen every year and at an increasing pace, reaching 5.3% of all pupils in 2025 (the year which the government used as a starting point for its modelling). 409 Department for Education, ‘Official statistics, Special educational needs in England, Academic year 2024/25’, gov.uk, 6 May 2026, retrieved 10 September 2026, https://explore-education-statistics.service.gov.uk/find-statistics/special-educational-needs-in-england/2024-25

That modelling assumes this trajectory will change as reforms are rolled out from 2026. The government does expect the share of pupils with an EHCP to continue to rise until 2030, but at a slower rate than in recent years. From 2030, once the new system is fully in place, it expects the share to fall, returning to around 5% by 2035. 410 Department for Education, Annex – Background on projections, Department for Education, 2026, https://assets.publishing.service.gov.uk/media/69987b40bfdab2546272c096/Background_on_projections.pdf

* The new approach would replace the current bespoke system with several nationally defined specialist provision packages, setting out the types of need that qualify for an EHCP, the expected support and the associated funding.
** EHCPs here include their predecessor, SEN statements.

But EHCPs are already at a higher level than the government expected as it begins to roll out its reforms. Between 2025 and 2026, the proportion of pupils with an EHCP rose from 5.3% to 6.0% – the largest annual increase since at least 2010. 419 Department for Education, ‘Official statistics, Special educational needs in England, Academic year 2024/25’, gov.uk, 6 May 2026, retrieved 10 September 2026, https://explore-educationstatistics.service.gov.uk/find-statistics/special-educational-needs-in-england/2024-25  This is higher than the government’s central projection of 5.8% for 2026, and sits at the upper end of the range it considered plausible. 420 Department for Education, Annex – Background on projections, Department for Education, 2026, https://assets.publishing.service.gov.uk/media/69987b40bfdab2546272c096/Background_on_projections.pdf

More fundamentally, it is not clear exactly how the reforms will slow the growth in EHCPs before the new system is fully in place. The government is relying on its investments between 2026 and 2030 in early intervention and specialist bases to slow growth, but there is reason to doubt the effect will be as large as it anticipates.

Until the new system is fully in place,* local authorities will remain bound by the current legal framework for EHCP eligibility. Several interviewees told us that SEND tribunals – where parents can challenge individual decisions made about EHCPs and secure legally binding rulings – will likely continue to pull practice towards the law as it stands, leaving little scope for services to change their approach ahead of 2030. 421 Institute for Government interviews.

Nor will the shift towards preventative practice translate into reduced demand for EHCPs immediately: the investment being made now will likely take a few years to bear fruit, especially given it may take until 2028 for the government to even set out the preventative support that services should offer.

There is also a risk that the reforms themselves could fuel demand for EHCPs in the short term. Under the government’s proposed timetable, children who secure an EHCP before September 2029 will retain it at least until the end of their current school phase (primary, secondary, et cetera). After that date, new packages will be chosen from a national list so will be less bespoke, and it is not yet clear what they will include.**

This hands both schools and parents a clear incentive to secure EHCPs before September 2029 – in effect, the reforms create a ‘use it before you lose it’ dynamic. Local authorities have limited incentives to counteract this dynamic, since much of their SEND overspend between now and 2028/29 is likely to be written off by central government.***, 422 Ministry of Housing, Communities and Local Government, ‘Explanatory note on the government’s approach to Dedicated Schools Grant deficits’, 9 February 2026, retrieved 25 February 2026, www.gov.uk/government/publications/explanatory-note-on-the-governments-approach-to-dedicated-schools-grant-deficits

All of this means the government’s projections for reducing reliance on EHCPs before 2030 look optimistic. Indeed, if growth in EHCPs simply continues at the average rate seen between 2022 and 2026 – rather than accelerating further, as it has consistently done over that period – almost one in 10 pupils would be receiving an EHCP by 2030 (9.2%), compared to 7.7% under the government’s modelling. There is still a lot of uncertainty about what will happen after the reforms are fully rolled out in 2030, largely because it is still not clear exactly how EHCPs will change.

This also means the shift to a preventative system – and the improvements in outcomes that this is intended to deliver – will become harder and slower to achieve due to the age-old problem of resource getting sucked into acute provision and away from prevention. It could also put pressure on its wider spending plans for this parliament. As the Office for Budget Responsibility wrote in March 2026, “uncertainty around the impact of the reforms represents a continued risk to the [fiscal] forecast”. 423 Office for Budget Responsibility, Economic and Fiscal Outlook March 2026, The Stationery Office, 2026, https://assets.publishing.service.gov.uk/media/69a6d7b62e1f4fbda4252208/economic-and-fiscal-outlook-march-2026-web-accessible.pdf

* Or at least until new legislation is introduced, which will likely take a few years.
** Before setting out the contents of these packages, the government intends to build up the evidence base on what works to improve outcomes for children with different special educational needs. This may not conclude until 2028.
*** Some local authorities are, however, still concerned about the impact that residual deficits will have on their finances – for more detail, see the forthcoming Performance Tracker report on local government.

Funding is increasingly absorbed by crisis support rather than early intervention

While prevention is a welcome objective for a reformed SEND system to pursue, the government has yet to pin down what ‘prevention’ actually means. Without that clarity, it is much harder for policy makers and local areas to protect preventative services, or boost spending on them over time.

It is also much harder to judge whether the reforms are succeeding. In the absence of a clear definition, there is no way of measuring whether the system is becoming more preventative. Instead, we draw on two indicators that offer an imperfect but useful picture of whether the system is moving towards prevention.

Does funding follow prevention?

One way to judge whether the system is becoming more preventative is to follow the money. Currently, much of the funding for SEND is channelled through the high-needs block of school budgets, where resources are often allocated to individual children with EHCPs. By contrast, funding that sits within schools’ core budgets can be deployed earlier and more flexibly, allowing schools to design support around groups of children with similar needs and intervene before needs escalate. 424 Hughson T, Tiwari D, Menzies L and others, International Comparative Review: SEND policy, Centre for Education Systems, 2025, https://3a551fc8-7675-4cc59ecd8697a47d348f.filesusr.com/ugd/5d3f2a_b7f4f80b69cb4512bc4e6923345473dd.pdf

A more preventative system would be less reliant on the high-needs block: we would expect the growth in high-needs spending to slow, and for it to account for a smaller share of schools’ funding. DfE has recognised this, and as part of its reforms has committed to rebalance SEND funding by gradually shifting some money from the high-needs block into the core budgets of schools and colleges. 425 Department for Education, SEND reform: putting children and young people first, 27 April 2026, retrieved 10 September 2026, www.gov.uk/government/consultations/send-reform-putting-children-and-young-people-first/send-reform-putting-children-and-young-people-first-html-vers…  This is a welcome move.

Over the last ten years, however, the system has moved in the opposite direction. High-needs spending* increased by 79% in real terms from 2015/16 to 2024/25, from £6.9bn to £12.4bn (in 2026/27 prices). 426 Department for Education, ‘Dedicated schools grant (DSG) 2026 to 2027’, gov.uk, (no date), retrieved 10 September 2026, https://skillsfunding.service.gov.uk/view-latest-funding/national-funding-allocations/DSG/2026-to-2027 And it rose from 12% to 19% as a share of school funding over the same period, with growth expected to accelerate over the next two years.

* Defined as high-needs funding for 5 to 16 year-olds plus the in-year deficit on the dedicated schools grant, which is overwhelmingly driven by overspends on high-needs SEND provision.

However, changes to high-needs spending cannot tell us whether schools are actually investing more in activities that prevent needs from escalating, rather than merely investing less in acute SEND support. To assess whether the reforms are genuinely making the system more preventative, DfE will need to define which areas of spending count as preventative and measure whether they are increasing over time.

Is support moving upstream?

A second proxy for prevention is the balance of SEND provision between lower and higher tiers of support. In 2010, SEN support was 6.6 times more common than EHCPs; by 2026, it was only 2.5 times as common. 428 Department for Education, ‘Official statistics, Special educational needs in England, Academic year 2024/25’, gov.uk, 6 May 2026, retrieved 10 September 2026, https://explore-education-statistics.service.gov.uk/find-statistics/special-educational-needs-in-england/2024-25  So the rise in EHCPs partly reflects a change in where children’s needs are being met, rather than simply a change in the level of need itself: more children are reaching the highest tier of support, despite the overall number of children identified as having SEND remaining broadly similar.*

* For more information about why this has happened, see Dellar A, Joining up SEND, Institute for Government, July 2026, www.instituteforgovernment.org.uk/publication/joining-up-send

The government has yet to define what a ‘more inclusive’ system looks like

While creating a more inclusive education system is a central ambition of the SEND reforms, as with prevention, the government has yet to articulate what this should look like in practice. In its 2026 schools white paper, DfE variously describes inclusion as “actions that meet all children’s needs”, as enabling more children to succeed in mainstream education, and ultimately as creating “one education system, not two parallel ones”. 434 Department for Education, SEND reform: putting children and young people first, 27 April 2026, retrieved 10 September 2026, www.gov.uk/government/consultations/send-reform-putting-children-and-young-people-first/send-reform-putting-children-and-young-people-first-html-vers…  And the National Audit Office notes that this is a long-standing problem. Since 2014, DfE has sought to make mainstream schools more inclusive without making clear what this entails. 435 Comptroller and Auditor General, Support for children and young people with special educational needs, Session 2024- 25, HC 299, National Audit Office, 2024, www.nao.org.uk/wp-content/uploads/2024/10/support-for-children-and-young-people-with-special-educational-needs.pdf

Translating that ambition for inclusion into something measurable is therefore not straightforward. One local authority found little consensus after asking headteachers to develop a shared framework for inclusion. 436 Institute for Government interview.  As Matthew Evans, CEO of an academy trust, recently asked:*

“Inclusion for whom, into what, and for what purpose?” 437 Evans M, ‘Something Very Bad Is Going to Happen’, Matthew Evans, 19 April 2026, https://matthewevanseducation.substack.com/p/something-very-bad-is-going-to-happen

Amid this uncertainty, we examine three indicators available in published data. While these measures are limited by what the data captures and the lack of a clear benchmark for inclusion, they align with those that the government has signalled it may use to assess progress.

* In doing so, quoting Armstrong et al. (2009), The Current State of Inclusive Education: Contradictions and Concerns.

The share of pupils educated in special schools

Children are increasingly educated outside mainstream settings. While overall pupil numbers rose by 6% between 2016 and 2025, the sharp rise in EHCPs meant enrolment in special schools jumped by 66%, 438 Department for Education, ‘Official statistics, Special educational needs in England, academic year 2025/26’, gov.uk, 30 June 2026, retrieved 10 September 20226, https://explore-education-statistics.service.gov.uk/find-statistics/special-educational-needs-in-england/2025-26  putting substantial pressure on their capacity. As a result, the share of pupils educated in special schools rose from 1.4% to 2.2%.

In February 2026, the government projected that this increase* would slow, with the share rising by no more than 0.4 percentage points between 2024 and 2034 before beginning to fall slightly. 443 Department for Education, Annex – Background on projections, Department for Education, 2026, https://assets.publishing.service.gov.uk/media/69987b40bfdab2546272c096/Background_on_projections.pdf  This projection relies on, among other things, the expectation that some specialist provision will instead be delivered through ‘inclusion bases’ in mainstream schools – which the government expects every secondary school to eventually have after investing in them as part of the reforms. 444 Department for Education, SEND reform: putting children and young people first, 27 April 2026, retrieved 10 September 2026, www.gov.uk/government/consultations/send-reform-putting-children-and-young-people-first/send-reform-putting-children-and-young-people-first-html-vers…

Data released since shows a small divergence from this projected path, with the share rising to 2.4% in 2026, compared with the modelled 2.3%. 445 Department for Education, ‘Official statistics, Special educational needs in England, academic year 2025/26’, gov.uk, 30 June 2026, retrieved 10 September 20226, https://explore-education-statistics.service.gov.uk/find-statistics/special-educational-needs-in-england/2025-26  If growth continues at the rate seen between 2022 and 2026, this divergence would widen considerably: the share would reach 3.1% by 2030, compared with the government’s projection of 2.5%, putting further pressure on already stretched state special school capacity.

A closely related measure is the share of pupils with special educational needs educated in mainstream settings. This is included in the Ministry of Housing, Communities and Local Government’s Local Outcomes Framework as an indicator of local progress against national priorities. 446 Ministry of Housing, Communities & Local Government, ‘Local Outcomes Framework’, policy paper, gov.uk, 1 July 2026, retrieved 10 September 2026, www.gov.uk/government/publications/local-outcomes-framework/local-outcomes-framework

* We have calculated this metric slightly differently to the government, hence the slight discrepancy in 2025 figures in the chart above. Calculating using their methodology produces an almost identical historical trend, and a slightly higher constant growth projection.

That proportion has remained almost unchanged over the past decade, falling from 84% to 82%, while differences between areas have also remained broadly stable. This stability, however, contrasts with concerns that the education system became less inclusive during the 2010s, particularly after the previous round of SEND reforms in 2014. 452 Committee on the Rights of Persons with Disabilities, ‘Convention on the Rights of Persons with Disabilities’, United Nations, 2017, 3 October 2027, retrieved 10 September 2026,https://docstore.ohchr.org/SelfServices/FilesHandler.ashx?enc=Z2cfNmtO9Ebs%2BKpZD1LG6vYnVS%2BZT3v5YWpGOxQEfChzu%2FuAj%2Bgv9lQ PtU0c3Fkb4tlr4PgOpHnKkSBYMs%2BeYw%3D%3D; Wallace M, Trends in Adolescent Disadvantage, Centre for the Analysis of Social Exclusion, 2023, https://sticerd.lse.ac.uk/dps/case/spdo/spdorp15.pdf; Ofsted, ‘The Annual Report of Her Majesty’s Chief Inspector of Education, Children’s Services and Skills 2017/18’, gov.uk, 4 December 2018, retrieved 10 September 2026, www.gov.uk/government/publications/ofsted-annual-report-201718-education-childrens-services-and-skills/the-annual-report-of-her-majestys-chief-inspec…

This suggests that this measure – and, by extension, the one above – may not capture the aspects of inclusion that the government’s reforms are intended to improve. If so, the government risks assessing progress against measures that do not reflect its core objective. But if they do capture what matters, the government has yet to define what level of inclusion would represent success.

Ofsted judgments on inclusion

In November 2025, Ofsted introduced a standalone ‘inclusion’ judgment into its inspection framework for schools, signalling a shift in accountability in line with SEND priorities. 453 Ofsted, ‘Education inspection framework: for use from November 2025’, gov.uk, 9 September 2025, retrieved 10 September 2026, www.gov.uk/government/publications/education-inspection-framework-eif/education-inspection-framework-for-use-from-november-2025  Unlike the two measures above, this is intended to assess the quality of inclusive practice rather than simply where children are educated. Inspectors consider, among other things, how well the school meets the needs of children with SEND, whether school leaders set a clear and ambitious vision for inclusion, and whether pupils feel they belong. 454 Ofsted, ‘Improving the way Ofsted inspects education: report on the responses to the consultation’, consultation outcome, gov.uk, 9 September 2025, retrieved 10 September 2026, www.gov.uk/government/consultations/improving-the-way-ofsted-inspects-education/outcome/improving-the-way-ofsted-inspects-education-report-on-the-res…

While this offers a richer measure of inclusion than the two above, it presents its own risks. Because DfE has not yet settled on a final definition of ‘inclusion’, it is difficult to know whether Ofsted’s judgments align with the ongoing thinking in DfE.

A few interviewees also highlighted that Ofsted does not inspect schools’ admissions processes, despite their importance in determining education opportunities for children with SEND. 455 Institute for Government interviews.  Surveys of school leaders by Sutton Trust suggest that some schools actively discourage applications from children with SEND, likely because of concerns about league table performance. 456 O’Regan C, Husband-Thompson B and Cullinane C, Selective Inclusion: The interplay of SEND and disadvantage in school admissions, The Sutton Trust, 2026, www.suttontrust.com/wp-content/uploads/2026/03/Selective-Inclusion-1.pdf; The Sutton Trust, ‘Disadvantaged pupils with SEND effectively shut out of high performing schools’, press release, 24 March 2026, retrieved 10 September 2026, www.suttontrust.com/news-opinion/all-news-opinion/disadvantaged-pupils-with-send-effectively-shut-out-of-high-performing-schools; The Sutton Trust, ‘Schools urged to review admissions systems to address inequalities in access’, press release, 30 April 2026, retrieved 10 September 2026, www.suttontrust.com/news-opinion/all-news-opinion/schools-urged-to-review-admissions-systems-to-address-inequalities-in-access

By not considering admissions as part of its inspections, Ofsted does little to counteract any incentives to prioritise attainment over inclusion. This means a school could meet the needs of a small number of children with less significant SEND while discouraging many others from applying, and still be judged ‘inclusive’.

Compared to other Ofsted evaluation areas, schools appear to be performing relatively well on inclusion. In the 2,500 inspections carried out since the framework was introduced, 90% of schools met or exceeded the expected standard for inclusion – higher than the equivalent share for attendance (84%) and achievement (71%). 458 Ofsted, ‘Statistical data set, State-funded school inspections and outcomes: management information’, 30 June 2025, retrieved 10 September 2026, www.gov.uk/government/statistical-data-sets/monthly-management-information-ofsteds-school-inspections-outcomes

However, this headline masks substantial variation between school types and regions. While 35% of schools were judged to be above standard for inclusion, this rose to 55% among special schools and 61% for schools in London. The latter is a particularly stark outlier – the next highest-performing region, the South East, had a much lower 39% of its schools exceeding inclusion expectations.

This pattern is consistent with a wider trend in children’s services, where London tends to achieve stronger Ofsted inspection outcomes than other regions. While the reasons are difficult to disentangle, one interviewee suggested this may reflect the strength of collaboration between boroughs: meeting regularly, sharing good practice and investing as groups. 462 Institute for Government interview.  Previous Institute for Government research has also found that the school funding system delivers more for disadvantaged pupils in London, consistent with suggestions from other interviewees that London does particularly well out of government settlements relative to demand for children’s services. 463 Institute for Government interviews.

Interestingly, however, inclusion judgments do not appear to follow a clear deprivation gradient. The only notable exception is among schools serving the least deprived neighbourhoods, where 6% were judged below standard for inclusion, compared to 9–12% among other schools.

Children with SEND are increasingly disengaged from education

We have previously suggested that monitoring the wellbeing of children with SEND would provide a valuable measure of system performance. DfE’s ‘Parent, pupil and learner voice’ survey gives a snapshot of children’s experiences, but it does not currently provide a reliable time series.* This makes it harder to judge whether the SEND system is moving in the direction the government intends.

The latest data nonetheless shows a clear gap in the experiences of pupils with SEND. In 2025/26, pupils with identified SEND reported lower levels of belonging and enjoyment at schools than their peers. 464 Department for Education, ‘Parent, pupil and learner voice: omnibus surveys for 2025 to 2026’, gov.uk, 26 February 2026, retrieved 10 September 2026, www.gov.uk/government/publications/parent-pupil-and-learner-voice-omnibus-surveys-for-2025-to-2026 Just over three quarters (76%) felt safe at school compared to 90% of pupils without SEND. Fewer than half said they enjoyed coming to school.

* Although designed to show how views and experiences change over time, changes to survey methodology make this difficult.

Absence rates among pupils with and without SEND offer a better sense of how this gap has changed over time. Interviewees have pointed to attendance among pupils with identified SEND as a key indicator of how well the SEND system is working. 467 Institute for Government interviews. High attendance signals that pupils feel safe, supported and able to learn.

In 2024–25, the average primary-aged pupil with an EHCP missed fully a tenth (10.1%) of lessons, up from 7.0% in 2018–19. 468 Department for Education, ‘Official statistics, Pupil absence in schools in England, Academic year 2024/25’, 21 May 2026, retrieved 10 September 2026, https://explore-education-statistics.service.gov.uk/find-statistics/pupil-absence-in-schools-in-england/2024-25 In secondary schools, it jumped even more dramatically, from 8.6% to 16.5% – a near doubling. This means the average secondary pupil with an EHCP now misses nearly a day of school every week, or more than a month of education a year.

Absences among children with no identified SEND have increased by much less. As a result, children with EHCPs now miss more than twice as much school as peers without SEND.

The difference is even sharper among pupils who are least engaged in school: those missing more than half of their lessons, classed as severely absent. In 2024–25, some 13% of secondary pupils with EHCPs missed more than half of school, making them six times as likely to be severely absent as pupils without SEND. 470 Ibid.  The gap is wider still in primary schools: 5% of pupils with EHCPs were severely absent, a rate 15 times higher than that of their peers.

Conclusions and recommendations

Fixing the SEND system is one of this government’s most politically and fiscally pressing public service challenges. And the task is made harder by the fact that, against most of its core objectives, the system is still moving in the wrong direction. EHCP numbers are rising at record rates, funding is increasingly drawn away from prevention, and children with SEND appear to be becoming increasingly disengaged from education.

There is only a narrow window to change this trajectory. Especially given the initial delays to the reform programme – with the consultation launching 19 months after Labour came to power – it is good that Georgia Gould survived Andy Burnham’s first reshuffle to remain as the minister responsible for SEND reform. A fresh start now would not help build trust with schools or parents.

There is, however, more the government could do.* A key priority should be developing better ways to assess whether the reforms are working. For prevention, inclusion and the wellbeing of children with SEND, the government currently has limited measures of progress (or in the case of the first two, clarity on what good looks like). It should first work with frontline services to set out working assumptions for how it understands and applies prevention and inclusion in practice, before setting clear measures of success and collecting the data needed to track progress.

It must also ensure its performance framework for schools strikes the right balance between inclusion, attainment and attendance. While it is legitimate for it to pursue objectives on all three, tensions between them have been a persistent feature of the education system over the past decade so it would be naïve to assume they won’t again. If the government wants schools to behave differently, it must examine whether its accountability frameworks – particularly attainment measures – reinforce, rather than undermine, its ambitions for SEND.

Finally, the government should review its timetable for reducing the system’s reliance on EHCPs. If ministers no longer believe that timetable is achievable, they should either revise it, or strengthen the reforms needed to deliver it. Otherwise, they risk basing both their reforms and spending plans on assumptions that the system cannot deliver.

  • DfE should establish better ways to monitor the reforms’ success
  • It should examine its performance framework for schools to ensure it appropriately balances the tensions between inclusion, attainment and attendance
  • It should review its timetable for reducing the system’s reliance on EHCPs and ensure it has the resources needed to deliver it.

* For a full list of recommendations, see Joining up SEND.

Funding

Per-pupil funding has increased substantially, but SEND pressures are absorbing much of the gain

Schools are being asked to deliver an exceptionally crowded reform agenda. Alongside the priorities discussed in this report, they are due to implement curriculum reform, adapt to a new Ofsted inspection framework, and are helping to deliver the government’s ambition for 75% of five-year-olds to reach a ‘good level of development’ by 2028. At the same time, because funding is largely determined on a per-pupil basis, falling pupil numbers are also likely to put school finances under strain, with many schools left maintaining the same buildings and sometimes employing the same number of staff on smaller budgets.

The greatest pressure on budgets, however, will come from SEND. In its 2024/25 annual report, DfE identified SEND cost pressures as one of the biggest risks to delivering its objectives, 476 Department for Education, Consolidated Annual Report and Accounts, 17 July 2025, https://assets.publishing.service.gov.uk/media/687794132bad77c3dae4dc67/DfE_consolidated_annual_report_and_accounts_2024_to_2025__web-optimised_versi…  while the Office for Budget Responsibility has repeatedly expressed concerns about the risk they post to its economic and fiscal forecasts. 477 Office for Budget Responsibility, Economic and Fiscal Outlook March 2026, The Stationery Office, 2026, https://assets.publishing.service.gov.uk/media/69a6d7b62e1f4fbda4252208/economic-and-fiscal-outlook-march-2026-web-accessible.pdf  And while staff capacity to deliver the reforms is largely unknown, many of the primary concerns about them relate to whether they are deliverable.

Against this backdrop, the Labour government has provided substantial increases to school funding. When it took office in 2024/25, per-pupil funding stood at £8,300 in 2026/27 prices – 5.0% higher in real terms than what it was in 2010/11. 478 Department for Education, ‘Official statistics, School funding statistics, financial year 2025-26’, 29 July 2026, retrieved 10 September 2026, https://explore-education-statistics.service.gov.uk/find-statistics/school-funding-statistics/2025-26  It then increased funding by 3.8% in real terms in 2025/26, at the time the largest year-on-year rise since the time series began in 2010/11.

Although the 2025 spending review initially implied slower growth over the remainder of the parliament, the government has since topped up the schools budget twice: first with an additional £3.5bn for high needs for 2028/29, 479 HM Treasury, Spending Review 2025, CP 1336, The Stationery Office, June 2025, www.gov.uk/government/topical-events/spending-review-2025  and then through grants to help schools cover the cost of staff pay increases, worth £700m in 2026/27 and £1.1bn in 2027/28 (all in cash terms). 480 Department for Education, ‘Teacher pay: everything you need to know about the latest multi-year pay award’, The Education Hub, 16 September 2026, https://educationhub.blog.gov.uk/2026/09/teacher-pay-everything-you-need-to-know-about-the-latest-multi-year-pay-award; Chantler-Hicks L, ‘Government ‘commits to fully funding’ teacher pay rise, NEU reports’, Schools Week, 16 September 2026, https://schoolsweek.co.uk/government-commits-to-fully-funding-teacher-pay-rise-neu-reports

But much of this additional funding is devoted to meeting SEND pressures. The government has announced £4 billion (cash terms) for the SEND reform programme between 2026/27 and 2028/29, most of which is expected to come from schools’ budgets.* Excluding this funding, per-pupil funding would rise by 11.9% over the parliament rather than 14.4%.

This also overstates the resources available to schools for their wider priorities. As discussed above, growing SEND pressures are absorbing an increasing share of school budgets. Once high-needs funding is excluded, we estimate that per-pupil funding rises by 5.1% over the parliament, though that is still equivalent to the rise over 14 years of allocations under the Conservatives.**

Greater funding has not been matched by greater certainty. Although the 2025 spending review set departmental budgets through to 2028/29, schools themselves continue to receive funding allocations only one year at a time.*** This leaves school leaders trying to deliver several long-term priorities while planning on an annual budget cycle. Many other departments, by contrast, have passed the multi-year settlement down to services, with local government, crown courts and the NHS now able to take a longer-term view of their finances.

  • DfE should introduce multi-year funding settlements for schools, allowing leaders to plan more strategically and invest with greater confidence in the programmes they are being asked to deliver.

* The Office for Budget Responsibility wrote in March 2026 that “The Treasury has stated that the additional new spending commitments in the White Paper in the Spending Review period will come from previously unallocated funding, which was set aside within the 2025 Spending Review core schools settlement”. See Office for Budget Responsibility, Economic and Fiscal Outlook March 2026, The Stationery Office, 2026, https://assets.publishing.service.gov.uk/media/69a6d7b62e1f4fbda4252208/economic-and-fiscal-outlook-march-2026-web-accessible.pdf
** See the Methodology for details of these calculations.
*** Though Bridget Phillipson, the former education secretary, set a precedent by asking the School Teachers’ Review Body for formal recommendations for 2026/27 and 2027/28, as well as an indicative recommendation for 2028/29. Agreeing longer term pay settlements provides greater certainty for teachers and schools, and other ministers should follow suit.

Moving towards a trust-led system

In its schools white paper earlier this year, the Starmer government announced its intention that all schools should become part of trusts. 487 Department for Education, ‘Every child achieving and thriving’, gov.uk, 27 April 2026, retrieved 10 September 2026, www.gov.uk/government/publications/every-child-achieving-and-thriving/every-child-achieving-and-thriving-html-version#technical-annex-our-aspiration-…  It was not one of the paper’s headline announcements, and it would be easy for Burnham’s government to quietly let the pledge fall away. Indeed, a similar commitment made by Boris Johnson’s government in 2022 488 Department for Education and Baronness Barran, ‘Next step towards a stronger school system with all schools in strong trusts’, press release, gov.uk, 25 May 2022, retrieved 10 September 2026, www.gov.uk/government/news/next-steps-towards-a-stronger-school-system-with-all-schools-in-strong-trusts  was gradually sidelined once Rishi Sunak took over later that year.

But behind this easily overlooked announcement lies a much more fundamental question, which is one of the biggest unresolved issues in English education policy: what structure does the government want the school system to have?

This is a particularly important question for Burnham’s government. England currently has no coherent model or geography of school governance. Yet, in its first few weeks in office, the Burnham administration made clear that aligning public service geographies was a priority, to help different services work together “as a single coherent system” – an approach that we strongly support. 489 Cabinet Office, ‘Rewiring the state – Cabinet statement’, Gov.uk, 31 July 2026, retrieved 10 September 2026, www.gov.uk/government/publications/rewiring-the-state-cabinet-statement/rewiring-the-state-cabinet-statement-html  It has explicitly acknowledged the implications of this ambition for strategic authority, health, local authority, police force and fire and rescue service boundaries, but has yet to say what it might mean for schools.

With so many structural reorganisations under way across public services (in police, local government, health – for example), the government has a limited window to decide how schools fit into this new public service landscape before those decisions are made without them.

The question of structure also matters because many of the government’s wider education priorities – particularly those in the SEND system – require a level of co-ordination infrastructure that does not currently exist in the school system. As one interviewee put it, these reforms “require systemic collaboration that is rooted in more than just [the] goodwill of the headteacher at the time being mates with the school down the road”. 490 Institute for Government interview. If the government is serious about joining up public services, it will need to decide not just what schools should do, but what structures will enable them to do it.

There is no coherent model of school governance in England

The Starmer government’s announcement on trusts* is part of a long journey in English education, which has seen power gradually move away from local authorities and towards more autonomous groups of schools. The journey began with reforms in 1988 that gave schools greater independence from their local authorities, and accelerated after 2010 when Michael Gove, as secretary of state for education, opened the route for all schools to convert to academy status.

Four decades on, trusts have become the dominant vehicle for organising schools. At the start of 2026, just over half of state-funded schools were academies (55%), including 84% of secondary schools and around half of primary schools, special schools and alternative provision.**, 491 Gov.uk, ‘Get information about schools’, (no date), retrieved 10 September 2026, https://get-information-schools.service.gov.uk  Together, these schools educate almost two-thirds of children in state-funded schools (65%). 492 Department for Education, ‘Official statistics, Schools, pupils and their characteristics’, gov.uk, 14 July 2026, retrieved 10 September 2026, https://explore-education-statistics.service.gov.uk/find-statistics/school-pupils-and-their-characteristics/2025-26

* The Starmer government did not elaborate on what it meant by ‘trust’. Academies are not the only type of school which can be in trusts, but they make up the vast majority of schools in trusts and there have been no openings of foundation schools (the other type of school in trusts) since 2014. As such, analysis on trusts in this section focuses exclusively on academy trusts.
** Excludes nurseries.

But the growth of trusts has not been guided by a clear vision of the school system as a whole. Its current structure is not the result of any blueprint, but has instead evolved haphazardly through decades of accumulated reform. Some have argued that academisation improves school outcomes* and make the system more cost efficient** – although evidence for these claims is limited. 495 FFT Education Datalab, What data can and can’t tell us about the impact of MATs on student outcomes’, FFT Education Datalab, July 2026, https://ffteducationdatalab.org.uk/wp-content/uploads/2026/07/FFT-MAT-Briefing-FINAL.pdf; Andrews J, ‘Understanding school revenue expenditure | Part 6’, Education Policy Institute, March 2020, https://epi.org.uk/publications-and-research/back-office  As an Institute for Government report observed in 2022:

“There has been a commitment to academisation but with little clarity as to the ends it is supposed to be achieving, or explanation of how it links to the wider goal of school improvement... Academies were originally envisioned as a small project to create high-profile beacon schools in disadvantaged areas, but over time have drifted to become the governance model for almost half of all schools.”

The result is not a coherent model of school governance, but a wonky patchwork of trusts that differ widely in size and geographic footprint.
* There is not much evidence that schools within trusts outperform others, although this does not prove that trusts have no effect on educational outcomes. Trusts have taken on most of England’s historically worst performing schools, making it difficult to separate the effect of the trust from the circumstances of the schools involved.
** The argument is that, by joining together, schools can pool administrative functions and coordinate activity. While differences in how local authorities and trusts record spending make direct comparisons between school structures difficult, the core test is whether getting bigger actually makes schools cheaper to run. And research from the Education Policy Institute suggests it does not: Andrews J, ‘Understanding school revenue expenditure | Part 6’, Education Policy A, March 2020, https://epi.org.uk/publications-and-research/back-office. There is, however, evidence that trusts are better able to weather financial pressure. By pooling resources, they are able to spread financial risk more evenly and cross-subsidise schools facing financial difficulties. As a result, multi-academy trusts are more likely than other school types to end the year with a positive balance. See: Hodge L, Cruikshanks R, Andrews J and Gavriloiu O, The Features of Effective School Groups, Education Policy Institute, April 2024, https://epi.org.uk/publications-and-research/the-features-of-effective-school-groups/

Trusts are becoming larger on average, but there is still a lot of variation in size 

Over the last decade, trusts have steadily become larger. In 2026, the average trust contained 5.7 schools, up from 1.9 in 2016. 496 Gov.uk, ‘Get information about schools’, (no date), retrieved 10 September 2026, https://get-information-schools.service.gov.uk  Much of this reflects the decline of single academy trusts, which have halved in number over the past decade. Once accounting for three quarters (76%) of all trusts, they now make up less than half. At the other end of the spectrum, the number of trusts with more than 10 schools has increased almost eightfold.

Some of this consolidation has been encouraged by government, but not mandated by it. The Johnson administration promoted larger trusts as the most sustainable way to share staff and resources, without requiring schools to join them. 502 Department for Education, ‘Opportunity for all: strong schools with great teachers for your child’, gov.uk, 28 March 2022, retrieved 10 September 2026, www.gov.uk/government/publications/opportunity-for-all-strong-schools-with-great-teachers-for-your-child  The funding system nudges in the same direction: only trusts with at least five schools and 3,000 pupils 503 Department for Education, ‘Guidance, School capital funding’, 4 April 2019, retrieved 10 September 2026, www.gov.uk/guidance/school-capital-funding  are able to access the school conditional allowance, which provides guaranteed and more flexible capital funding. Smaller trusts must instead compete for capital funding through the condition improvement fund, which is more tightly controlled by DfE.*, 504 Ibid.

But consolidation is also being driven by factors unrelated to any national strategy for organising schools. With falling pupil numbers putting some schools at risk of closure and local authorities unable to direct academies to close, some Catholic dioceses have moved their schools into their own multi-academy trusts as a way of securing the schools’ future. Analysis by trade publication Schools Week in 2024 suggested that all but one of the 19 English Catholic dioceses were pursuing trust growth plans. 505 Dyson J, ‘Don’t rush to create biblical MATs, Catholic dioceses told’, Schools Week, 6 December 2024, https://schoolsweek.co.uk/dont-rush-to-create-biblical-mats-catholic-dioceses-told  By 2026, faith trusts made up around a third of England’s 99 largest trusts (those with more than 21 schools), compared to roughly a quarter in 2020. 506 Gov.uk, ‘Get information about schools’, (no date), retrieved 10 September 2026, https://get-information-schools.service.gov.uk

* This logic has not been consistently applied across the school system. The National Audit Office has highlighted that some local authorities now oversee fewer than five schools so that, if they were MATs, they would be eligible for the condition improvement fund rather than the school conditional allowance. Earlier this year, the Starmer government announced plans to replace the condition improvement fund “to make it easier for eligible Responsible Bodies to access this maintenance funding”. See Comptroller and Auditor General, Condition of School Buildings, Session 2022–23, HC 1516, National Audit Office, 2023, www.nao.org.uk/wp-content/ uploads/2023/06/condition-of-school-buildings.pdf; Department for Education, Education Estates Strategy, CP 1501, The Stationery Office, 2026, p.6.

Trusts are getting larger on average, but they are not converging on a common organisational model. While 8% of schools in trusts are still in single academy trusts, 27% are in trusts with more than 21 schools, with one trust containing close to 100 schools.*

* Data is as of January 2026.

Trusts are becoming more geographically coherent, but there is no single model 

The last decade has also seen trusts become more geographically concentrated. Since 2016, schools within trusts have generally gotten closer together, with the biggest shift among trusts with more than 21 schools. The average distance between schools in these trusts more than halved, falling from 106km in 2016 to 45km in 2026. 508 Ibid.

One interviewee working in the sector suggested that the original pattern of geographical distance was not the result of a deliberate strategy, but instead emerged from the way the system evolved. 512 Institute for Government interview.  In the early years of trust growth, when there were fewer established trusts and more schools were academising because of poor performance, trusts were more likely to take on schools further from their existing base. 513 Institute for Government interview. As the sector has matured, more schools have been joining trusts because of strategic fit, including alignment in values and approaches, and not because of poor performance. 514 Institute for Government interviews.  At the same time, the proliferation of academies has given schools more local options, making it easier for them to find a suitable trust without looking further afield.

Despite this trend, there is still a lot of variation between trusts’ geographic footprints. The system now includes both tightly clustered local groups and national organisations spanning hundreds of kilometres. One trust with six schools has schools an average of 270km apart – the widest dispersion of any trust in the country – while another with five schools has schools just 0.7km apart on average. Even among large trusts, the range is striking: 15% of trusts with more than 21 schools have schools an average of 15–20km apart, while 23% have schools separated by 60km or more on average.
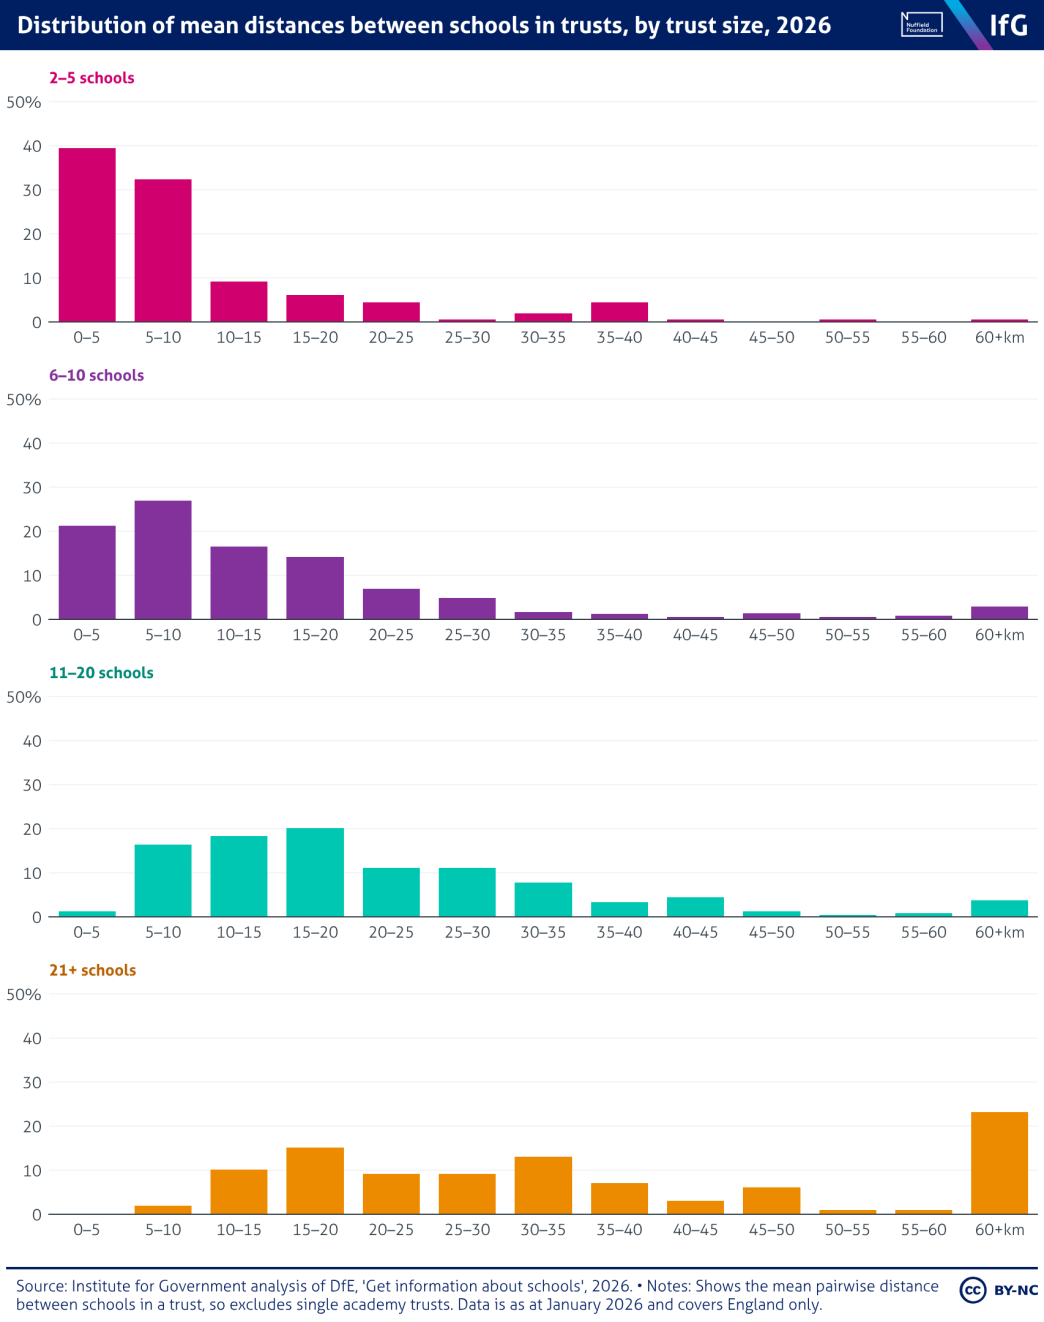
A small multiple column chart from the Institute for Government of distribution of mean distances between schools in trusts, by trust size, 2026, where most trusts of 2–5 schools average under 10km, while trusts of 21 or more vary widely, with 23% averaging 60km or more.

The extent to which different models coexist is clear from the map below, which shows four large trusts with very different geographic footprints. One (in pink) has 28 schools clustered in Manchester, with schools an average of 8km apart. Another, with 63 schools, follows the boundaries of the Catholic Archdiocese of Birmingham, with schools 28km apart on average (in blue). A trust of the same size (in purple) operates across a wider regional footprint, with schools 56km apart, while the country’s largest trust, with 95 schools at the start of 2026, operates on a national basis, with schools an average of 162km apart.

Burnham’s government needs a vision for the structure of the school system

The Burnham government’s ambition is to create a “single coherent system [of public services] built around the priorities of people and places”. 520 Cabinet Office, ‘Rewiring the state – Cabinet statement’, Gov.uk, 31 July 2026, retrieved 10 September 2026, www.gov.uk/government/publications/rewiring-the-state-cabinet-statement/rewiring-the-state-cabinet-statement-html  To achieve this it intends to align the footprints of public services, 521 Ibid.  arguing that mismatched boundaries make it harder for services to work together and for power to be devolved effectively.

As the government rethinks public service structures, the school system needs serious thought – not just because it is a key public service, but also because its current structure is further from this vision of coherence than most. Few public services currently have coterminous boundaries but, unlike most other services, the school system does not even have a consistent organising structure of its own. As we have shown, some groupings of schools are run by trusts, others overseen by local authorities; some span the whole country, others a single neighbourhood; some contain one school, others nearly 500.

This makes the system especially difficult to govern. Every time DfE wants to alter schools policy, it must navigate different funding mechanisms and legislative frameworks. It also makes it harder to establish consistent expectations for school groups, with the capacity for and approach to functions such as school improvement varying considerably between groups of different sizes and types. 522 Institute for Government interview.  And, as last year’s Performance Tracker highlighted, fragmented governance has also made it harder for frontline services to manage issues such as school place planning.

The question of structure also matters because the government’s wider education priorities require a level of co-ordination infrastructure that, simply put, does not currently exist in the school system. This is particularly true of SEND reform, which depends on schools working closely with local services to identify needs, share resources and provide support. Equally, if education funding for 16–19 year-olds is devolved to strategic authorities as planned, 523 Statement from the Cabinet, 31 July 2026,https://assets.publishing.service.gov.uk/media/6a6c7acf0ddb7e4831c62abd/REWIRING_THE_STATE_-_CABINET_STATEMENT.pdf many schools will need to have a relationship with their mayor for the first time.

Conclusions and recommendations

The Burnham government should develop a clear long-term vision for how the schools system should be structured, including a view on which functions should be controlled locally, by whom, and which would benefit from being controlled or delivered at scale.

As part of this, the government will need to think carefully about the role of local authorities. One opportunity presented by rethinking the structure of the education system is to create a clearer division between schools, and those providing local oversight. Under a fully trust-led model, for example, local authorities would no longer maintain schools, but could retain an important role in coordinating their local education systems – particularly in areas where an independent body is needed to act in the interests of the local community.

This could include responsibilities such as admissions, school place planning, oversight of exclusions and an area’s approach to inclusion, and ensuring children who are not in school receive the support they need. Several interviewees viewed this model as a key benefit of a fully trust-led system – simplifying accountability and helping to resolve issues where the absence of a neutral commissioning body creates inefficiency (such as school place planning, as mentioned above). 524 Institute for Government interviews.

Ideally, this vision, whatever it is, would provide the basis for a redesign of the schools system, making it more coherent rather than attempting to move it incrementally towards the desired model through additional layers of bureaucracy. Doing the latter risks creating a system that is increasingly complex and difficult to navigate, while making accountability less clear.

This is currently a risk presented by a proposal in the government’s SEND reforms to group local schools together in clusters, so they can work together to improve local SEND provision. One key outstanding question is how school trusts fit into this picture.

Under the current set up, many trusts would sit across dozens of school clusters, each with different priorities, commissioning practices and inclusion strategies. This risks muddying accountability. Responsibility for SEND provision and inclusion would become harder to attribute in trust-led schools, as both trusts and clusters take relevant decisions.

The disruption involved in a wholesale restructuring of the school system may, however, make it a politically unattractive or an impractical option. But that should not stop the government from setting out where it wants the school system to end up. Even if the government does not redesign the school system, a clear vision of how it should be structured would still help to guide other important decisions.

For example, the government could take this vision into account when making decisions about the future footprint of other public services, so that the implications for the school system are considered from the outset rather than as an afterthought. It could also use the vision to inform decisions about the future shape of the trust sector, including which schools convert to academy status and which trusts they join, helping to shape the size and geographic concentration of trusts over time.

  • The Burnham government should develop a clear long-term vision for how the schools system should be structured including a view on which functions should be controlled locally. It should use that vision to inform its decisions about the future footprint of other public services, and about the future shape of the trust sector. It could also use the vision to redesign the schools system around a more coherent model.

This report is published in partnership with the Nuffield Foundation.
Nuffield Foundation logo

Related content