Devolved public services
Since their creation in 1999, the devolved governments have chosen to fund and run public services in very different ways.


The demands placed on health care and social care are influenced by the demographic and socioeconomic background of the populations in the four nations.
Health and care context
The demands placed on health care and social care are influenced by the demographic and socioeconomic background of the populations in the four nations, and the innovations in treatments and diagnostics available to treat illnesses. The four nations have very different populations, and Scotland, Wales and Northern Ireland have higher average needs for health care than England.[1] Overall, Wales appears to have the highest average health needs and England the lowest. All else being equal, the three devolved nations have to do more to improve health performance, such as reducing waiting times or mortality rates.
This is partly because London and south-east England are very different from the rest of England: the people there are younger, in better health, and have higher incomes. For this reason, we compare the three devolved nations to the North East of England where possible, as the population there is more demographically and socioeconomically similar to the other nations than the rest of England[2] (the region’s health needs appear to be most similar to Wales’s).[3] Comparing the North East and the devolved nations allows us to better identify the effects of differences in policy, isolated from differences in the populations.
The following analysis tracks changes in demographic and socioeconomic factors in the four nations up to March 2020, the start of the pandemic.
Populations are ageing in all nations, and Wales has the oldest population
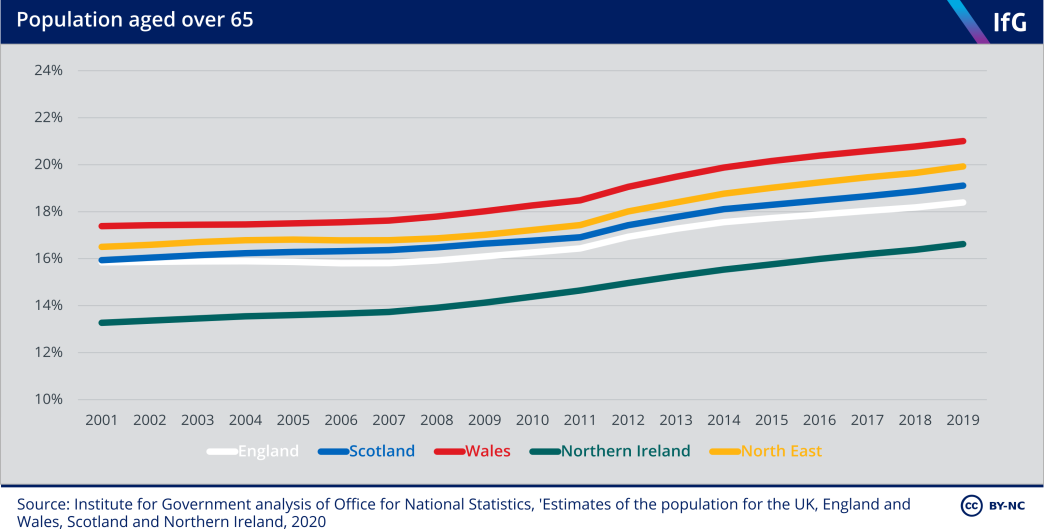
Age is one important factor in a person’s health and care needs.[4] Populations are ageing in all four nations, increasing the need for health and care services.* In 2011/12 the Department of Health estimated, for example, that the NHS spends on average 2.6 times as much on someone aged 65–69 as on someone aged 30–34; the multiple is 7.2 times for someone aged 85 or older.[5]
Wales has the oldest population, and Northern Ireland the youngest – partly driven by Northern Ireland’s high birth rate during the 2000s,[6] and Wales being largely rural.[7] Scotland and England fall in the middle: a greater fraction of Scotland’s population is aged 65 and over than England’s, but England has a larger share of the very elderly – that is, people aged 85 and over. North East England has a higher proportion of people aged over 65 than Scotland or England, making it more comparable to Wales.
*Although the ageing population has not been a major driver of higher health spending over the last 20 years; this has mostly been other rising costs such as new drugs, medicines, and therapies, Licchetta M and Stelmach M, Fiscal sustainability and public spending on health, Office for Budget Responsibility, September 2016, https://obr.uk/docs/dlm_uploads/Health-FSAP.pdf
Scotland has the sparsest population
Table 2.1 Population estimates and population density (2019)
England |
Scotland |
Wales |
Northern Ireland |
North East England |
|
|---|---|---|---|---|---|
| Population | 56,286,961 | 5,463,300 | 3,152,879 | 1,893,667 | 2,669,941 |
| People per sq km | 432 | 70 | 152 | 137 | 311 |
Source: Institute for Government analysis of Office for National Statistics, ‘Estimates of the population for the UK, England and Wales, Scotland and Northern Ireland’, 2020
Sparsely populated areas mean higher costs for providing public services.[8] All else being equal, it costs more to provide services when governments have to provide multiple facilities (such as numerous small GP practices distributed across spread out villages). England has a significantly higher population density than the other three nations, while Scotland has the lowest.
Wales has the highest proportion of people with a disability
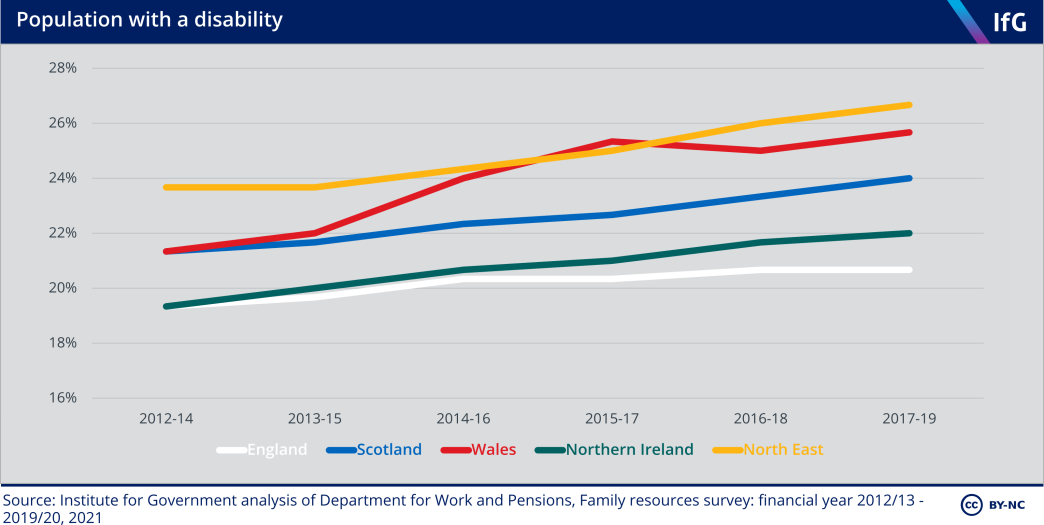
Disability is another important factor in health and care needs: people with a disability have higher care needs on average.[9] Wales has the highest prevalence of disability among the four nations. The increase since 2012 reflects the population ageing, as older people are more likely to have a disability,[10] but also an increase in the number of working-age adults with a disability.[11]
Obesity and smoking are similar in the four nations
Age and disability are not the only determinants of need. Lifestyle factors – behaviours that affect health such as diet and smoking – also matter, though they are similar in the four nations.
Rates of obesity in the four nations were similar (ranging from 25% in Wales to 29% in Scotland) in 2019/20,[12]* and the proportion of the population who smoke has been declining since the 1990s, and is now at similar rates in the four nations.[13]
*The North East, however, has a notably higher prevalence of obesity (34%).
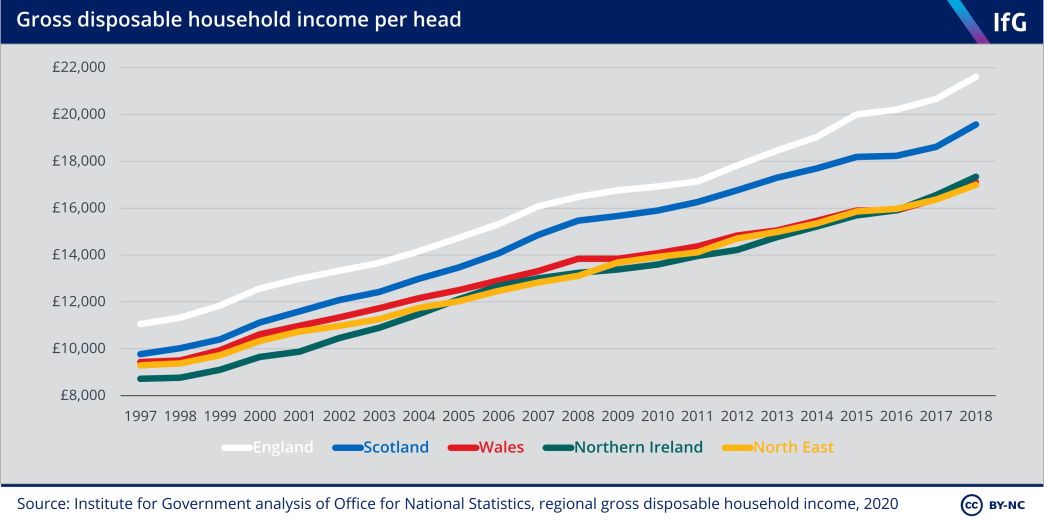
England has the highest income per person
Environmental, social and economic circumstances also influence people’s health. The conditions people live in – the adequacy of housing and day-to-day stresses they encounter – are some of the most important determinants of health.[14]
Disposable household income is one important determinant of health. High incomes allow people to buy goods and services that improve health; in addition to being less able to access these, low incomes can also reduce participation in social life, reducing feelings of self-worth and status.[15] England has the highest income per person among the four nations, mostly owing to London and the south-east. The North East has the lowest income per person of the nine English regions, and is very similar to Wales and Northern Ireland.
Private spending on health care is similar in all four nations
The amount of care people pay for differs across the four nations. People in England spend slightly more on private health care than in the other nations, but spending is low in all four nations.
Four fifths of health and care spending in the UK is paid for by the state (78% in 2018) with the remaining fifth made up of care purchased by individuals (17%) and the amount that employers and individuals spend on health insurance (3%).[16] Health insurance coverage is slightly higher in England than in the devolved nations[17] but most insurance is not comprehensive[18] (with many long-term and resource-intensive treatments not covered).
On average, English households spend £16–68 more per year on ‘hospital services’ (including dental care and private care), and £63–78 more per year on insurance premiums[19] than households in Scotland, Wales and Northern Ireland. Households in England also spend £15–36 more per year on medicines and prescriptions – although a large part of this will be because Wales, Northern Ireland and Scotland removed prescription charges in 2007, 2010, and 2011 respectively.[20]
Overall, we consider the differences between the nations are small enough not to seriously alter the demands the NHS faces in each nation.
Scotland has the highest mortality rate
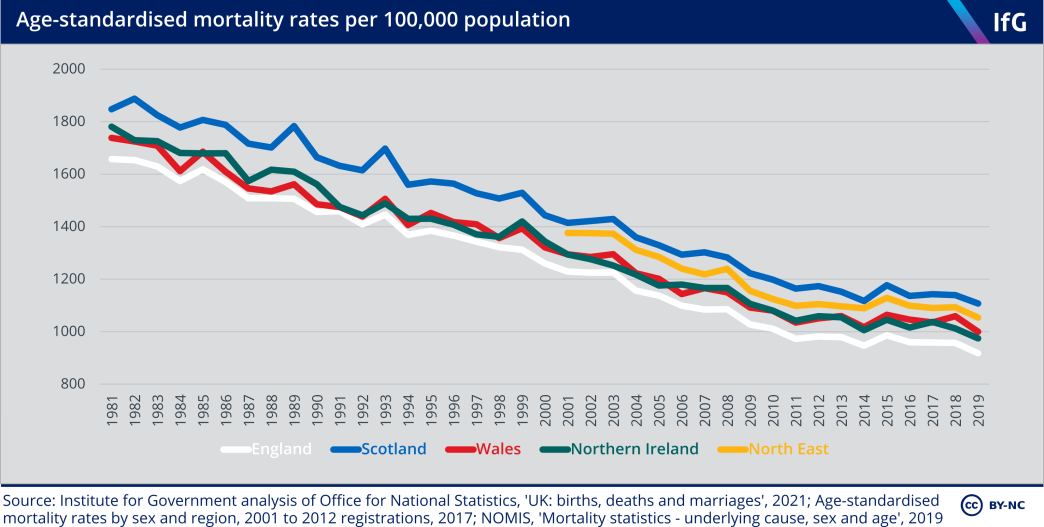
Annual age-standardised mortality rates show the number of people dying each year, adjusted for different population age structures to allow fair comparison over time and between places. A higher mortality rate is one indication of higher underlying needs.[21]
Scotland has consistently had higher mortality since at least the 1950s,[22] but the trends in the four nations were very similar before and after devolution. Owing to improvements in treatments for heart disease and stroke and reductions in smoking, among other factors, mortality steadily declined from 1981 to 2011, but has since declined much more slowly – a pattern also evident in similar European countries.[23] The slowdown is caused by a range of factors including steep spending cuts in the years following the 2008 financial crisis, multiple bad winter flu outbreaks in the 2010s, and increases in Alzheimer’s and dementia.[24]
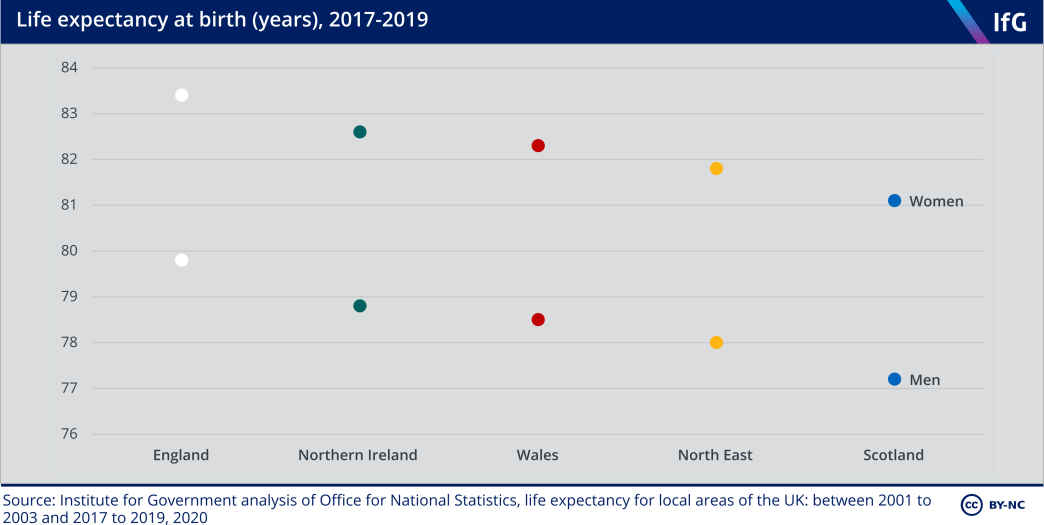
The differences in life expectancy at birth in the four nations mirrors the differences in age-standardised mortality rates. In 2017–19, England had the highest life expectancy at birth, and Scotland the lowest.
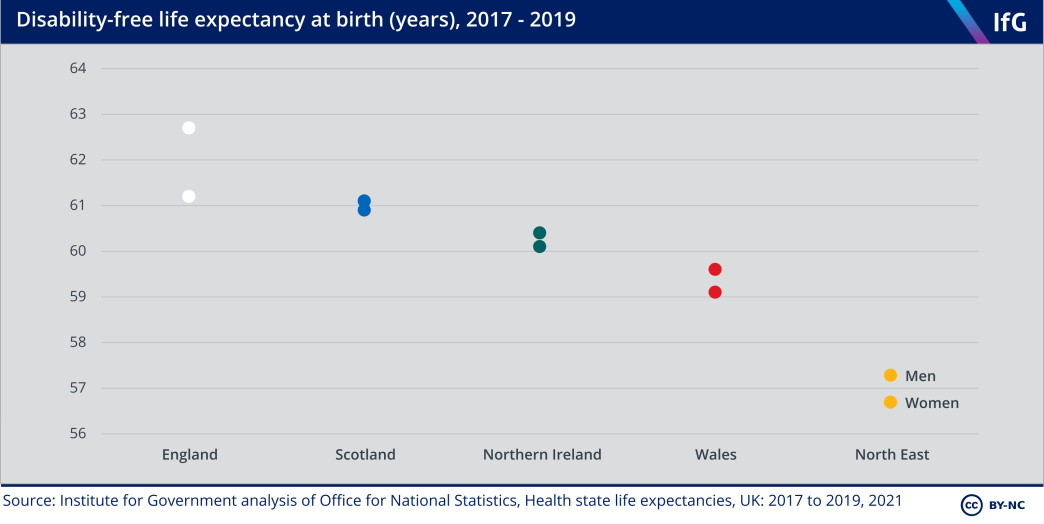
Disability-free life expectancy – how long people can expect to live without a limiting long-term illness – shows a slightly different pattern. A lower disability-free life expectancy is likely to be associated with higher needs, as people develop disabilities requiring health and/or care services at earlier ages. England, again, performs best on this metric, and people in England can expect to live the longest without a disability.

The three devolved administrations spend more per person on health than England.
NHS
The three devolved administrations spend more per person on health than England. This is because the way that the UK government allocates their budgets – using the Barnett formula – preserves the higher level of overall spending per person set when the formula was established in the late 1970s.[1] Scotland spends more on health than it would if all UK health spending were allocated according to need. The opposite is true in Wales.
In the 20 years since devolution, the four nations have made different policy choices about how to run their health services. England made extensive use of targets and public accountability in the early 2000s as part of the Blair government’s public service reforms, and increasingly emphasised market-like mechanisms thereafter. The three devolved nations put less emphasis on targets and public accountability, and Scotland and Wales removed the NHS purchaser-provider split* in the 2000s. In the 2000s waiting times for elective care and ambulance response times improved faster in England than in the other three nations, though Scotland and Wales later made greater use of targets.
Despite the intentions of the 2012 health reforms in England that aimed to enhance competition in the English NHS, there was greater policy convergence in the 2010s, with all nations encouraging collaboration and integration between the NHS, social care and local government.
But in the same decade waiting times for A&E and elective care grew longer across the UK as the four governments restrained increases in health spending. It is difficult to compare performance now owing to a lack of truly comparable data, but it is clear that England and Scotland have notably better performance on waiting times than Wales and Northern Ireland.
Overall health outcomes in the four nations have changed in similar ways. Treatable mortality – deaths that can be avoided through timely and effective health care interventions – and life expectancy in the four nations have changed in similar ways since devolution.
* The purchaser/provider split refers to the practice whereby a commissioning organisation purchases services from the NHS or independent providers of health care. It was introduced in the UK in 1991.
The NHS in the four nations
This chapter assesses the NHS in each nation, from devolution to the start of the pandemic. It does not cover public health services or wider health services.*
The NHS was the largest area of public spending devolved to Scotland, Wales and Northern Ireland in 1999. Day-to-day health care spending represents around a quarter of total current spending in each nation, although England spends slightly more of its budget on health (26%) compared to Scotland (23%), Wales (23%) and Northern Ireland (22%).[2]
Each government has chosen to run its health care system differently since devolution, but by international standards the four health systems are very similar – publicly funded, centrally managed, and free at the point of use. There was greater policy convergence in the 2010s, as all four nations have sought to find ways to encourage collaboration and integration between health and social care services.
Table 3.1 Policy differences as of 2020
|
|
Purchaser/provider split |
Commissioning organisation(s) |
Payment by activity |
Foundation trusts* |
Administrative integration between health and social care |
|---|---|---|---|---|---|
| England | Yes | NHS England and clinical commissioning groups (CCGs) | Yes | Yes | Integrated care systems (proposed)[3] |
| Scotland | No | N/A | No | No | Integration authorities |
| Wales | No | N/A | No | No | Regional partnership boards (under consultation)[4] |
| Northern Ireland | Yes |
Health and Social Care Board (being phased out)[5] |
No | No | Fully integrated health and social care |
* We define public health as services designed to prevent disease, promote health and extend life among the population as a whole, such as local authority smoking cessation services. We define wider health services as services that affect people’s health and wellbeing, such as housing policy.
** Foundation trusts are health care trusts with greater financial and managerial autonomy, including being accountable to a board of governors rather than the health secretary, greater freedoms about how to spend money and greater flexibility in staff pay and management.
England
England managed the NHS differently after the Blair government’s decision to increase UK health care spending to the European average in the 2000s.[6] The white paper published in 2000[7] tied higher funding to NHS reform,[8] including targets for elective surgery waiting times[9] and for all patients to be seen within four hours of arriving at A&E. This became known as the ‘targets and terror’,[10] and later ‘naming and shaming’,[11] approach to managing the NHS.
The white paper argued that poorly performing hospitals were too often given extra funding, while hospitals that performed well were given less funding, and concluded that “the current system penalises success and rewards failure”.[12] Aiming to ensure that higher funding resulted in better performance, the government put targets in place, and after 2001 scored NHS organisations between zero and three stars each year. Poor performance resulted in sanctions, reputational damage and occasionally sacking chief executives.[13],[14] Good performance resulted in rewards – high-performing hospitals could become foundation trusts, with greater autonomy from direct government control – a policy not introduced in the devolved nations.[15] The combination of higher funding and public targets had some success in reducing waiting times (see ‘NHS performance’ section below).
The New Labour government put more emphasis on user choice and provider competition to improve services after 2005, when star ratings were removed.[16] England developed the health care quasi-market established in the 1990s by introducing a tariff payment system known as ‘payment by results’, making greater use of the private sector (encouraging privately run independent sector treatment centres to compete with publicly run NHS trusts to provide elective surgeries),[17] and allowing patients to choose where they received secondary care,[18] which came into full operation in 2006.[19]
The coalition government continued in this direction while Andrew Lansley was secretary of state for health. The Health and Social Care Act 2012[20] strengthened and made explicit the role of competition within the NHS, by creating an independent commissioning board (which later became NHS England) and GP-led clinical commissioning groups (CCGs).[21] The 2012 Act was complex and controversial, and there is a widespread perception that it did not create an effective market in the NHS.[22]
In contrast Lansley’s successor, Jeremy Hunt, prioritised safety and quality during his time as health secretary (2012–18),[23] by strengthening the role of the Care Quality Commission (CQC) in inspections and regulation.[24] The CQC’s influence in England is much greater than its counterparts in the devolved nations, which have less authoritative inspectors and regulators.[25]
Under both Hunt and his successor and current postholder, Matt Hancock, England has put increasingly less emphasis on user choice and provider competition to improve services.[26] NHS England’s Long Term Plan, published in 2019, emphasised integration and ‘integrated care systems’, which would encourage NHS providers, commissioners and local authorities to collaborate.[27] A 2021 government white paper titled Integration and Innovation[28] in effect proposes to reverse some of the changes made in the 2012 Act.[29]
Scotland
In contrast to England, Scotland placed greater emphasis on partnerships between health and social care providers, and less on competition and the private sector, in the 2000s.[30] It removed the internal market in 2004 by abolishing NHS trusts and the purchaser/provider split. The Scottish government combined acute and primary services in 15 health boards in 2000[31] and created ‘community health partnerships’ in 2004. The latter were designed to improve integration between health and social care – an early example of integration that became a key goal in the 2010s.[32]
Higher health spending in Scotland was not explicitly linked to reform, and in the early 2000s Scotland did not use a stringent performance management system. It did, however, move closer in 2006 through ‘Health Improvement, Efficiency, Access and Treatment’ (HEAT) targets – which set specific targets for health boards – and local delivery plans, designed for the government to hold health boards accountable. The targets did not have explicit sanctions or rewards, but performance was publicly reported, as in England.[33]
Scotland’s strategy to improve quality of care and patient outcomes differs to that of the other three nations.[34] It has a long-standing relationship with the Institute for Healthcare Improvement in Boston in the US, which helped design and run the Scottish Patient Safety Programme from 2008. In contrast to the primarily centralised change programmes in England, Scotland uses “a model of small-scale testing and revision of new quality improvement initiatives, and a relatively informal approval and expansion of initiatives”.[35]
Scottish health policy since devolution has been remarkably stable, despite the change in political control at Holyrood in 2007, in contrast to near-constant change in English health policy.[36] Scottish policies emphasised collaboration in both the 2000s and 2010s,[37] although health and social care have been administratively integrated only since 2016.*
* In 2016 Scotland replaced community health partnerships with 31 integration authorities, which had a wider range of powers. See Dayan M and Edwards N, Learning from Scotland’s NHS, Nuffield Trust, July 2017, retrieved 22 February 2021, retrieved 22 February 2021, pp. 22–24, www.nuffieldtrust.org.uk/files/2017-07/learning-from-scotland-s-nhs-final.pdf; Timmins N, The four UK health systems: Learning from each other, The King’s Fund, 2013, retrieved 22 February 2021, p. 11, www.kingsfund.org.uk/sites/default/files/field/field_publication_ summary/four-uk-health-systems-jun13.pdf
Wales
Like Scotland, Wales neither used stringent performance management, nor sought to increase competition in the early 2000s.[38] It instead aimed to improve services through “more co-ordination between providers”,[39] and Wales’ first unique devolved health policy document in 2001 aimed to improve broader public health services.[40] A focus on public health and preventative measures have been a distinctive feature of Welsh health policy since devolution.
In the early 2000s, the Wanless review (2003) and the Auditor General for Wales (2005 and 2006) reported that Welsh hospitals were facing severe pressure, partly as a result of inadequate performance management, arguing that the current system “rewarded failure” by allocating more money to poorly performing hospitals.[41] In response, the Welsh government revised its performance management system, and introduced higher profile ‘Tier 1’, or ‘key priority’, targets that were “subject to very close attention by health boards, trusts and Welsh Government”[42] in 2011 – an approach with similarities to that taken in England and Scotland,[43] albeit with less stringent performance management.[44]
Like Scotland and England after 2014, Wales tried to improve collaboration and integration in the 2010s. The Social Services and Well-being (Wales) Act 2014 “introduced a legal duty on local authorities to promote integration of health and social care when carrying out their social services functions”,[45] and created regional partnership boards to bring together health boards, local authorities and others to improve integration.[46]
Northern Ireland
Health policy in Northern Ireland since devolution has primarily been marked by lack of change – partly because of the suspension of the Northern Ireland executive between 2002 and 2007, and then again between 2017 and 2020. Combined with the difficulty of agreeing reforms in coalition administrations (mandated by the Belfast/ Good Friday Agreement) even when in operation, Northern Ireland has implemented fewer policy changes than the other three nations.
Northern Ireland is also distinct in having had administratively integrated health and social care boards since 1973. Northern Ireland’s four health and social services boards took responsibility for providing social care from local government in 1970 – long before England, Scotland and Wales considered integration a priority.[47] The primary reason for this was because of concerns about “systematic discrimination by local governments”, which escalated sectarian tensions.[48] Integration has had some benefits such as (seemingly)* patients in hospitals waiting less time to be discharged than in the other nations,[49] but Northern Ireland faces some of the same problems as Scotland, Wales and England. The higher political profile of health care – its local visibility and larger budget – tends to mean that it dominates over social care within health and social care boards.[50]
While reforms have been comparatively infrequent, the Northern Ireland executive did introduce changes to its health system in 2009, since when there has been a single commissioning Health and Social Care Board and five health and social care trusts that provide care.[51] Northern Ireland maintained a purchaser/provider split until 2016, unlike Scotland and Wales, but in practice its small population and limited private sector meant that there was little real competition to provide services.[52] As a result Northern Ireland has tended to emphasise co-operation rather than competition, similar to Scotland and Wales.[53]
The problems in Northern Ireland’s health system are well known, with politics the main obstacle to change. There were seven major reviews of health and social care between 2001 and 2016, which all made similar recommendations: reduce reliance on acute hospitals, centralise some specialist services and emphasise healthy behaviour to reduce the prevalence of preventable illnesses.[54] The most recent review (Bengoa, 2016) identified “review fatigue” as a problem in itself and concluded that successive governments had spent a lot of time and resources analysing challenges, identifying weaknesses and making recommendations, but had failed to enact reforms to change the system.[55] The suspension of devolved government between 2017 and 2020 and the coronavirus pandemic have severely hampered progress in implementing Bengoa’s reforms.[56]
* Delayed discharges are counted differently in Northern Ireland, so it is not possible to compare performance in a like- for-like way. See Ham C, Heenan D, Longley M and Steel D, Integrated care in Northern Ireland, Scotlandand Wales: Lessons for England, The King’s Fund, 2013, retrieved 10 March 2021, pp. 16, www.kingsfund.org.uk/sites/default/files/field/field_publication_file/integrated-care-in-northern-ireland-scotland-and-wales-kingsfund-jul13.pdf
NHS spending
The devolved administrations spend more per person than England
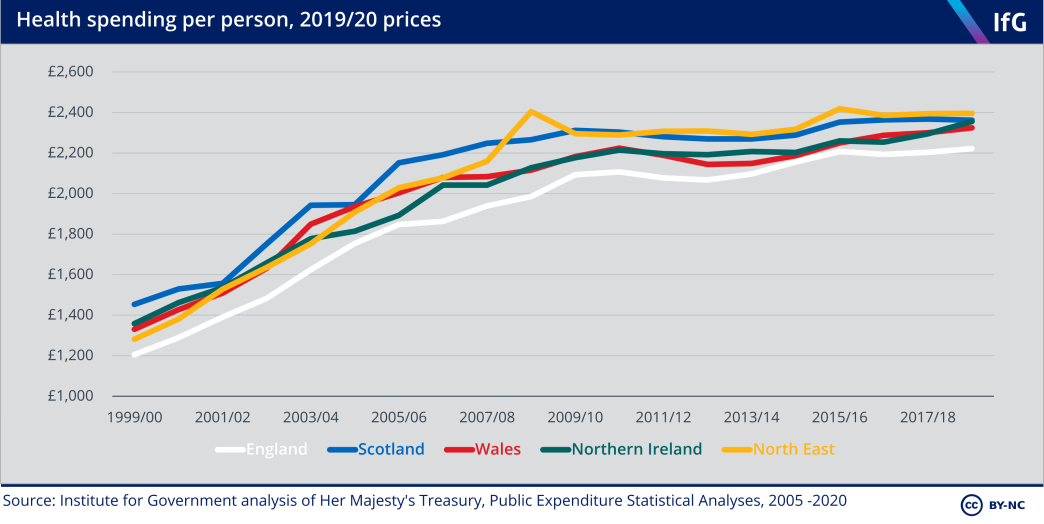
Health spending – spending on medical equipment, outpatient services, hospitals, public health, and research and development[57] – grew very differently across the first two decades of devolution. In the first decade (1999 to 2009), there was rapid growth in spending, but in the second decade (2010 to 2019) spending rose much more slowly.
Health spending has evolved similarly in all four nations, although Wales cut spending the most at the start of the 2010s, reducing spending per person by 3.4% in real terms between 2010/11 and 2013/14 to protect spending on local government and social care. The intention was to focus on wider public health and prevention[58] – but perceived poor performance and media pressure led the Welsh government to reverse course from 2014/15.
Of the four nations, Scotland spends the most per person and England the least. England’s lower spending is partly explained by its comparatively healthier and younger population – the populations of the devolved nations have higher health needs than the population of England overall – and partly because all three devolved nations have a higher overall level of public spending.[59]
Comparing spending in North East England – which has higher health needs than the rest of England – to the three devolved nations illustrates this. The North East spends more per person than the English average because England’s internal formula allocates health care spending according to need (accounting for age, sex, disability, deprivation, supply costs and health inequalities).[60] Due to England’s internal formula and the choices made by the devolved governments, spending grew faster in the North East than in Scotland, Wales, and Northern Ireland between 1999/00 and 2011/12.
After adjusting for health needs, Scotland spends more than Wales and England
Age is one of the biggest determinants of health spending.[61] To account for how much of the difference in spending between the four nations is because of the different age structures of their populations, Table 3.2 compares each nation’s actual spending to what would be expected if they spent the same per person of a given age as England does.
Table 3.2 Expected age-adjusted health spending per person in the devolved nations, 2018/19
|
|
Scotland |
Wales |
Northern Ireland |
North East England |
|---|---|---|---|---|
| Expected age-adjusted health spending per person | £2,179 | £2,252 | £2,102 | £2,212 |
| Actual health spending per person, 2018/19 | £2,305 | £2,269 | £2,300 | £2,338 |
| Actual health spending compared to expected age-adjusted spending per person | +5.8% | +0.8% | +9.4% | +5.7% |
Source: Institute for Government analysis.
This suggests that the majority of extra spending in Wales compared to England is explained by its older population, but that Scotland, Northern Ireland and the North East spend more than England even after adjusting for age. In the case of the North East this reflects other factors in England’s internal allocation formula, such as higher rates of disability. As Wales and the North East have similar demographic and socioeconomic characteristics, the gap in age-adjusted spending suggests that if funding were allocated to Wales via England’s formula, Wales would spend around 5% more than it does now.
The independent Holtham Commission assessed overall spending in Wales compared to England in 2010 and found that for health care, Wales had needs 14–15% higher than England,[62] and – across public services – Wales was underfunded relative to estimated needs.[63] The UK government continues to allocate devolved funding through the Barnett formula – which does not consider needs. However, the Welsh and UK governments reached an agreement in 2016 that future funding increases would be 105% of the increase in English spending, with the aim over time of reaching a ‘funding floor’ of 115% of English spending.[64]
The devolved administrations need higher funding to provide the same level of health care as England. An analysis in 2013 applied the health funding allocation formulae of England and Scotland to estimate funding for the four nations,[65] and found that both would allocate more money to the devolved nations than to England.[66] Both formulae would have allocated the most money to the North East among England’s regions, a similar amount to that allocated to Scotland and Wales.
Table 3.3 Estimates of the health care spending needs of the devolved nations and the funding they would receive through the English funding formula
|
|
Scotland |
Wales |
Northern Ireland |
|---|---|---|---|
| Average per-person need (index, England average = 100), 2013 | 111.7 | 115.5 | 109.1 |
| Actual spending per person, average 2005/06-2010/11 (index, England = 100) | 113.9 | 107.7 | 108.5 |
Source: Institute for Government analysis of Ball R, Eiser D and King D, ‘Assessing Relative Spending Needs of Devolved Government: The Case of Healthcare Spending in the UK’, Regional Studies, May 2013, p. 11.
If UK health spending had been allocated through the English funding formula in 2013, then Scotland would have received 11.7% more funding per person than England, but Scotland actually spent 13.9% more per person. Higher spending in Northern Ireland (8.5% more than in England) was roughly accounted for by differences in health needs. Wales is a clear outlier. It spent 7.7% more per person than in England, but England’s formula would have given it substantially more – 15.5% more per person.
These calculations are now out of date – spending has increased faster in England than in Scotland since 2013. As of 2018/19, Scotland spends 6.3% more per person than England, Northern Ireland 6%, and Wales 4.6%. An updated calculation would be likely to show that the gap between English formula-assigned spending and actual spending in Scotland has narrowed, and that Wales still spends less than it would receive via England’s formula.
NHS resources
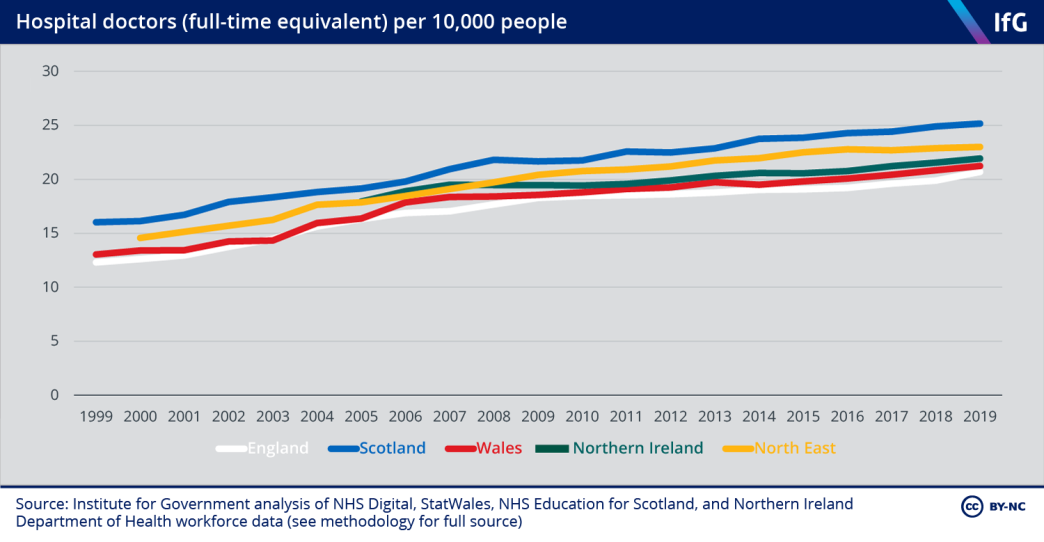
Scotland has the highest staff rates
Differences in spending translate into differences in resources – mainly staff and beds.* The number of hospital doctors per person in each nation broadly corresponds to their level of health spending, although the number of doctors per person in England is slightly higher than would be expected for England’s level of spending.
Due to the lack of comparable data on how many hours GPs work, it is not possible to judge which nation has the most extensive primary care. The number of GPs – which cannot account for any differences in how many hours GPs work in each nation – suggests that Scotland has the most GPs per person, and that England and Wales have a similar number per person. Data on the full-time equivalent number of GPs available between 2009 and 2011 also suggests that Scotland had the highest number a decade ago.[67]
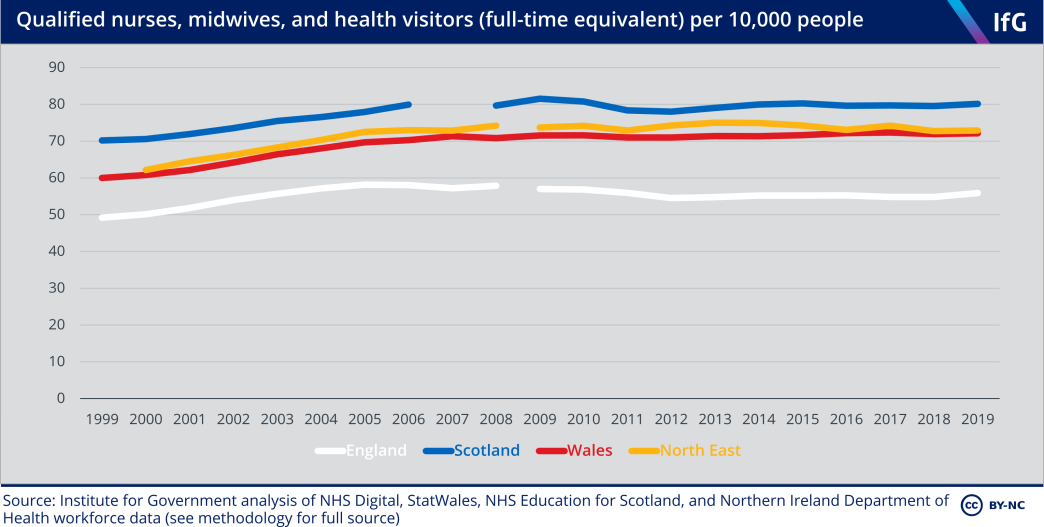
Scotland also has the highest number of qualified nurses, midwives and health visitors per person. The trends in the three devolved nations compared here are again similar, but unlike hospital doctors, there was no increase in the number of nurses during the 2010s. England has significantly fewer nurses – both because of England’s lower spending, and because it relies on support staff, such as health care assistants, more than the other nations.[68]
* Comparing staff numbers and bed numbers is difficult because the four nations define and count these differently so the following data should be interpreted as indicative rather than precisely comparable.
Scotland has the most hospital beds per person
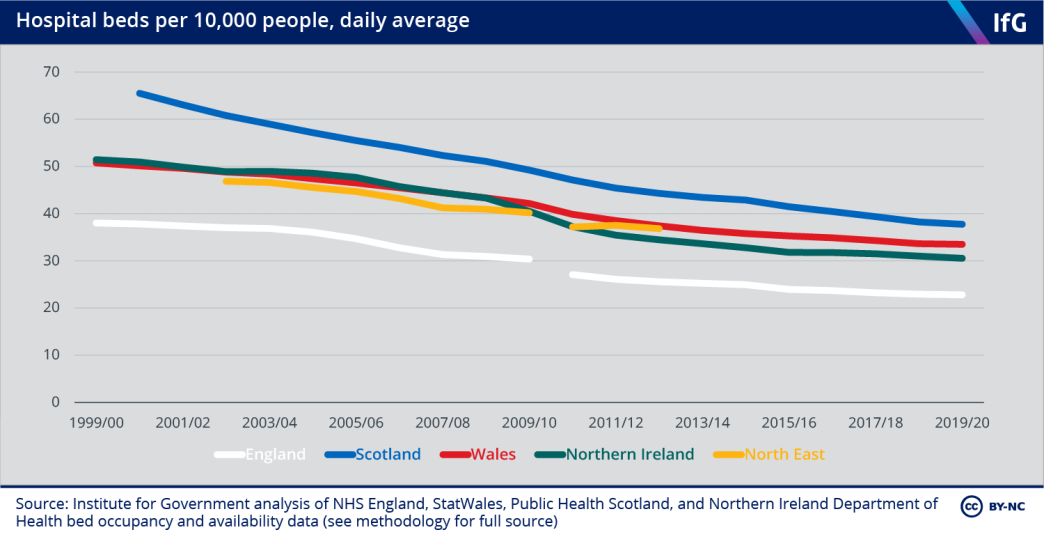
Scotland has consistently had the most hospital beds per person since devolution, and England the lowest. The gradual fall in all four nations reflects medical innovations that have enabled less invasive surgery and shortened recovery time (meaning that hospitals require fewer beds to provide a similar amount of care),[69] and a shared policy of moving care out of hospitals and into community settings where possible.
NHS performance
Comparing the ‘performance’ of health systems – whether the efficiency of the system, the effectiveness of care provided, or how satisfied patients are with the care they receive – is difficult. There is no single objective measure of health performance, and the four nations have prioritised different goals. Some aspects of performance are particularly hard to measure, or to attribute to government policy – it is not clear, for example, whether disability-free life expectancy is an outcome of the health care system, a demand on it, or both. To compare performance, we therefore analyse a variety of indicators primarily attributable to the health system itself and broadly comparable across the four nations, looking at waiting times, patient satisfaction and treatable mortality.
England appears to have reduced elective waiting times fastest in the early 2000s
One measure of the performance of health services is how long people have to wait for treatment.* The first major point of divergence after devolution was England’s ‘targets and terror’ performance management regime, which was not replicated in the devolved administrations. As spending was increasing at a similar rate in all nations, comparing waiting times is a useful way to evaluate how effective that system was. The reported data shows that England improved performance in targeted areas faster than the devolved nations in the early 2000s.
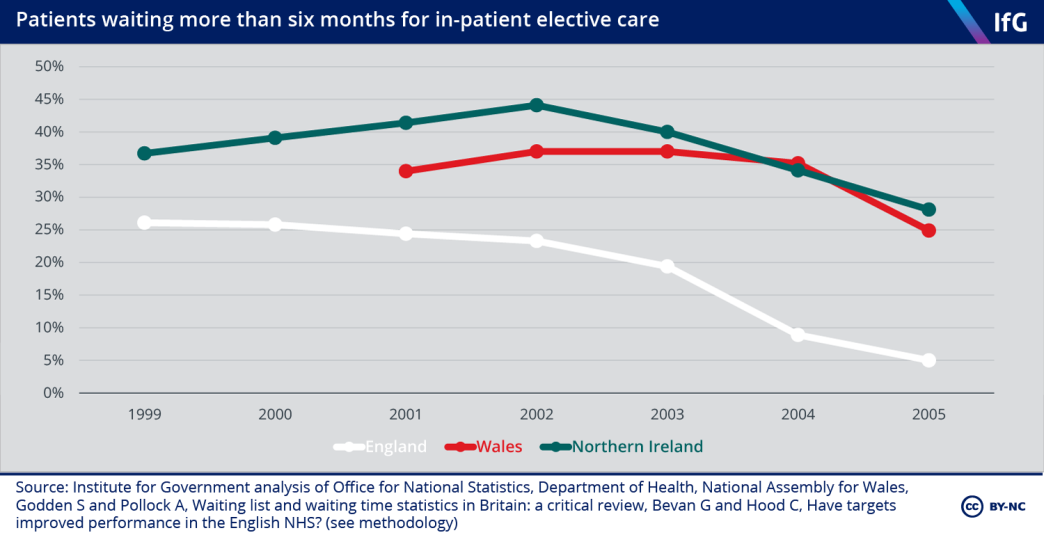
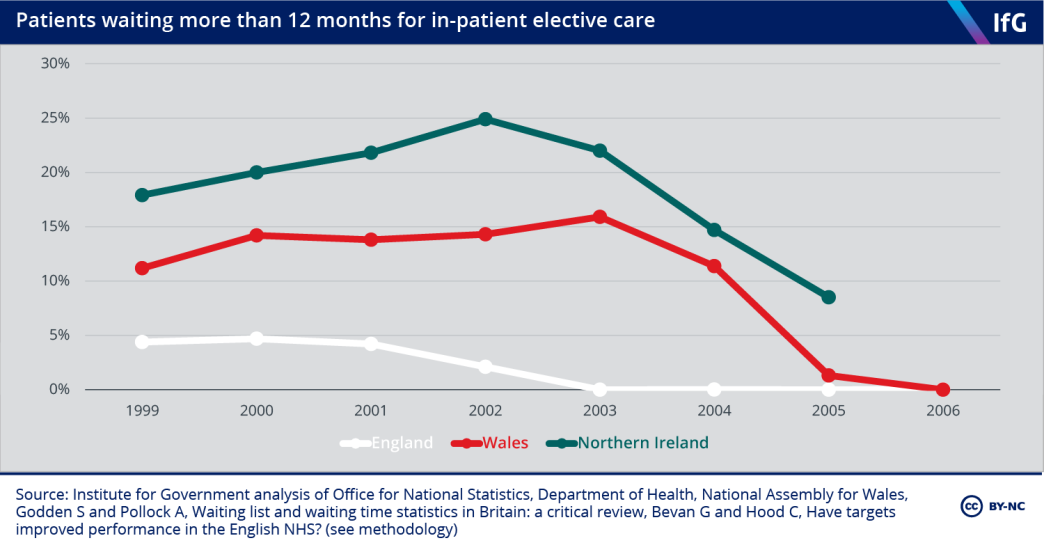
The Blair government prioritised reducing waiting times for elective care in 2000,[70] and between 1999 and 2002 England reduced the number of people waiting more than six and 12 months for inpatient elective care while the number of patients waiting in Wales and Northern Ireland increased. After 2003, both Wales and Northern Ireland started to reduce the number of people waiting although they remained behind England.
Scotland’s waiting times data were measured differently and are not directly comparable – but one analysis comparing the difference in changes in waiting times in England and Scotland between 1997/98 and 2003/04 found that England reduced long waiting times (six months or more) faster than Scotland, by somewhere between 2% and 9%.[71]
The reported data suggests that England’s system helped reduce elective waiting times faster than the other three nations, albeit at the expense of some ‘gaming’ - deliberate actions to improve the reported data.[72] There is some evidence that hospitals in England manipulated waiting list data, and cancelled or delayed follow- up appointments to meet their targets.[73] Approximately 100,000 fewer people were accepted for treatment (put on the waiting list) in the period 2000–03 compared to 1997–99.[74] As it is unlikely that the need for treatment declined significantly between these periods, this suggests hospitals may not have been accepting patients for treatment that they previously would have to reduce waiting lists. England’s system thus had a significant impact on reported performance against targets. Long waits were genuinely reduced – but the exact level of improvement is hard to determine.[75],**
The broader lesson is that targets alone do not necessarily drive improvement. While all four nations had waiting time targets in the early 2000s,[76] only England implemented a linked system of public star ratings, sanctions and rewards. There is some evidence that these star ratings and sanctions – which gave transparent rankings to providers[77] – drove improvement, rather than the targets themselves.[78] There is also evidence from the US and Italy that ‘transparent public ranking’ can improve health care performance[79] – but the system employed in England between 2000 and 2005 involved both this (via star ratings) and sanctions, such as job losses, and it is difficult to disentangle these factors. Targets are not guaranteed to improve performance, and their impact depends on how they are designed and implemented, and the broader system of performance management that they are part of.[80]
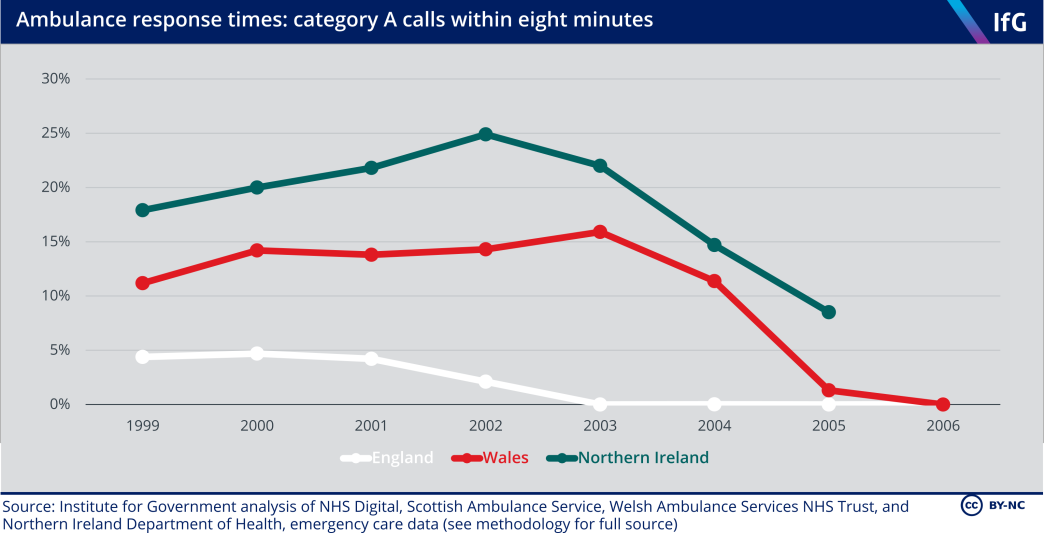
Ambulance response times further illustrate the effect of the star ratings system. England and Wales both introduced call prioritisation in the late 1990s, and both England and Wales had a target to reach 75% of category A (life-threatening) calls within eight minutes by 2001.[81] England improved from 1999/2000 onwards and achieved this target in 2002/03, but performance in Wales hardly improved from 1999/00 to 2003/04.*** The principal difference between England and Wales during this period was England’s star rating system, which applied to ambulance trusts between 2002 and 2005.
As with waiting times, there is also evidence of gaming in England. While ambulance trusts improved performance against the headline eight-minute target, they showed little improvement on non-headline targets.[82] In around a third of trusts, response times were manually ‘corrected’ to be recorded as taking less than eight minutes[83] – although a reanalysis by the Commission for Health Improvement found that “dramatic corrections” to response times would have at most improved reported performance by 6%[84] meaning gaming did not fully undermine improvements.
Scotland and Northern Ireland also improved quickly between 2005 and 2010. Both published performance data during this period and in Scotland, the target gradually increased up to 75% by 2008/09. This was not quite achieved, but the combination of targets and public reporting – such as the Scottish government’s increased focus on HEAT targets – seems to have driven improvement.
In the 2010s, there were frequent changes in measuring ambulance service performance in England, Scotland and Wales, making it impossible to compare. Northern Ireland responded to a smaller proportion of calls on time after 2010 – although the total number of category A calls has been stable since 2014/15, so it is difficult to explain why there has been such a dramatic decline in meeting the eight-minute target. The English, Scottish and Welsh data shows some evidence of a slight decline in the 2010s, but the frequent changes make it difficult to judge accurately.
* Waiting time figures require caution: some of the difference may be because England explicitly targeted this measure of performance and so put more emphasis on reducing waiting times.
** There is little evidence that hospitals hit the targets in England by reducing the quality of other aspects of care such. While England had star ratings, sanctions and rewards, there was no rise in hospital mortality in hospitals in England compared to hospitals in Wales and Scotland. See Besley T, Bevan G and Burchardi K, ‘Naming and shaming: the impacts of different regimes on hospital waiting times in England and Wales’, Centre for Economic Policy Research, Discussion paper 7306, 2009, retrieved 11 February 2021, pp. 13–15, http://eprints.lse.ac.uk/33775.
*** The Welsh government responded to the ambulance service’s underperformance by reducing the target to 65% in 2004.
Scotland now sees the most emergency department patients within four hours
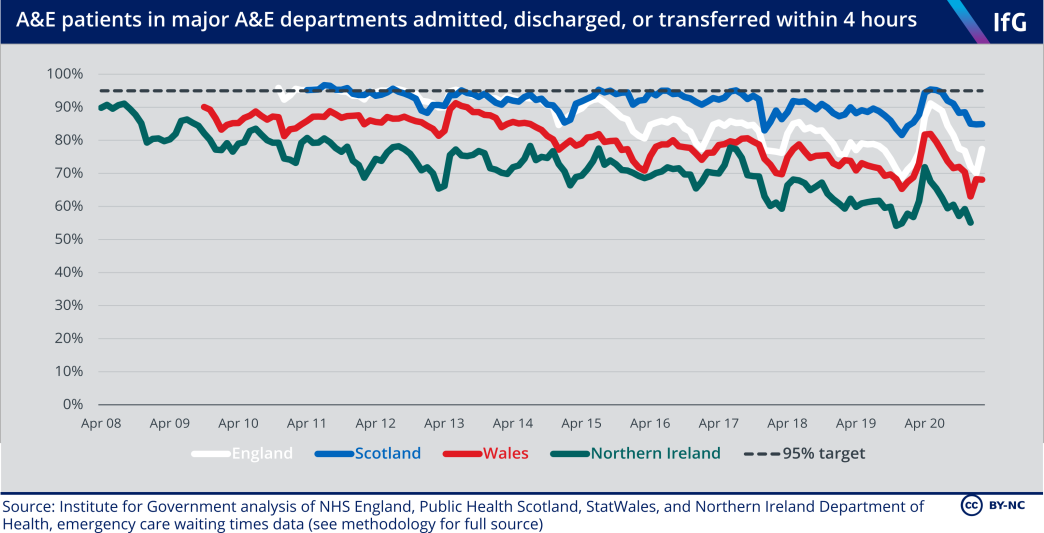
All four nations have had a long-standing target that 95% of A&E patients should be admitted, discharged or transferred within four hours. Scotland has had the best A&E performance on this measure of the four nations since 2015; Northern Ireland has consistently had the worst. The trends in the four nations are very similar: a gradual but consistent decline during the 2010s, at least partly explained by tight funding.[85] The uptick at the start of 2020 is due to much lower A&E attendance during the early months of the coronavirus crisis when, even before the first national lockdown was introduced, many people chose to stay away from hospitals.[86]
Northern Ireland has the longest elective waiting times in the UK
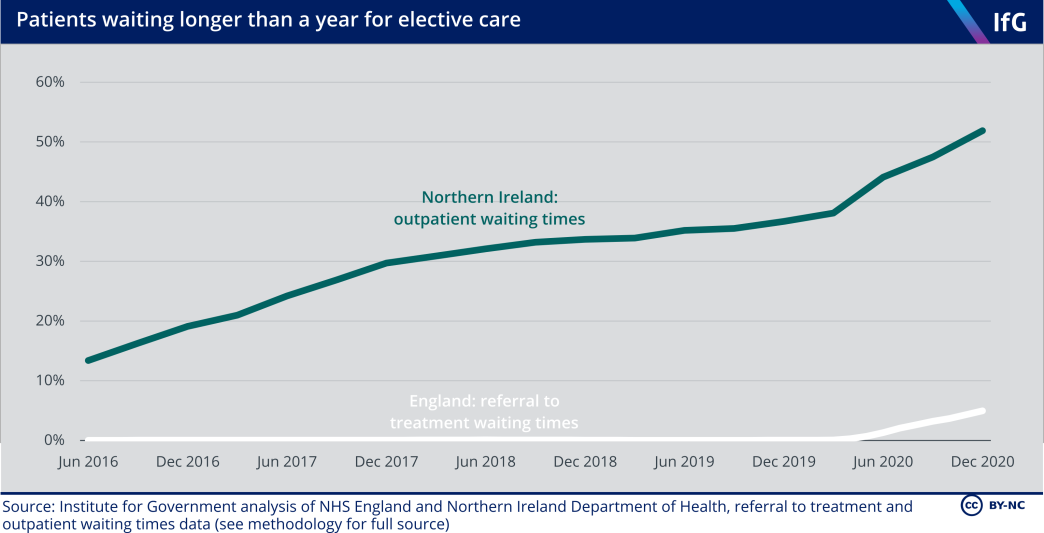
It is difficult to compare waiting times for elective care in the four nations because the data is not collected and published in a comparable way,* but it is clear that waiting times in Northern Ireland are much longer than in any of the other three nations. Northern Ireland measures two different waiting times: outpatient waiting times (the time patients wait from being referred to having their first outpatient appointment), and inpatient waiting times (the time patients wait from when a clinician decides they need treatment to being treated).
Comparing referral to treatment times in England – which cover both outpatient and inpatient waiting – to just outpatient waiting times in Northern Ireland is illustrative. Between 2016 and 2019 virtually no patients in England waited longer than a year from referral to treatment – in Northern Ireland, a large proportion of patients had to wait longer than a year just to receive their first outpatient appointment. Over a third of patients on outpatient waiting lists in Northern Ireland were waiting for more than a year before the coronavirus pandemic.
Northern Ireland also has very long inpatient waiting times, meaning patients wait even longer once a clinician has decided they need treatment; some wait years from referral to treatment.[87] The comparison with England is stark. In September 2019, more than 100,000 patients had waited more than a year for their first outpatient appointment in Northern Ireland, whereas in England only 1,305 patients had waited more than a year on the entire pathway from referral to treatment, even though Northern Ireland has only 3.4% of England’s population.[88]
The number of people waiting for a long time in Northern Ireland has increased since the 1990s. Waiting times decreased in the mid-2000s but these gains were lost within a few years,[89] and the number has increased since 2013. Between December 2013 and December 2018 there was a 459% increase in the number of patients waiting more than nine weeks for their first outpatient appointment.[90]
There are multiple causes of Northern Ireland’s long waiting times, but insufficient funding and rising demand are not plausible explanations. Northern Ireland’s health spending is comparable to Scotland and Wales, and elective waiting time performance has been stable in Wales during the 2010s.[91] There have been year-on-year increases in elective care referrals in all four nations of the UK.[92] Plausible explanations include: increases in emergency admissions (forcing hospitals to postpone elective procedures),[93] inefficiencies in hospital provision (Northern Ireland has an excess of acute hospitals and a lack of specialist sites, slowing down treatment times as resources are spread thinly),[94] staffing shortages, and ineffective performance management (none of Northern Ireland’s waiting time targets has been met since 2014 despite regular changes to make the targets easier to achieve).[95],[96]
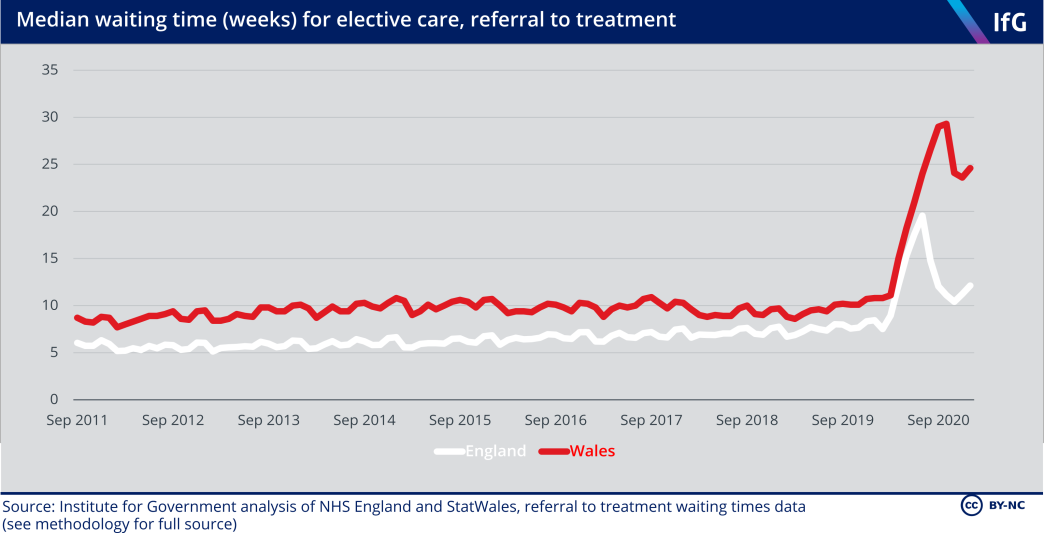
Comparing the nations in the rest of the UK** shows that throughout the 2010s England had shorter median waiting times than Wales, although waiting times in Wales did not increase over the decade, whereas waits got slightly longer in England.*** The trend in Scotland’s elective waiting times is similar to England between 2012 and 2020, showing slightly lengthening waiting times.****
* England, Scotland and Wales all measure the time from ‘referral to treatment’ (RTT) – the time that non- emergency patients wait between first being referred to starting treatment. However, it is only possible to fairly compare England and Wales because they both publish data on ‘incomplete’ waiting times – the length of time patients who are currently on the waiting list have been waiting.
** Scotland publishes data on complete referral to treatment times (people who have been treated), whereas England and Wales publish data on incomplete referral to treatment times (people who are waiting to be treated) – and is not included here. The implications for comparison are unclear: international evidence suggests that waiting times for patients treated may be longer or shorter than waiting times for patients on waiting lists. See Siciliani L, Moran V and Borowitz M, ‘Measuring and comparing health care waiting times in OECD countries’, Health Policy 118(3), December 2014, pp. 292–303, retrieved 3 March 2021, https://core.ac.uk/download/pdf/82804797.pdf
*** The rapid increase in waiting times in England and Wales after March 2020 reflects postponed operations as a result of the pandemic response.
**** As measured by patients waiting longer than 18 weeks for incomplete RTT (England), compared to patients waiting longer than 18 weeks for complete RTT (Scotland).
Patient surveys suggest similar levels of satisfaction
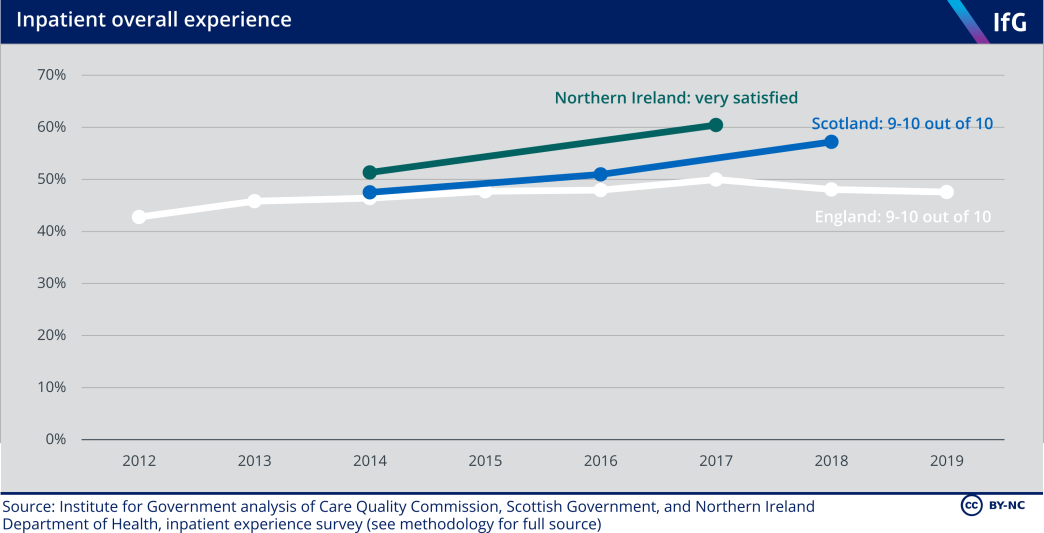
Patient experience surveys provide another measure of performance. Differences in survey design mean that only England and Scotland – who ask inpatients to fill in surveys rating their “overall experience” on a scale of 1–10 – can be easily compared. Inpatient surveys suggest that patients in England and Scotland are broadly equally satisfied, although patients in Scotland reported being more satisfied in 2018.
Northern Ireland also asks a question about “overall experience” but uses a five-point scale. The proportion who are “very satisfied” is, however, relatively similar to the proportion who choose 9–10 out of 10 in Scotland and England. Wales does not have a comparable inpatient survey.
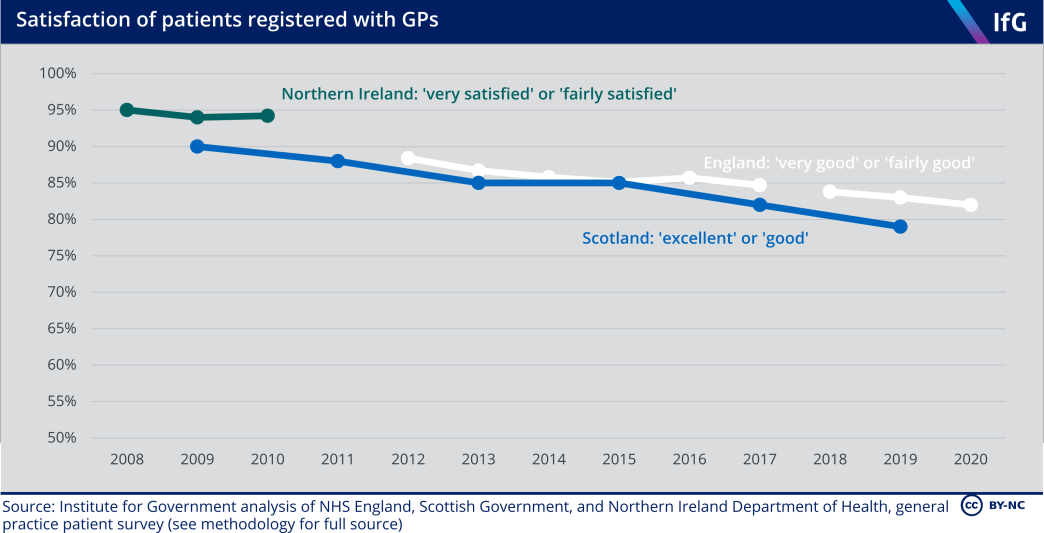
England and Scotland also run similar general practice satisfaction surveys – both ask patients registered with GPs to say how satisfied they are on a five-point scale, albeit with slightly different wording.* Patients’ satisfaction with their GP is similar in both countries, declining during the 2010s. The limited data from Northern Ireland only shows that satisfaction was high between 2008 and 2010. Wales uses a different survey methodology, so the results are not comparable.
* There was a methodology change in England in 2018.
The four nations of the UK have all reduced treatable mortality since devolution
It is difficult to measure the impact of health care systems on overall population health, but ‘treatable mortality’ approximates how much health care reduces mortality. Treatable mortality measures “causes of death that can be mainly avoided through timely and effective health care interventions, including secondary prevention and treatment”,[97] and is often used as a way to assess the quality of care in different systems across countries and over time.[98] Deaths caused by appendicitis, scarlet fever and asthma are considered treatable, but deaths caused by malaria, influenza (flu), and alcohol and drug poisonings are instead considered preventable – “deaths that can be mainly avoided through effective public health and primary prevention interventions”.*
Some causes of death are counted as 50% treatable, to reflect that some cases are treatable while others are not, so some cancers and heart disease are included. Owing to the difficulty of assigning causes of death for older people, treatable deaths only include those aged under 75. In 2019, 8% of all deaths in the UK were considered treatable.[99]
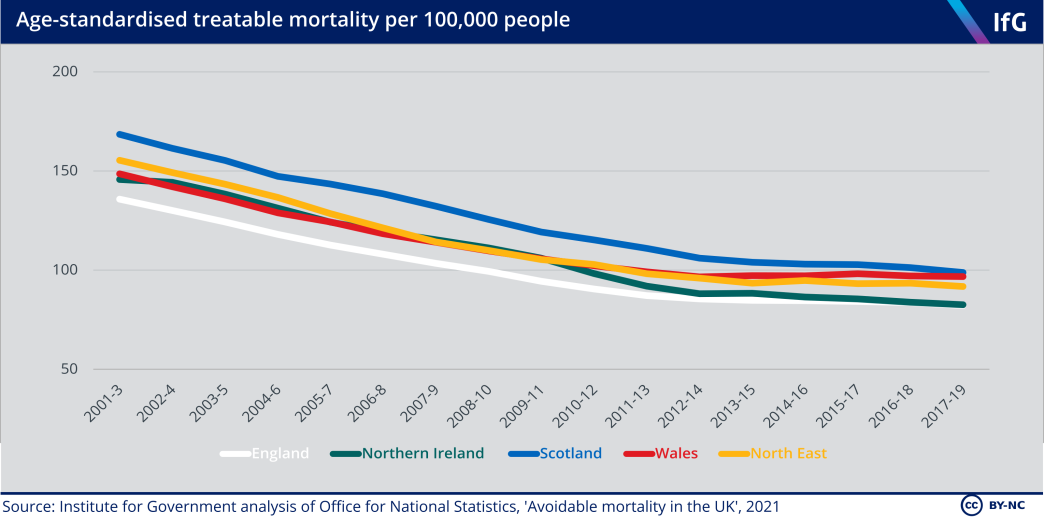
Treatable mortality is a subset of overall mortality, which partly explains why Scotland which has higher overall mortality rates – has consistently had the highest rate of treatable mortality since 2001.**
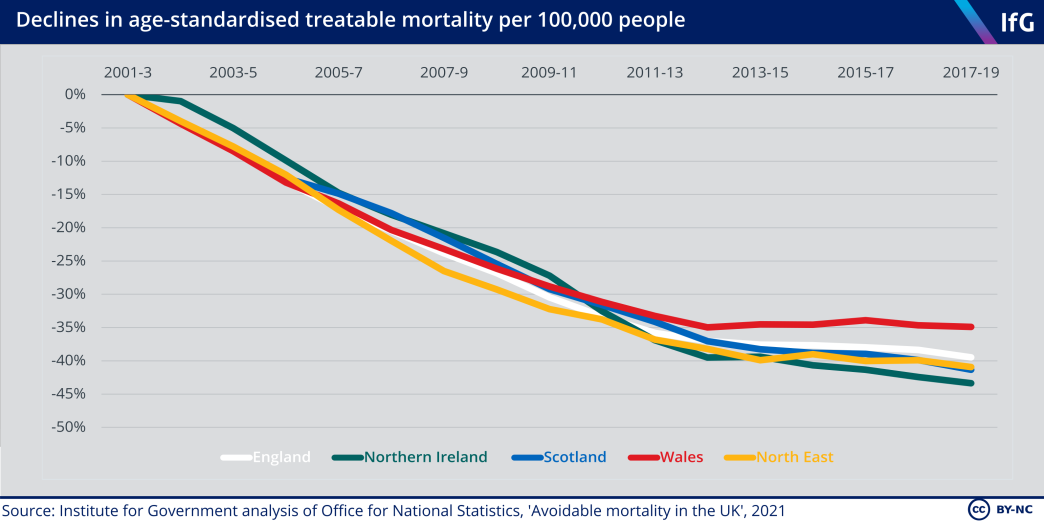
The four nations have reduced treatable mortality at similar rates since devolution, despite their very different starting points and divergent policy choices – principally because of developments in medical science and treatment common to all four nations. As with overall mortality, the rate of improvement has slowed since 2011 although Northern Ireland – despite poor health service performance on the measures detailed above – continued to improve during the 2010s, such that it is now very similar to England on this measure.
Northern Ireland has improved the most since 2001, and Wales the least. In Wales in the 2010s, treatable mortality among both men and women barely improved. England and Scotland have improved at similar rates. Given the demographic comparability between the North East of England and the devolved nations described above, improvements in treatable mortality among men in the 2000s suggested that England’s health care system was initially improving faster[100] – but Scotland and Northern Ireland have improved more than the North East in the 2010s.
Looking at causes of death, the difference between Northern Ireland and Wales is mainly accounted for by deaths caused by circulatory diseases, such as aneurysms and heart disease, and deaths caused by respiratory diseases, such as asthma and pneumonia. Deaths from circulatory and respiratory diseases are significantly higher in Wales than in Northern Ireland, and Scotland also has high deaths from circulatory diseases.[101]
Considering Northern Ireland’s very long waiting lists for elective care, it is surprising that it performs well as measured by treatable mortality. This is probably because long elective waits tend not to be for life-saving procedures. Some studies suggest that long elective waiting times – which in most cases are for procedures to improve mobility or reduce pain – are associated with reduced quality of life, but not higher mortality rates.[102] Monitoring the clinical impacts of long elective waiting times appears to be inadequate in both Northern Ireland and England,[103] and further research in this area would help inform future policy.
Higher treatable mortality rates in Wales might be linked to Wales’s low spending compared to need in the 2010s, but Wales’s relatively high treatable mortality rate in the 2010s is likely to have a variety of causes.
* Treatable mortality does not, for example, cover vaccination to prevent contagious diseases. Bevan and others (2014) found that childhood vaccination rates in 2011/12 were very similar in the four nations, with England’s vaccination rates slightly lower than the other three nations. For a full list, see OECD, ‘Avoidable mortality: OECD/Eurostat lists of preventable and treatable causes of death (November 2019 version)’, November 2019, retrieved 6 April 2021, www.oecd.org/health/health-systems/Avoidable-mortality-2019-Joint-OECD-Eurostat-List-preventable-treatable-causes-of-death.pdf
** Scotland’s significantly higher drug and alcohol deaths are not included in this comparison because they are considered ‘preventable’ rather than ‘treatable’. In 2019, there were 48.1 alcohol- and drug-related deaths per 100,000 people in Scotland, significantly above Northern Ireland (31.7) and more than double Wales (23.9) and England (21.4). See ONS, ‘Avoidable mortality in the UK: 2019’, ONS, 26 February 2021, retrieved 6 April 2021, www.ons.gov.uk/peoplepopulationandcommunity/healthandsocialcare/causesofdeath/datasets/avoidablemortalityintheuk
Lack of comparable data prevents a more complete assessment of performance
Almost all attempts to analyse performance in the four nations of the UK have found serious problems when comparing the data produced by each nation owing to variations in data collection and publication. We encountered the same problem in our research: there is not enough comparable data to build a clear picture of the performance of the four health care systems.
Improving data is vital to widening our understanding of the health systems in the four nations, and to shed greater light on the successes and failures of different policies. This should be a priority for both statisticians and policy makers. Better data will help policy makers improve services. We recommend that the following data should be prioritised for improvement:
- Hospital activity: it is difficult to compare hospital activity data – the number of inpatients, outpatients, day cases and procedures in each nation. These are vital to compare productivity and efficiency. While the problems are well known,[104] little has been done to improve comparability.
- Spending: more granular spending data would be useful to evaluate how the four nations spend their health budgets – distinguishing between hospital and community health services, primary care and social care.
- Staff: the way that doctors and nurses are counted in each nation is still slightly different, without good reason. We think that statisticians in the four nations should explain why staff are counted differently and agree a methodology to collect data on the number of hours worked by GPs, to allow meaningful comparison.
- Elective waiting times: the four nations still count waiting times differently, although England and Wales now produce data on the time taken from referral to treatment, including median waiting times for people currently waiting for treatment. Scotland and Northern Ireland could adopt this measure – or England and Wales could publish comparable data on people who have been treated. The health systems in England, Scotland and Wales should have the underlying data to publish either or both of these measures, and it would increase accountability if they agreed to publish at least one – ideally both – comparable measure regularly. Northern Ireland should prioritise producing data on the time from referral to treatment both to improve policy makers’ understanding of how long patients wait in total, and to facilitate accurate comparisons with the other three nations. Before the pandemic, there was ongoing work in Northern Ireland to produce referral to treatment waiting times, and we strongly recommend that data comparability should be considered as this is developed.[105]
- Experience surveys: the four nations should agree a single question for inpatient and GP experience in their health surveys, to allow comparison using the same wording and answer scale. England and Scotland already have very similar questions, so this could provide a starting point. The four nations should also use a similar methodology for these surveys.

The social care systems of England, Scotland, Wales and Northern Ireland provide different levels of care.
Adult social care
The social care systems of England, Scotland, Wales and Northern Ireland provide different levels of care. Proportionally, nearly twice as many older people receive care at home or in a care home in Northern Ireland than in England, and all three devolved governments spend more on care than in England.
Differences in spending reflect differences in policy: Scotland and Northern Ireland spend more because they have chosen to provide some free home care to all people in need, not just those who pass a means test.*
But all four social care systems have been squeezed in recent years, as spending has not risen in line with demand. This has blunted the impact of those policy differences, as providers in all four countries have used similar strategies to manage demand locally.
It is not possible to say which social care system performs best. The four governments measure very few social care outcomes, and those that they do measure are difficult to compare. This lack of information has hindered governments in the four nations from learning from each other’s experiences in order to improve services. Improving data availability and comparability must be a priority.
* Home care refers to care provided in a person’s own home – for instance, washing, managing medication, or helping with routine household tasks. Northern Ireland provides free home care, whereas Scotland provides free personal care, a term that encompasses most aspects of home care but excludes some household tasks like meal preparation. Residential care refers to care provided in a care or nursing home. Nursing care means care services that need to be provided by a trained nurse, usually for higher-need clients.
Social care policy
Scotland and Northern Ireland gained legislative powers over social care in 1998 and Wales in 2006.[1] Since then, the four nations have made different policy choices, notably on which services are available for free.
Most of the differences between the systems are the result of choices made since devolution. But some elements of social care provision, like the administrative integration of health and social care in Northern Ireland in 1973 or differences in whether services are provided by the private or public sector, pre-date devolution.
England’s system is the least generous
The proportion of people whose care is paid for by the state is very different in different parts of the UK, due both to variation in policy design and to differences in wealth between the four nations.[2]
Table 4.1 Summary of state-funded social care in the four nations
Country |
Means test (upper limit)* |
Responsible body |
Non-means- tested provision |
% self- funding – home care |
% self- funding – residential |
|---|---|---|---|---|---|
| England | £23,250 | Local authorities | Limited NHS provision** | 30% | 46% |
| Scotland | £28,000 | Local authorities | Free personal and nursing care | 25% | 36% |
| Wales |
£50,000 (residential) £24,000 (home care) |
Local authorities | Capped home care costs (£100 per week) | 21% | 32% |
| Northern Ireland | £23,250 | Health and social care trusts | Free home care and nursing care | 7% | 11% |
Source: Institute for Government analysis of self-funding estimates from the Skills for Care papers in the four nations, means test limits from Oung C, Schlepper L and Curry N, ‘Offer and eligibility: Who can access state-funded adult care and what are people entitled to?’, 18 March 2020, retrieved 1 April 2021, www.nuffieldtrust.org.uk/news- item/offer-and-eligibility-who-can-access-state-funded-adult-care-and-what-are-people-entitled-to***
To receive state-funded care, potential users are assessed to see if they need support, and if the value of their assets is below a given threshold.**** In all four nations, those who meet the relevant needs and means test receive state-funded care – such as home adaptations, home care or a care or nursing home place. For those who meet the means test, the state provides the full costs of staying in a care home – covering both care and so-called ‘hotel costs’.*****
Wales has the most generous means test, providing funding for residential care to anyone in need with assets valued at under £50,000. The threshold for residential care was raised from £24,000 in 2017; the means test for community care remains £24,000.[3] Scotland, Wales and Northern Ireland provide some state-funded care even for those who have assets above the threshold. In Wales, those with a higher level of assets have their contribution to home care capped at £100 per week.[4] In Scotland and Northern Ireland, most care services provided in the home are free, regardless of the assets someone has. In Northern Ireland, health and social care trusts (HSCTs) have the right to charge for home care services but rarely do, and never charge the over-75s.[5]
In Scotland, personal care has been free since 2002 for people aged 65 and older, and since 2019 for all adults.
In Scotland and Northern Ireland, the state also provides a subsidy for care and nursing home residents who are in need, but those with assets above the means test must continue to pay the majority of their fees.
* Those with assets above this level have to fund all of their care themselves. There is also a lower means test limit, below which all care is state-funded. For those whose assets fall between these two limits, the state will fund part of care costs, depending on the income and the assets of the care recipient.
** NHS Continuing Care funding – through which the NHS pays for the care of those whose needs are primarily health needs – funds around 10% of residential care beds in England.
*** A ‘self-funder’ is someone who primarily pays for their own care out of a pension, savings or other assets, rather than receiving government support. Many care recipients, including those in residential care in Scotland who receive free personal care payments from the government, fund only part of their care, so these self-funding estimates include everyone who is fully or mainly self-funding.
**** Needs tests vary between nations in terms of what services applicants are entitled to receive. Means tests do not take into account the value of a home when care recipients or family members still live there, so in most cases only financial assets like savings, pensions or second homes are included. The Money Advice Service, ‘Means tests for help with care costs – how they work’, [no date], accessed 1 April 2021, www.moneyadviceservice.org.uk/en/articles/means-tests-for-help-with-care-costs-how-they-work
***** ‘Hotel costs’ are the costs charged for the accommodation and food provided by care homes and nursing homes, which typically make up most of care home fees.
Northern Ireland is unusual in funding and administering health and social care together
Social care services are run by local authorities in England, Scotland and Wales. The services are therefore run separately from the NHS, although people frequently move between hospitals and care settings.
In Northern Ireland, social care is funded and administered by five local HSCTs. In theory, integration should improve co-ordination between health and social care services, but in practice there are still big divisions between social care and health care provision in HSCTs, and health care is prioritised over social care.[6]
In England, Scotland and Wales, social care is funded through general grants to local government, specific grants such as the Better Care Fund,[7] and locally raised revenues. The governments in Westminster, Holyrood and Cardiff set requirements for what care should be provided but there is no ringfenced funding for social care.
People accessing care can also receive funding from the NHS and the benefits system. The NHS funds social care in England and Wales if the need for care is assessed to have arisen from a health need,* and this funding is not means-tested. In Scotland, the NHS only pays for social care when it is delivered in a hospital setting.[8] Benefits provide funding for people to purchase support, including social care, privately. State spending on benefits for disabled people varies significantly between countries – Northern Ireland spends the most per person, around £1,400 a year, with Wales second (£900) and England the lowest (£600).
* In practice, however, the definition of a health need is quite restrictive – often excluding dementia sufferers, for example.
All four nations are aiming for similar things
The four nations provide different levels of care,* but they share a set of aims that have been re-emphasised in successive reviews and policy statements:
- Better integration between health and social care. All four nations, including Northern Ireland with its more integrated system, have tried to improve co-ordination between health and social care providers and encourage them to share resources.[9]
- More choice. All the nations have tried to introduce more consumer choice into the system, chiefly by introducing direct payments that allow individuals to decide which services they want to buy.[10]
- More care in the community. Social care leaders in all four nations have tried to shift to providing care to people living in their own homes, rather than in care homes, to allow people to retain more independence and better ties with their community.[11]
- An updated funding model. Repeated reviews have proposed changes to social care funding to reduce the costs that individuals bear, often recommending caps on costs or more generous free provision alongside a more secure funding source. None of the four governments has yet fully implemented any of these recommendations.[12]
* The four systems are not so different in an international context, however. None offers mandatory state insurance to cover social care costs, unlike several OECD countries. Robertson R, Gregory S and Jabbal J, The social care and health systems of nine countries, The King’s Fund, 2014, www.kingsfund.org.uk/sites/default/files/media/commission-background-paper-social-care-health-system-other-countries.pdf
Social care spending
England spends the least and cut its spending the most after 2010
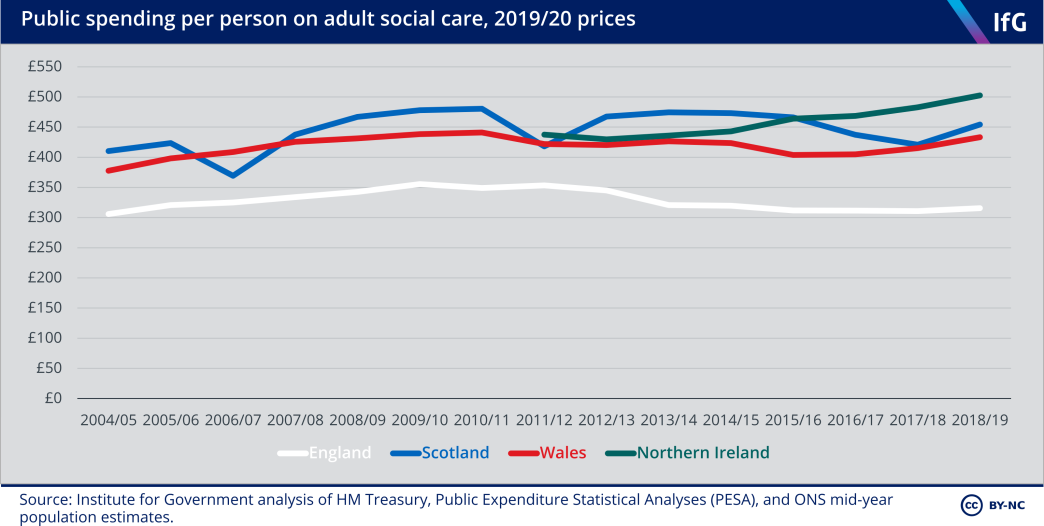
The government in England spends significantly less per person on social care than the other governments. This reflects both the limited amount of non-means-tested social care and lower needs on average among the population of England compared to the other three nations.*
The gap in spending has widened in the past 10 years. Spending per person in England fell by 11% in real terms between 2010/11 and 2018/19, while other nations’ spending stayed relatively steady or, in the case of Northern Ireland, rose.**
Northern Ireland now spends the most per person on social care of the four nations.
* England has lower levels of disability than the other countries, for example. For more detail, see the joint introduction to the health and social care chapters.
** Spending data in Northern Ireland should be treated cautiously, as health and social care joint budgets mean that some spending that counts as health care spending elsewhere may be categorised as social care spending in NI (and vice versa).
Scotland and Northern Ireland spend the most on social care for older people
Adult social care spending is split between spending on working-age people, usually with disabilities or learning difficulties, and older people. Most state-funded care recipients are aged 65 and over, but state-funded care costs more per recipient for working-age than for older people. In the latest year of data, local authorities in England spent £61,000 per working-age care home resident in 2019/20, as opposed to £21,000 per older care home resident.[13]
The most recent data available suggests that 83% of adults receiving state support in Northern Ireland are aged 65 or older, compared to 82% in Scotland, 75% in Wales, and 67% in England.[14]
As a result of differences in state-funded care, the proportion of adults receiving care services varies considerably. In England, around 5% of people aged 65 and over received any state-funded care services at the end of March 2020, but in Northern Ireland 9% were receiving home or residential care alone.[15] In Scotland, the proportion receiving home care or residential care was 8% in 2018, and in Wales it was 6% in 2019.[16]
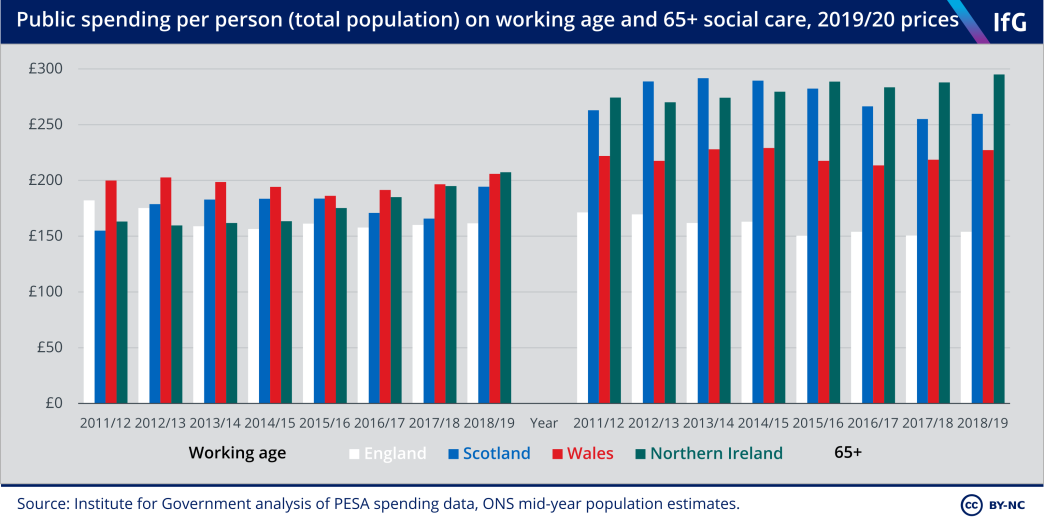
England’s comparatively high proportion of working-age clients means that the English social care budget is fairly evenly split between working-age and older adults. England spends a similar amount to the devolved governments on care for working-age adults, but a lot less on older people.
The cuts to spending on social care for older people in England and Scotland since 2010/11 may reflect the fact that councils in both countries have found it easier to cut spending on older people – who may be able to find and fund their own care – than spending on working-age adults, who typically struggle to do so. England cut social care spending on older people by 14% in real terms between 2010/11 and 2018/19, and Scotland by 9%. In England, spending on social care for working-age adults rose 8.6% between 2010/11 and 2018/19. In Scotland, spending on working-age adults increased by 7.7% between 2010/11 and 2018/19.*
Wales has consistently had the highest spending on working-age social care, which likely reflects the fact that a larger proportion of the population is disabled. Wales, however, spends less on social care for older people than Scotland and Northern Ireland, despite having an older population.[17]
* It is worth noting that 2010/11 was an unusually low year for spending in England, due to some cross-year variation in spending – England’s spending on working-age social care in 2018/19 was still lower in real terms than in 2011/12 and 2012/13.
Spending in Wales has shifted towards residential care
Spending by care setting – whether state funding is paying for care in someone’s own home, a residential or nursing home, administrative costs, or given directly to service users for them to purchase their own care – shows how policy differences have changed service provision.
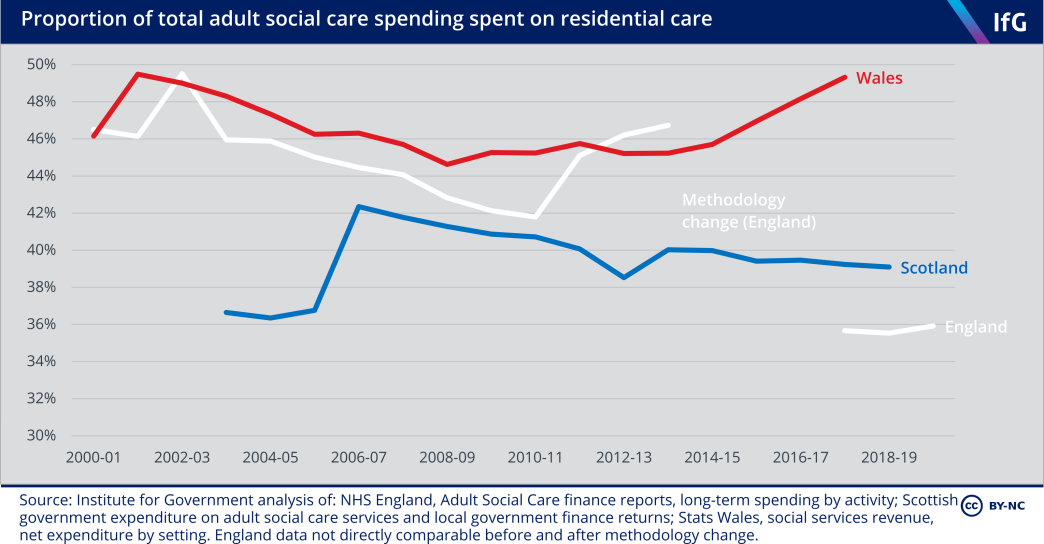
In Wales, spending on residential care has risen in the past few years, as the relaxation of the means test has meant that local authorities have started picking up the costs of more people in care homes.
In contrast, free personal care in Scotland has resulted in increasing provision of care in the community (where it is free for all) rather than in care homes (where recipients with assets above the means test still have to pay their own ‘hotel’ costs). The proportion of the care budget spent on community care in Scotland increased from 32% to 40% between 2003/04 and 2018/19, and Scotland now spends more money on community than residential care.
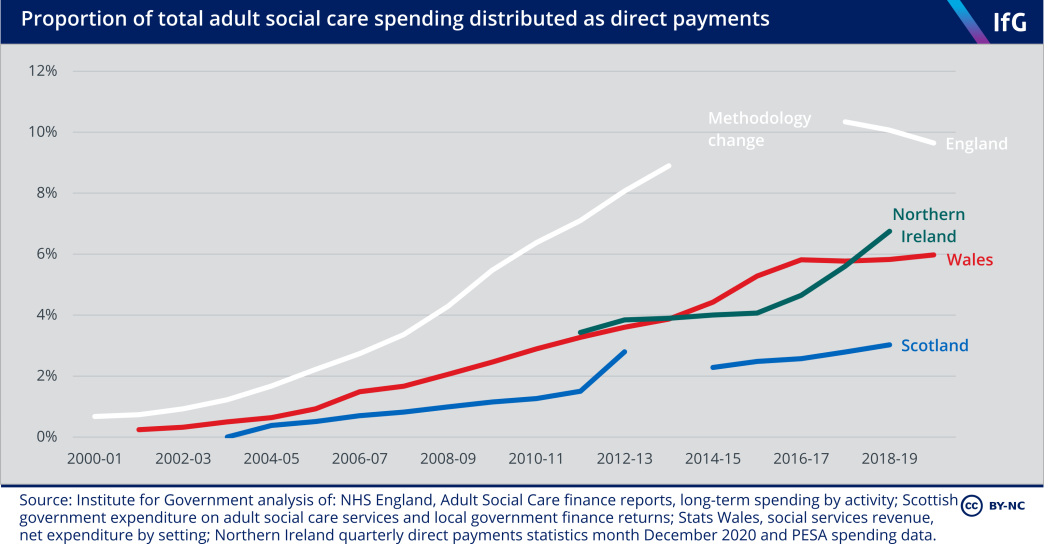
Direct payments – money given to service users or their carers which they can spend as they choose – have risen in the past decade in all four nations, reflecting the shared ambition to give care recipients more control over the type of care they receive and who they receive it from. Direct payments are highest as a proportion of total spending in England, where nearly one pound in every ten spent is given directly to the care recipient or carer – although the proportion has recently fallen.
Social care performance
Social care aims to improve the wellbeing and safety of care recipients, but its impact is difficult to measure. The needs of the population in each country are different, and it is hard to quantify privately funded or unpaid care – and therefore hard to judge the consequences of cutting state-funded social care.
It is, however, clear that cuts to social care spending over the past decade have had a major impact on the amount of state-funded care that people can access. The number of people accessing care has not kept up with demand in any of the four nations.
The proportion of people receiving state-funded care has fallen in all four nations
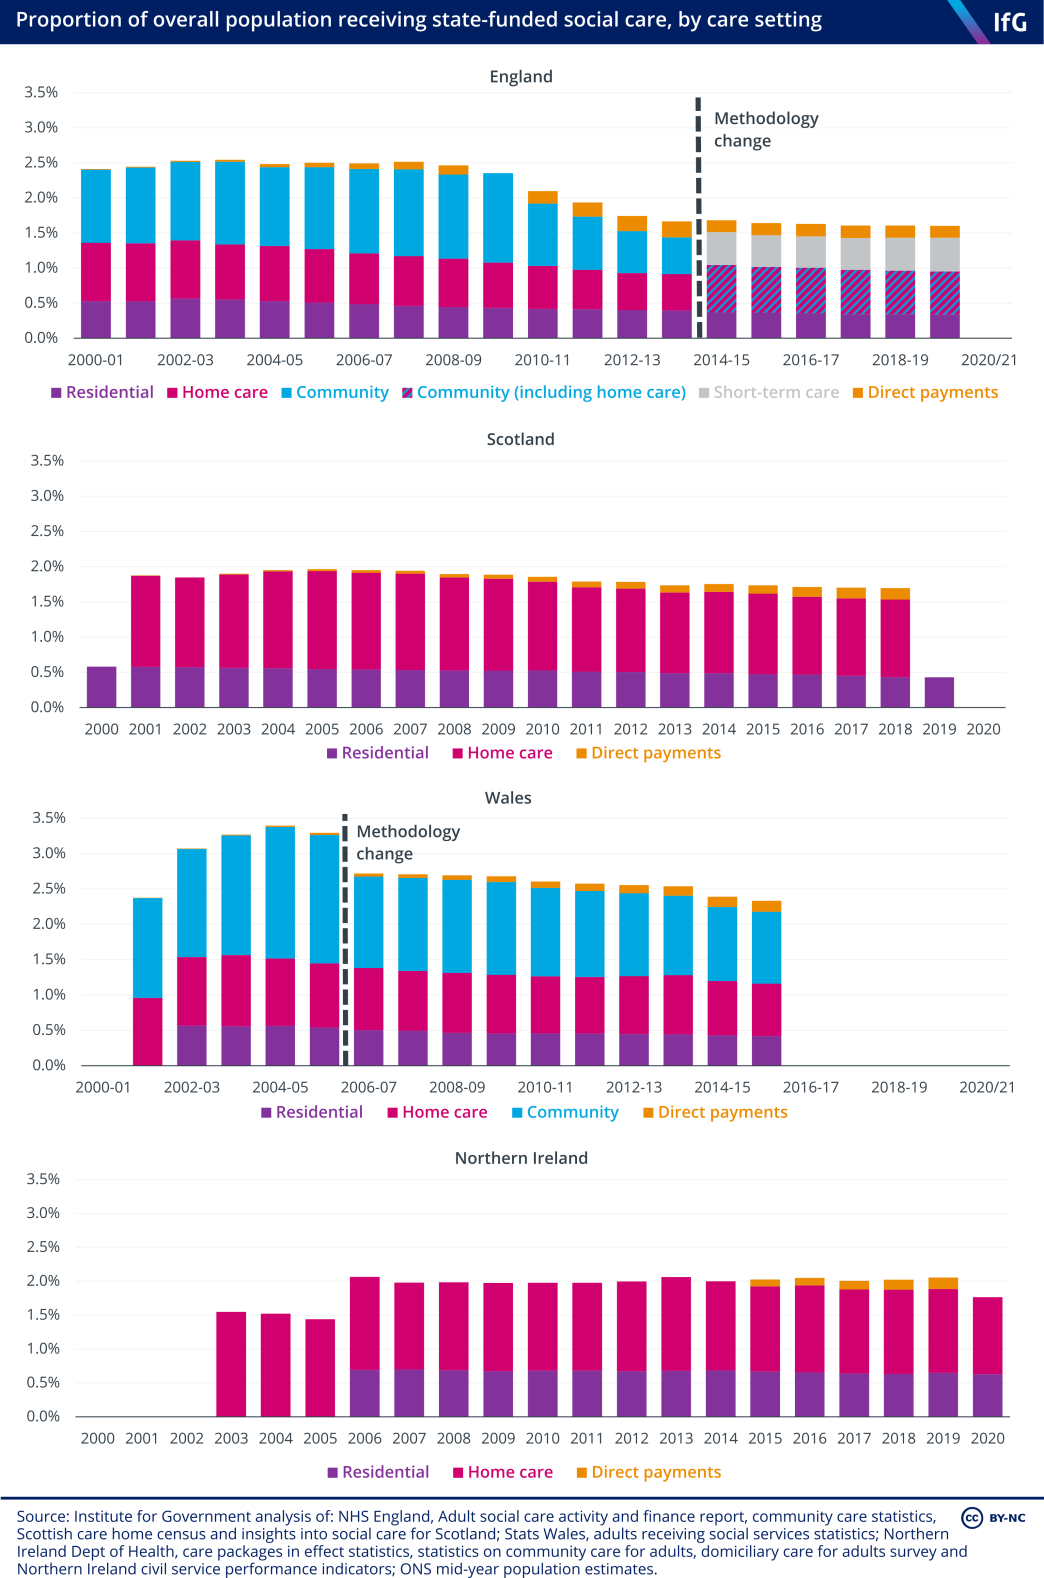
The number of clients receiving home or community care fell sharply in England after 2008, more than in any other country.
The number of clients receiving care in Scotland fell after 2005 – partly because providing free personal care resulted in local authorities providing less home care that was not explicitly covered under this, such as meal preparation.* In Wales, the number of people accessing care declined between 2006 and 2015 and declined again between 2016 and 2019.**
Only in Northern Ireland have numbers receiving care remained relatively stable, although they have not kept pace with rising demand from an ageing population.
This data also indicates the reach of different care systems. Northern Ireland seems to be the most generous, providing home care, residential care or direct payments to around 2% of its population, as opposed to 1.7% in Scotland and 1.3% in Wales. In England, the most recent data including home care (from 2013/14) indicates that 1.1% of the population received these state-funded services.
Considering the number of people who report limitations on their day-to-day activities due to a long-term health problem or disability (including problems related to old age), we estimate that roughly 6.5% of people reporting limitations in England received home care, residential care or direct payments in 2013/14, compared to 6.2% in Wales, 8.8% in Scotland, and 10.5% in Northern Ireland.***
* Personal care now makes up 96% of all publicly funded care for recipients aged 65 or older, as council funding has not increased in line with need in the past ten years and so services have been focused on free personal care, which they are obliged to supply. The Health Foundation, ‘Free personal care: what the Scottish approach to social care would cost in England’, 30 May 2018, retrieved 1 April 2021, www.health.org.uk/newsletter- feature/free-personal-care-what-the-scottish-approach-to-social-care-would-cost-in
** From 84,450 in 2016/17 to 75,741 in 2018/19: StatsWales, ‘Adults receiving services by local authority and age group’, [no date], retrieved 1 April 2021, statswales.gov.wales/Catalogue/Health-and-Social-Care/Social- Services/Adult-Services/Service-Provision/adultsreceivingservices-by-localauthority-agegroup. This data is not available broken down by setting, so has not been included in the chart.
*** To calculate these percentages, we divided the percentage of the total population receiving home care, residential care or direct payments by the percentage of the population of each country who described their day-to-day activities as limited ‘a little’ or ‘a lot’ by health problems or disability lasting more than 12 months in the 2011 census. We analyse client numbers in 2013/14 (2013 for Scotland and Northern Ireland) as this was the last year in which all countries provided data for all three types of care. Data on direct payments in Northern Ireland is not available for this year, so we have assumed they were at the same level as in 2015.
Squeezed budgets have resulted in squeezed services in all four nations
Social care is provided to a smaller percentage of the UK population now than it was 10 years ago. Despite policy changes, such as the expansion of free personal care to all adults in Scotland in 2019 or raising the means test for residential care in Wales after 2017, spending per person in Scotland and England was cut after 2010 and has not returned to per-person pre-austerity levels in real terms. Spending in Wales and Northern Ireland has not kept up with demand.
The governments in Scotland and England cut spending by freezing grants and means test thresholds in cash terms, reducing the number of people eligible for state-funded care. The real value of the Scottish government’s weekly payment to fund personal care costs in residential care placements fell by 16% between 2002 and 2019, making it harder for people to afford residential care.[18] In England, the means test has been frozen at £23,250 since 2010/11.[19]
Local authorities have shouldered most of the responsibility for managing increasing need with falling budgets, which has led to substantial local variation – even when there are nominally national standards for provision. Eligibility for free personal care in Scotland differs across local authorities, for example. In 2012, eligibility varied from the three councils that offered care to anyone assessed as being in any need, to the two councils that offered it only to those in the highest need category.[20]
In practice, local authorities have managed smaller budgets by raising the needs threshold at which people are eligible for care and offering fewer people services, whatever the public commitments of national governments. There is some evidence that local authorities in England and Wales have also tightened eligibility requirements.[21] In Northern Ireland, trusts have reduced the amount of time that care workers spend with users: an increasing proportion of home care visits last less than 15 minutes, as carers struggle to meet their obligations to all their clients.[22] There have been similar problems in England and Wales.[23]
There is also some anecdotal evidence that local authorities in England and Scotland have delayed the number of care assessments they conduct, and/or the provision of care after these assessments.[24] In Scotland, the proportion of people waiting more than the recommended six weeks for care to be provided following an assessment tripled between 2012 and 2018, although waiting times for an initial assessment have gone down.[25]
While there is clear evidence of growing pressure since 2010 in all four nations, there is little directly comparable data on these problems and it is hard to assess exactly how access to care has been reduced. England used to publish data on the length of time between assessment and provision of care, but stopped in 2012.* Wales has not collected this data but plans to start in 2021.[26]
* However, the National Institute for Health Research is planning some welcome research into the reasons for falling social care client numbers in England over the past decade: Comptroller and Auditor General, The adult social care market in England, National Audit Office, Session 2019–2021, HC 1244, 25 March 2021, www.nao. org.uk/wp-content/uploads/2021/03/The-adult-social-care-market-in-England.pdf, p. 23.
Residential care provision has gone down everywhere
The number of people receiving state-funded residential care in Scotland declined after 2002. One academic analysis of free personal care in Scotland suggests that the provision of greater care at home allowed people to remain supported at home for longer, and resulted in fewer people entering residential care or being stuck in hospitals.[27] In so far as free personal care enables more care recipients to be supported in the community and reduces the need for expensive care in care homes, this policy could both save money and improve quality of life.
However, the number of people receiving state-funded care declined at a similar rate in England and Wales, suggesting this change was not actually due to the introduction of free personal care. The share of the population receiving state-funded care in care or nursing homes has fallen in England, Scotland and Wales – a trend observable before and after public spending cuts during the 2010s – and remained steady in Northern Ireland.
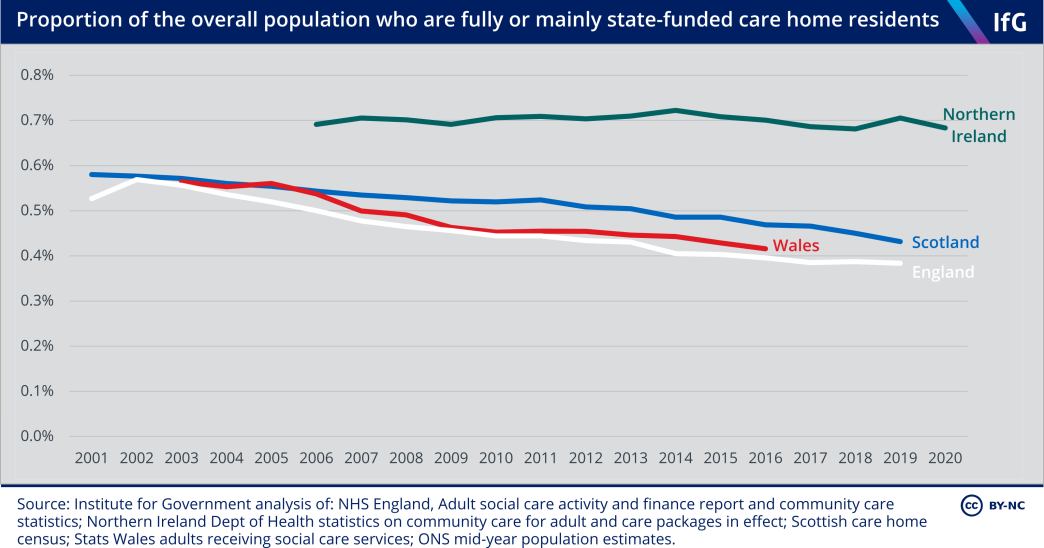
This trend is partly due to the declining availability of state provision. The limited data on privately funded places that exists shows that the total number of care home residents has declined more slowly than the number of residents with state funding.
Total care and nursing home places declined by about 1% in England between 2012 and 2019, compared to a drop of 12% in state-funded residents over the same period.** The total number of care home residents fell by 11% in Scotland between 2000 and 2019, compared to a 20% fall in the number of state-funded residents. As a result, the proportion of residential places for older people that are self-funded in Scotland rose from 27% to 34% between 2009 and 2019.***,[28]
This suggests that the number of care home residents in Scotland, both self-funded and state-funded, has fallen slightly faster than in England – but the fact that care home resident numbers are declining everywhere means it is difficult to attribute this directly to the introduction of free personal care in Scotland.
The reduction in the number of care home residents is not because the cost of state-supported residential care is rising or needs are falling.**** Instead, there have been attempts in each nation to reduce the number of care home residents who are supported by the state by shifting care into the community – both to provide more suitable care and to reduce costs.
* Some have argued that providing more at-home care might offer a net saving in the long run, by preventing expensive hospital and care home visits – for example, in Bottery S, Varrow M, Thorlby R and Wellings D, A fork in the road: Next steps for social care funding reform, The King’s Fund, May 2018, www.kingsfund.org.uk/sites/ default/files/2018-05/A-fork-in-the-road-next-steps-for-social-care-funding-reform-May-2018.pdf, p. 18.
** There were 463,590 places in CQC-registered care homes in February 2012, compared with 464,043 in February 2015, 457,271 in February 2019 and 458,900 in February 2021. Care Quality Commission, ‘Locations regulated by the CQC’ datasheets, last updated 2 March 2021, retrieved 1 April 2021, www.cqc.org.uk/about- us/transparency/using-cqc-data#directory
*** It should be noted that these numbers do not include care home residents above the means test threshold who receive free personal care payments in Scotland, as they still have to pay for most of their care costs themselves. The number of these clients increased slightly between 2009 and 2019 (by around 500), but this only partly offset the drop of around 4,000 in mainly state-funded care home residents over the same period.
**** Unit costs for state-purchased residential care have risen at or below inflation for the past decade in Scotland, Northern Ireland and Wales, but above inflation in England. On needs, the UK has an older population and higher levels of disability than it had ten years ago (see statistics on disability and the proportion of the population aged 65 or older in joint introduction to health and social care chapters). Unit costs: for Scotland, Jepson A, Adult social care and support in Scotland, Scottish Parliament Information Centre, https://sp-bpr-en- prod-cdnep.azureedge.net/published/2020/12/3/92a1d806-219e-11ea-b692-000d3a23af40/SB20-78.pdf, p. 35; for Wales: Siôn C and Trickey M, The future of care in Wales: Resourcing social care for older adults, Cardiff University Wales Fiscal Analysis, August 2020, www.cardiff.ac.uk/__data/assets/pdf_file/0019/2427400/ social_care_fi al2_aug20.pdf, p. 17; for Northern Ireland: Dept of Health community services indicators, 27 October 2020, retrieved 1 April 2021, www.health-ni.gov.uk/publications/community-services-indicators; for England: NHS England, Adult Social Care Activity and Finance reports.
England has become less generous on home care, while other countries have provided more
Reducing numbers in care homes is a positive trend when replaced with better, more intensive care in the community. Evidence on the number of care hours provided suggests this has been the case to an extent in Scotland, Wales and Northern Ireland.
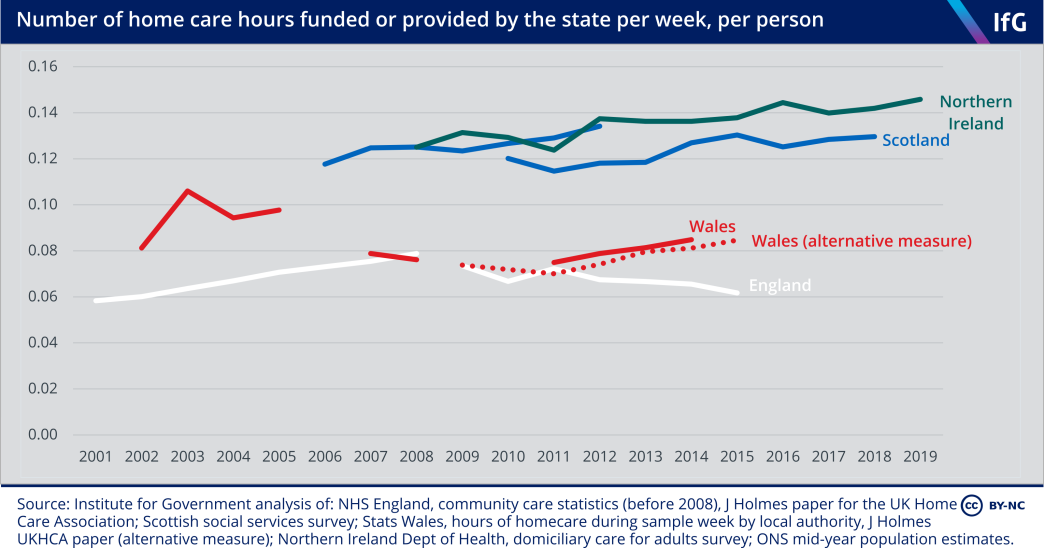
In Scotland and Northern Ireland, the average number of home care hours provided per person has been gradually rising for around 15 years.* This is in contrast to England, where home care hours fell after 2010 due to deeper cuts.
In all four countries, hours have been increasingly concentrated on fewer people, as more care-intensive clients have been accommodated at home, rather than in care homes. The number of people receiving home care has fallen in both Scotland and England since 2010, but the number of clients receiving intensive home care has increased.[29]
* Scottish statistics are drawn from two overlapping datasets. They do not include 24-hour care after 2012. It is therefore worth looking at the trends of each individual dataset, rather than the change between the two.
Scotland reduced delayed discharges a lot during the 2000s – though from a poor position
One of the aims of a good social care system is to work well with health care, by providing appropriate care in appropriate settings. One way of assessing this is to look at the speed at which patients who are ready to leave hospital are discharged. Patients may have to wait longer than necessary when care is unavailable, although delayed discharges can also result from factors outside the social care system.
Delays to hospital discharges remain a concern in all parts of the UK, both because of the cost to hospitals and because of fears that patients are not given the appropriate level of care when in hospital.[30] One of the motivations for introducing free personal care in Scotland was to improve discharges from hospitals, by making access to at- home care services easier.[31] England, Wales and Scotland made significant progress on this problem in the 2000s. England and Wales halved the number of delayed transfers between 2003 and 2011, Scotland did so by much more.[32]
Looking at delays lasting more than six weeks, Scotland’s performance is even more striking. The number of these lengthy delays fell from more than 2,000 per month in 2001 to fewer than 200 per month between 2008 and 2012.
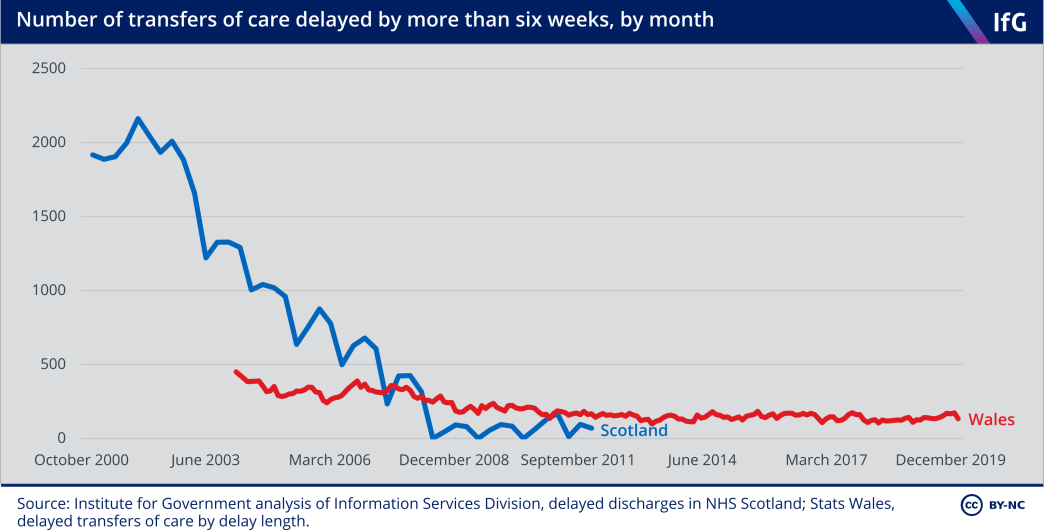
This is the clearest evidence that free personal care in Scotland had a significant impact, especially as the policy’s roll-out from 2002 clearly coincided with the dramatic improvement in delayed discharges.[33] Scotland improved faster than the other countries in this period, although it did begin with a higher rate of delayed discharges – and Scotland’s statistics do not include delays from non-acute services. Free personal care had an impact in making care easier to access, meaning that patients could be discharged from hospitals more quickly.
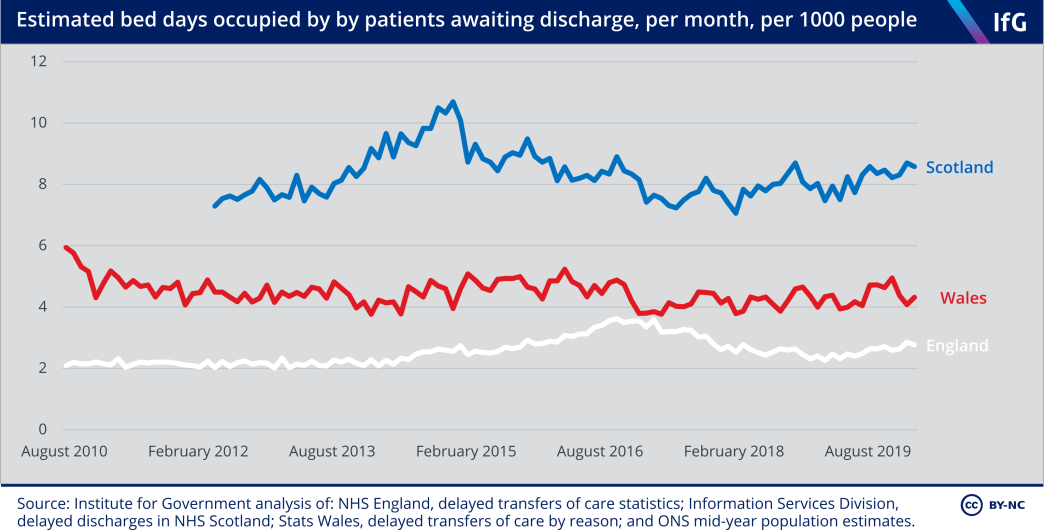
But while free personal care contributed to improvements in the 2000s, it has not resulted in a permanently superior system for tackling delayed discharges. While there are disagreements about how comparable the data is, the available evidence suggests that Scotland’s NHS loses more bed days per person to delayed discharge than England or Wales.*
Scotland improved its performance and reduced delayed discharges in the 2000s, and this seems likely to be linked to the introduction of free personal care. But Scotland’s more recent performance appears worse than that of England or Wales, suggesting other factors continue to result in a large number of people waiting to be discharged from hospital.
Some academics have suggested that Northern Ireland performs well on delayed discharges due to better health and social care integration. The limited data available suggests it may be hitting targets with more frequency.[34] But the data is collected differently to other countries and is available only through freedom of information requests, making it difficult to assess the impact of integration on discharges.
* These figures should be treated with caution for a few reasons. They represent raw numbers, so countries with more hospital admissions per person are likely to have more delayed discharges. Statistics in England include transfers from acute to non-acute settings as transfers of care, but those from Scotland do not, meaning that there are more situations where a delayed transfer could arise in England than Scotland. We also found that the statistics producers in the four nations of the UK disagreed about whether the data was comparable. The Welsh government’s Quality Report into delayed transfers of care statistics says that Scottish delayed discharge data is “broadly in line with the Welsh statistics”. Welsh government and Statistics for Wales, ‘Delayed Transfers of Care Quality Report’, November 2018, https://gov.wales/sites/default/fi es/statistics-and-research/2018-11/delayed-transfers-of-care-quality-report.pdf, p. 5. NHS England’s annual report into delayed transfers of care statistics states: “The [English] data can also be compared to delayed transfers of care data from Wales, collected by the Welsh Government and data from Scotland, collected from Information Services Division (ISD) Scotland.” NHS England, ‘Delayed Transfers of Care Statistics for England 2018/19’, June 2019, www.england.nhs.uk/statistics/wp-content/uploads/sites/2/2019/06/2018-19-Delayed-Transfers-of-Care-Annual-Report.pdf, p. 18. Scotland’s Information Services Division, however, states: “Figures presented in this publication are not directly comparable with other UK countries, due to differences in definitions and data reporting.” Information Services Division, ‘Delayed discharges in NHS Scotland monthly’, 2 March 2021, retrieved 1 April 2021, https://beta.isdscotland.org/find-publications-and-data/health-and-social-care/delayed-discharges/delayed-discharges-in-nhsscotland-monthly
Many people pay for their own care or go without in all four nations
Another measure of social care performance is how many people in need do not receive state-funded care, and have to pay for their own care, get help from relatives or friends, or go without care. The social care system is not intended to be universally free at the point of use, unlike the NHS, so the extent of private funding and unpaid care does not necessarily indicate poor performance – but it does highlight the consequences of the different systems.
There is little data collected on the volume of privately funded social care. The National Audit Office estimates the market in England is worth about £8.3bn – around half the size of the publicly funded care market, much of it paid for by care recipients’ pensions, personal savings and in some cases the sale of a house.[35] Self-funders pay much more for their care than state-funded care recipients, meaning that self-funders subsidise state-funded clients.[36]
To estimate total paid care in each nation, both that funded by the state and by individuals, we have looked at the estimates for the total number of care staff – which serve as a useful proxy for the amount of professional care provided in each country. Scotland has the largest number of paid care staff, with nearly 11 full-time equivalent carers for every 100 people aged 65 and over. England is second, despite the lowest state spending on social care, and Northern Ireland has the lowest overall care provision despite having higher needs and state spending per older person than Scotland or England.
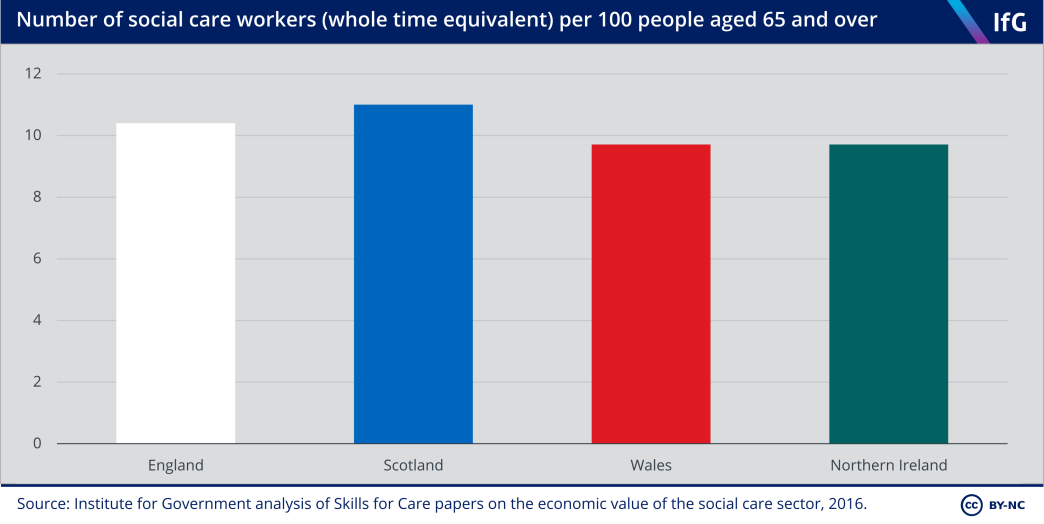
This suggests that the extent of paid care reflects the wealth of countries as well as the generosity of state-funded care. So the higher proportion of paid care staff in Scotland indicates the generosity of state-funded care in Scotland – there is more paid care provision in Scotland than in England, despite Scotland being on average poorer.
Unpaid care and unmet need make up the other residual of care not provided by the state or funded privately. Wales and Northern Ireland have the largest share of people who report providing unpaid care, while Scotland has the smallest.
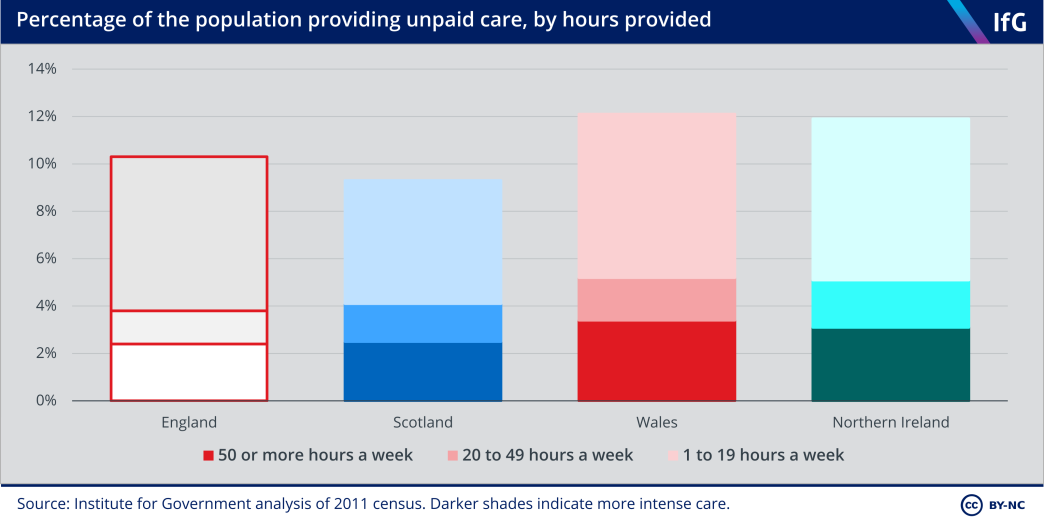
This may be because free personal care in Scotland reduced the need for unpaid carers through generous free provision, although its introduction was associated with a small increase in unpaid care – possibly because more people receive care at home (where they can still receive unpaid care as well) rather than in care homes.[37]
Social care data is poor and prevents firmer evaluation of performance
Publicly available data clearly shows that there is more state-funded home and residential care in Scotland and Northern Ireland, most likely because of their more generous provision for older people. Despite some substantial divergences in policy, and growing need for care, all nations have restricted supply of care due to shrinking or static budgets.
But it is much harder to analyse differences in performance, such as efficiency and effectiveness, because of a shortage of almost any comparable data,[38] especially stark when set against the available statistics for schools and the NHS.
Cross-UK comparisons are valuable as they provide context on country-level trends and allow analysts to assess what is the result of policy changes and what is the result of other factors. Comparable statistics would allow governments to analyse what has – and has not – worked. Better data is vital to understanding and improving the performance of services, and for devolution to really work as a ‘policy lab’ for governments to learn from one another.[39]
Covid-19 has drawn attention to the serious consequences of poor-quality data, as authorities lacking basic information on the number of care providers and recipients have struggled to keep track of cases, deaths and vaccinations among care home residents.[40] The pandemic should act as a catalyst to improve social care data.[41]
The Westminster government acknowledged the need for better social care data in its 2021 health and social care white paper, Integration and Innovation,[42] but the white paper did not address the comparability of statistics.
We hope that this work acts as a prompt to improve the quality and comparability of social care statistics, and think that the following areas should be priorities for improvement:
- Northern Ireland. Northern Ireland provides free home care and its social care system is formally integrated with its health system. Both are precedents that England, Scotland and Wales might want to follow – but a lack of data means that the consequences of these policy choices in Northern Ireland are much less well understood than the introduction of free personal care in Scotland, to the detriment of policy makers. Northern Ireland should expand the data it collects on social care and publish that which it collects publicly, as statistics on delayed discharges are collected but not available.*
- A single source of truth on comparability. The organisations that publish social care statistics in the four nations do not agree on whether statistics like those for delayed discharges are comparable across the UK. This leads to a lack of clarity on how well different systems are performing – for instance, a Scottish parliamentary committee received evidence praising Scotland’s good performance compared to England on delayed discharges in 2019, despite research in 2017 suggesting Scotland’s performance appeared worse.[43] The Government Statistical Service should work to get countries to agree on whether social care statistics are comparable, and publicly explain what the differences are.
- Comparable care client numbers. It is difficult to compare the number of state- funded care users in the four nations. If possible, the four nations should record the number of people accessing different types of state services in the same way, which would allow more accurate comparison of the unit costs, efficiency, and reach of different systems.
- Privately funded and unpaid social care. Data on services that are paid for privately or provided by unpaid carers is poor, which hampers assessment of the impact of different systems on those in need of care, rather than just those receiving publicly funded care.
- More evidence on ‘rationing’ of care. There is evidence that access to social care has been reduced in all four nations over the past decade. But the four nations have published limited data on the length of home care visits (except in Northern Ireland), or on gaps between assessment and provision of care (except in Scotland). More data to assess this – whether on the amount of care provided or assessment waiting times – would give us a better way to compare how the four countries are managing with tight budget limitations and rising need. Improving data in these five areas would much improve the public understanding of social care in the four nations, and allow governments to make better – and better- informed – decisions. This should be a priority for both statisticians and policy makers, as a way to improve the performance and cost-effectiveness of these crucial services.
* This data has been subject to freedom of information requests in the past, for instance from the Belfast Telegraph. Smyth L, ‘Nearly 48,000 delayed from hospital discharge in Northern Ireland at cost of £63.5m’, Belfast Telegraph, 26 August 2019, retrieved 1 April 2021, www.belfasttelegraph.co.uk/news/northern-ireland/ nearly-48000-delayed-from-hospital-discharge-in-northern-ireland-at-cost-of-635m-38435071.html

The school systems in the four nations of the UK have been different since well before devolution in 1999.
Schools
The school systems in the four nations of the UK have been different since well before devolution in 1999, and there has been further divergence since. England put greater emphasis on schools’ accountability to parents through league tables, and later gave schools more autonomy – changes not adopted in Scotland, Wales or Northern Ireland. Indeed, Wales initially did away with standardised testing in primary schools and league tables in secondary schools, although partially reversed these decisions in the 2010s after the removal of league tables proved detrimental to pupil attainment.
Under the Conservative–Liberal Democrat coalition, the UK government reformed the English school curriculum to emphasise subject-specific knowledge. Around the same time, the Scottish Curriculum for Excellence put greater emphasis on applying knowledge, an approach Wales is also about to adopt.
There are big differences in educational attainment in the four nations. Pupils in Wales consistently score lower than pupils in other nations, even after controlling for pupils’ socioeconomic backgrounds. Scottish pupils’ attainment declined after the poor implementation of the Curriculum for Excellence, though it is hard to say whether the curriculum itself or poor implementation was to blame.
This chapter assesses compulsory schooling for children aged between 5 and 16 between 1999 and 2019. It does not cover any post-16 education such as A-levels and Highers, further education, or university.
Schools in the four nations
There are longstanding differences between schools in the four nations of the UK
Table 5.1 Schools policies in 2020
|
|
Secondary school exams |
Percentage of pupils attending selective secondary schools |
Percentage of pupils attending independent schools |
Percentage of pupils attending academies |
Percentage of pupils attending a religiously affiliated school |
Percentage of pupils attending schools where English is not the primary medium of education |
|---|---|---|---|---|---|---|
| England | GCSE | 5% | 7% | 50% | 24% | N/A |
| Scotland | Nationals 4/5s | 0% | 4%* | N/A | 18% | 1% |
| Wales | GCSE | 0% | 2% | N/A | 14%** | 23%*** |
| Northern Ireland | GCSE | 43% | 0.2% | N/A | 91% | 2% |
Source: Institute for Government analysis of school pupil census data in England, Scotland, Wales and Northern Ireland.
* Scotland’s pupil census only includes state-funded pupils. Statistics on independent school pupils in Scotland are sourced from the Scottish Council of Independent Schools. See: SCIS, ‘facts and figures’, No date, retrieved 14 April 2021, www.scis.org.uk/facts-and-figures/#:~:text=SCIS%20uses%20the%20information%20collected,4%25%20of%20pupils%20in%20Scotland
** StatsWales does not publish data on the religious affiliation of schools. In 2007 the Welsh government stated that 14% of Wales’ maintained schools had “a religious character”. See: Department for Children, Schools and Families, Faith in Education, Welsh Government, 2007, p. 16, http://hwb.gov.wales/api/storage/fbfe21ab-0489-4696-9c13-8c214d56f944/faith-in-education.pdf
*** This includes pupils at fully Welsh-medium, dual stream and bilingual schools. Only 16% of Welsh pupils attend Welsh-medium schools, where they are taught in Welsh.
Children in all four nations have had compulsory education between ages 5 and 16* since 1972** but they are taught and assessed at different times. Until the introduction of the exams for the new Curriculum for Excellence in 2014, Scottish pupils sat compulsory exams (Scottish Standard Grades) over two years at age 14/15, in contrast to GCSEs – which pupils in England, Wales and Northern Ireland sit in one year, at age 15/16.[1]
Pupils in England and Wales learned similar curriculums before devolution. The Education Reform Act 1988 introduced a national curriculum – a set of subjects and standards used by primary and secondary schools to ensure children learned the same things – in both England and Wales.[2],*** The Act did not apply to Scotland, which has instead followed non-statutory curriculum guidelines, before and after devolution, meaning that Scottish local authorities and schools have had greater freedom over what to teach.[3]
More recently, the introduction of academies has given schools in England greater freedom over what they teach. These are state schools that do not have to follow the national curriculum**** and also have more control over their admissions and budgets than local authority-maintained schools.[4] Academies only exist in England. First introduced in 2002,[5] the number of academies expanded rapidly after the coalition government encouraged high-performing maintained schools to convert to academy status in 2010. As of January 2020, 37% of state-funded primary pupils and 77% of state-funded secondary pupils in England attend academies.[6]
The 1988 Act also gave parents in England, Wales and Northern Ireland a choice about which state school to send their children to for the first time, creating incentives for schools to compete for pupils. Parents in all three nations can apply to any school of their choice and can only be refused if a school is oversubscribed, whereas children in Scotland are expected to attend a school within their catchment area.
In practice, however, these systems work similarly. When a school in England, Wales or Northern Ireland is oversubscribed, schools apply over-subscription criteria that are normally based on distance between a child’s home and school. Evidence from the UK as a whole suggests that school choice has had limited effect on pupil attainment,[7] while the proportion of disadvantaged pupils in the best performing schools is similarly low in England, Scotland and Wales.[8]
The organisation of secondary schools in the four nations is also very different. While England, Scotland and Wales now offer mostly comprehensive (non-selective) education, Northern Ireland retains widespread selection at age 11. In 2020/21, 43% of secondary school pupils in Northern Ireland attended a grammar school – compared to only 5% in England and none in the other two nations. Almost all pupils in Northern Ireland (91% in 2019/20) also attend schools which are segregated by religion, as Catholic and Protestant communities maintained their own schools after the partition of Ireland.[9],***** Many schools are also segregated by sex.[10] There are religiously affiliated schools in England, Wales and Scotland, but they make up a far smaller share of schools than in Northern Ireland.
In contrast to the other nations, around a quarter of pupils in Wales are taught in Welsh-medium, dual stream or bilingual schools, where pupils are taught most subjects at least partly in Welsh. Pupils in Welsh-medium schools achieve higher GCSE scores than pupils in English-medium schools after adjusting for differences in pupil demography and socioeconomic background.[11] In contrast, pupils in Welsh-medium schools achieve lower scores in the Programme for International Student Assessment (PISA) tests than pupils in English-medium schools after adjusting for differences in pupil demography and socioeconomic background. The biggest variable in PISA is whether pupils take tests in English or Welsh, suggesting that the lower performance of pupils from Welsh-medium schools on those tests is driven by the language of assessment.[12] There are schools in Scotland and Northern Ireland that teach in Scottish and Irish Gaelic respectively, but they make up a far smaller share of schools compared to Welsh-medium schools in Wales.
The four nations have approached education policy making differently. England has adopted a much more centralised and directive model than in the other nations, for example introducing top-down national literacy and numeracy strategies in 1997/98 and 1999/2000 that required primary schools to implement daily literacy and numeracy hours.[13] In contrast, Northern Ireland had a more light-touch strategy, Wales allowed local authorities to lead their own local literacy and numeracy strategies, and Scotland had no specific literacy or numeracy strategies at all.[14]
England followed much the same approach to implementing synthetic phonics – a method of teaching reading and writing that starts by teaching letter sounds as the basis of pronunciation – after the 2006 independent Rose review concluded that “synthetic phonics offers the vast majority of young children the best and most direct route to becoming skilled readers and writers.”[15] The review recommended that the government provide schools with clear guidance on teaching pupils how to speak and listen in a national strategy and that “high quality, systematic phonic work…should be taught discretely” – which the UK Labour government implemented in England. The coalition government introduced a test – statutory phonics screening checks – in 2011[16] and made it a legal requirement for all local authority-maintained primary schools to teach synthetic phonics to pupils in year one and two as part of the new national curriculum in 2013.[17] In contrast, Scotland did not mandate schools to teach synthetic phonics, out of concern that centrally imposed reforms would be ineffective.[18] This is despite the fact that evidence on the benefits of teaching synthetic phonetics in the Scottish county of Clackmannanshire had been heavily influential in England’s reforms.[19] Wales, likewise, did not commission a review on whether to adopt synthetic phonics when England did in 2005 (and has not mandated phonics teaching)[20] and Northern Ireland has never mandated teaching synthetic phonics in schools.
Following devolution, the four nations have followed increasingly different education policies, with the biggest differences in how schools are organised and who they are accountable to.
* Between 4 and 16 in Northern Ireland.
** 1973 in Scotland.
*** The Northern Ireland government introduced a national curriculum in 1992, which was broadly similar to the curriculum in England and Wales. See: BBC Northern Ireland Schools, Teacher’s resources: NI Curriculum Overview, No date, retrieved 14 April 2021, www.bbc.co.uk/northernireland/schools/pdf/NIschools_curriculumOverview.pdf
**** Academies still have to teach a “broad and balanced curriculum” including English, maths and science and religious education. See: Department for Education, ‘National curriculum’, GOV.UK, 2013, www.gov.uk/ government/collections/national-curriculum
***** Most Catholic pupils attend ‘maintained’ schools, and most Protestant pupils attend ‘controlled’ schools. See: Gallagher T, Education, Equality and the Economy, Queen’s University Belfast, 2019, pp. 3-5, www.qub.ac.uk/home/Filestore/Filetoupload,925382,en.pdf
England and Wales adopted different school accountability and testing policies in the 2000s
The clearest divergence in the first decade after devolution was between England and Wales, which previously had similar school systems.[21] The Welsh government emphasised the role of local authorities in education and the importance of “learning through play” in its 2001 education white paper, The Learning Country.[22]
School accountability to parents became one of the clearest differences. While both published national school league tables publicly after 1992,[23] Wales changed course after devolution and stopped publishing league tables in 2002.[24],* Jane Davidson, the then Welsh Labour education secretary, argued that league tables were a divisive administrative burden on schools.[25]
Wales likewise scrapped primary school tests for seven-year-olds in 2002,[26] and primary school SAT exams for 11- and 14-year-olds between 2002 and 2005.[27] Removing standardised tests may have left Welsh pupils less well-equipped to do well in exams in later years. A study from 2012 found that “Welsh pupils who had not been exposed to regular standardised tests tended to lack even the ability to navigate successfully through test booklets.”[28]
* Northern Ireland stopped publishing league tables in 2001. See: BBC News, ‘School league tables scrapped’, 10 January 2001, retrieved 14 April 2021, http://news.bbc.co.uk/1/hi/education/1109516.stm
England expanded school autonomy in the 2000s
While Wales removed league tables, England continued to emphasise schools’ accountability to parents and school choice. In contrast to Wales, England’s policy emphasised parents-as-consumers rather than teachers-as-producers.[29]
The biggest policy change was the conversion of poorly performing local authority maintained-schools into ‘sponsored academies’, which began in 2002. To become an academy, a team of independent sponsors working with the local authority where the school operated would submit a proposal to the secretary of state for education. If they approved, the sponsors would take over the school and appoint an independent board of governors to manage it.
An evaluation of the 130 schools that became sponsored academies between 2002 and 2009 found they increased performance – measured as the total exam points of the best eight exams of individual year 11 pupils – faster than similar maintained schools, and that the improvement was biggest in schools that had been academies for the longest.[30] This suggests that schools that had more autonomy for longer improved results the most, though what academy freedoms might account for improvements is unclear. None of Scotland, Wales or Northern Ireland introduced academies.
Wales reversed some of its accountability and testing policies in the 2010s
In the second decade after devolution, Wales began a major school improvement programme,[31] reversing some decisions made in the 2000s. The governing Labour– Plaid Cymru coalition was driven to act after the 2009 PISA test of pupils’ ability to implement and apply knowledge in reading, maths and science showed that Welsh pupils were achieving below average – and worsening – scores.[32]
The Welsh government introduced a series of reforms including: combining early years education and the first two compulsory years of school in a foundation phase of education in 2010; creating four regional consortia to improve school improvement services in 2012; raising entry requirements to initial teacher training to improve the quality of teaching in 2014; and creating an Education Workforce Council in 2014 to improve the quality of professional development for existing teachers.[33]
In 2011, the Welsh government introduced banded league tables. These tables grouped schools together according to a range of indicators such as attendance rates, GCSE results, relative improvement and the proportion of students on free school meals.[34] The government later adjusted the tables in 2015 to make judgments based on school performance over three years rather than one.[35] Wales also reintroduced standardised reading and numeracy tests for pupils aged 7 to 14 in 2013.[36]
The return to league tables stemmed from the difficulty of identifying, and holding to account, poorly performing schools. In a 2011 speech introducing the league tables, the then education minister Leighton Andrews acknowledged these concerns and admitted that “people need information on how their schools are performing”.[37] According to David Reynolds, a senior policy adviser to Andrews, there was a lot of internal discussion within the Welsh government about the need for transparency in school performance between 2010 and 2012.[38]
England expanded school autonomy after 2010
While Wales adopted an accountability regime closer to England’s, the UK coalition and then Conservative governments continued to expand the academies that had begun under New Labour in the 2000s. The Academies Act 2010 allowed all schools to request academy status and gave the Department for Education a statutory duty to direct all maintained schools with an Ofsted Inadequate rating to convert to academy status.[39] The majority of schools that became academies after 2010 were ‘convertor academies’ – maintained schools typically rated Good or Outstanding by Ofsted before conversion.
Unlike sponsored academies, the evidence to date suggests that converting from a school to an academy makes, on average, no difference to pupil attainment in schools rated Good or Satisfactory before conversion but slightly boosts attainment in Outstanding schools.[40]
In 2010, the UK coalition government also introduced free schools in England – where, subject to vetting, anyone can propose setting up a new school and receive the same per-pupil funding as a local authority-maintained school. In theory, free schools were supposed to increase competition with poorly performing local schools and incentivise them to improve. Local parents could set up a free school if they were dissatisfied with the quality of maintained schools, for instance. However, capital funding to set up new schools was limited after 2010 and free schools tended to be set up in areas without enough school places[41] – not necessarily in areas served by poorly performing schools. An analysis in 2017 found that new primary free school places were as likely to be set up in high-performing areas as low-performing areas. It also found that new secondary free school places were more likely to be set up in high- performing areas.[42] There is not yet much evidence on whether free schools improve pupil attainment. The Education Policy Institute found no notable difference in the Ofsted inspection ratings of free schools and other schools.[43]
Scotland and England introduced vastly different curriculums in the 2010s
Scotland made fewer changes in the 2000s. The Labour–Liberal Democrat coalition government at Holyrood published the Curriculum for Excellence reform proposals in 2004, which were subsequently accepted by all the main political parties, albeit with limited parliamentary scrutiny.* This laid the foundation for a big divergence in curriculum after 2010.
Scotland implemented the Curriculum for Excellence in 2010/11. The curriculum is competency-based[44] in that it puts greater emphasis on applying knowledge and less on subject-specific knowledge than traditional curriculums.[45] It contains, for example, little prescribed content, as it is based on outcomes. The first cohort of secondary pupils taught under the new curriculum sat new qualifications – National 4s and National 5s – in 2014, which replaced the old Standard Grades. The new qualifications were designed to fit the new curriculum: they were only a year long and contained more coursework than the Standard Grades they replaced.[46]
Northern Ireland also emphasised competencies in the new curriculum that schools began to teach from 2007[47] – but did not alter its curriculum or exams as radically as Scotland did. In 2015, Wales began reforming its curriculum, putting more emphasis on competencies and less on subject-specific knowledge. These reforms will bring the Welsh school curriculum closer to Scotland – Graham Donaldson, one of the authors of the Scottish Curriculum for Excellence, led the initial Welsh review.[48]
Welsh schools are due to start teaching the new curriculum in 2021, although there are some concerns that schools will not be ready to implement it in time[49] – particularly given the disruption caused by the pandemic. In contrast, the new English national curriculum brought in in 2014[50] put more emphasis on academic rigour and subject- specific knowledge.[51]
The Scottish government stopped collecting some performance data that would have allowed it to judge whether the new curriculum was effective.[52] Scotland also stopped participating in two international surveys of education performance – the Trends in International Mathematics and Science Survey (TIMSS) and Progress in International Reading Literacy Study (PIRLS) – after 2007.[53] In a review of Scottish education in 2015, the OECD found that there were few “large-scale research or evaluation projects on [the Curriculum for Excellence] by either the universities or independent agencies” and that national assessment arrangements did not provide enough information for policy makers to understand how well the curriculum was working, or how to improve it.[54]
In 2019, the Holyrood Education and Skills Committee criticised the Scottish government for abandoning the Scottish Surveys of Literacy and Numeracy – a test of a representative sample of seven–eight-, 10–11-, and 12–13-year-old Scottish pupils.[55] The surveys, which ran from 2011 to 2016, had provided a way to assess pupil attainment and showed statistically significant falls over time in the percentage of pupils performing at or above expected numeracy and literacy levels in most assessments.** Lack of data has been a real problem for those delivering services – including teachers and civil servants – as well as making scrutiny harder.
The decline in Scottish pupils’ attainment in PISA since 2012 suggests that the introduction of the new curriculum was a factor in the decline – although exactly how important is hard to determine. The OECD is currently reviewing the Curriculum for Excellence and will publish a report in June 2021, which should provide useful information about its impact.[56]
* The Curriculum for Excellence was developed incrementally across both the Labour-Liberal Democrat coalition and SNP governments. It did not require any legislative approval, which means the Scottish parliament has had limited opportunities for scrutiny. See: Sharratt N, ‘20 years of scrutinising school education policy – a learning experience’, blog, The Scottish Parliament, December 5 2019, retrieved 14 April 2021.
** The Scottish government justified removing the surveys because it replaced them with teacher assessments of pupils’ progress called ‘Achievement of Curriculum for Excellence Levels’. These assessments provided more granular data for schools and local authorities but they were not comparable to the previous literacy and numeracy survey, or standardised such that they were comparable over time or between schools or local authorities. See: Paterson L, ‘Scottish National Standardised Assessments’, blog, Reform Scotland, 14 November 2018, retrieved 14 April 2021, https://reformscotland.com/2018/11/scottish-national-standardised-assessments-professor-lindsay-paterson
School spending and resources
Scotland spends the most per pupil
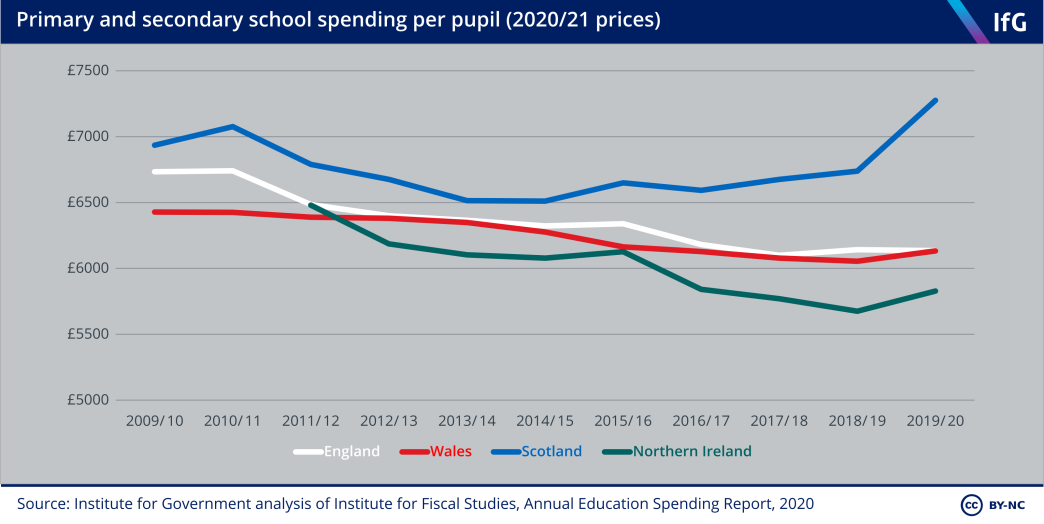
In the 2019/20 school year, the last to commence before the pandemic, school spending per pupil was highest in Scotland and lowest in Northern Ireland. All four nations increased spending on education in the 2000s,[57] but the lack of consistent data available on the four nations before 2010 makes analysis of the years 2000–09 hard.*
England, Scotland and Wales all cut spending per pupil in the first half of the 2010s but diverged after 2015. England and Scotland cut spending per pupil sharply (in each case by 6.1%) while Wales only cut spending by 2.4% between 2010 and 2015. In the second half of the decade Scotland reversed course and increased spending, while both England and Wales slowed – but did not stop – cuts to per pupil spending. Scotland was the only one of the four nations to spend more per pupil at the end of the decade than at the beginning. Scotland increased spending rapidly between 2018/19 and 2019/20 as a result of the Scottish government’s decision to increase teacher pay by 13.5% in cash terms between 2018 and 2020,[58] partly to avert a teaching union strike.
Increasing teacher salaries could help recruit and retain more teachers, and possibly increase Scottish pupils’ attainment in future. There is not much data available on teacher recruitment targets or retention rates in Scotland, but the SNP has not managed to keep its 2007 election pledge to reduce P1–3 (five–six, six–seven, and seven–eight-year-old) class sizes to 18 or less[59] – suggesting it has not been able to recruit as many teachers as it aimed to. In September 2019, the last pre-pandemic data available, just 11% of P1–3 classes had 18 or fewer pupils – compared to 15% in September 2008.[60]
Even if Scotland does not have recruitment or retention problems, higher teacher wages could increase pupil attainment. One paper analysing the competitiveness of teacher salaries in England found that paying teachers substantially below local comparable private sector jobs was associated with a reduction in average school performance in exams.[61] However, it is not clear if Scottish teachers’ wages are currently far below comparable countries, or if raising them this quickly will improve pupil attainment. All else being equal, Scotland’s higher spending should translate into higher educational attainment** – although it does not (see School Performance section).
* Neither the Public Expenditure Statistical Analyses nor individual nations’ data on schools spending are consistent before 2010. The local authority school spending data available for England, Wales and Northern Ireland suggests that spending did rise quickly, however, in all three nations. Spending per pupil in England rose after 1998/99, spending on schools in Scotland rose between 2004/05 and 2008/09, and spending on schools in Wales between 2005/06 and 2009/10. See: Sibieta L, 2020 Annual report on education spending in England: schools, Institute for Fiscal Studies, p. 11, www.ifs.org.uk/uploads/2020--annual-report-on-education-spending-in-England-schools.pdf; StatsWales, Education revenue outturn expenditure, by service (£ thousand), No date, Welsh Government, retrieved 13 April 2021, https://statswales.gov.wales/Catalogue/Local-Government/Finance/Revenue/Education/Pre2014/educationrevenueexpenditure-by-service; Scottish data provided by Scottish government.
** There is a lot of academic evidence that higher school spending improves pupils’ educational attainment, lifetime earnings and likelihood of participating in higher education, particularly for the most disadvantaged pupils. See: Sibieta L, Review of School Spending in Wales, Welsh Government, 2020, pp. 18-19, https://gov.wales/sites/default/files/publications/2020-10/review-of-school-spending-in-wales.pdf
Scotland has the most teachers per pupil
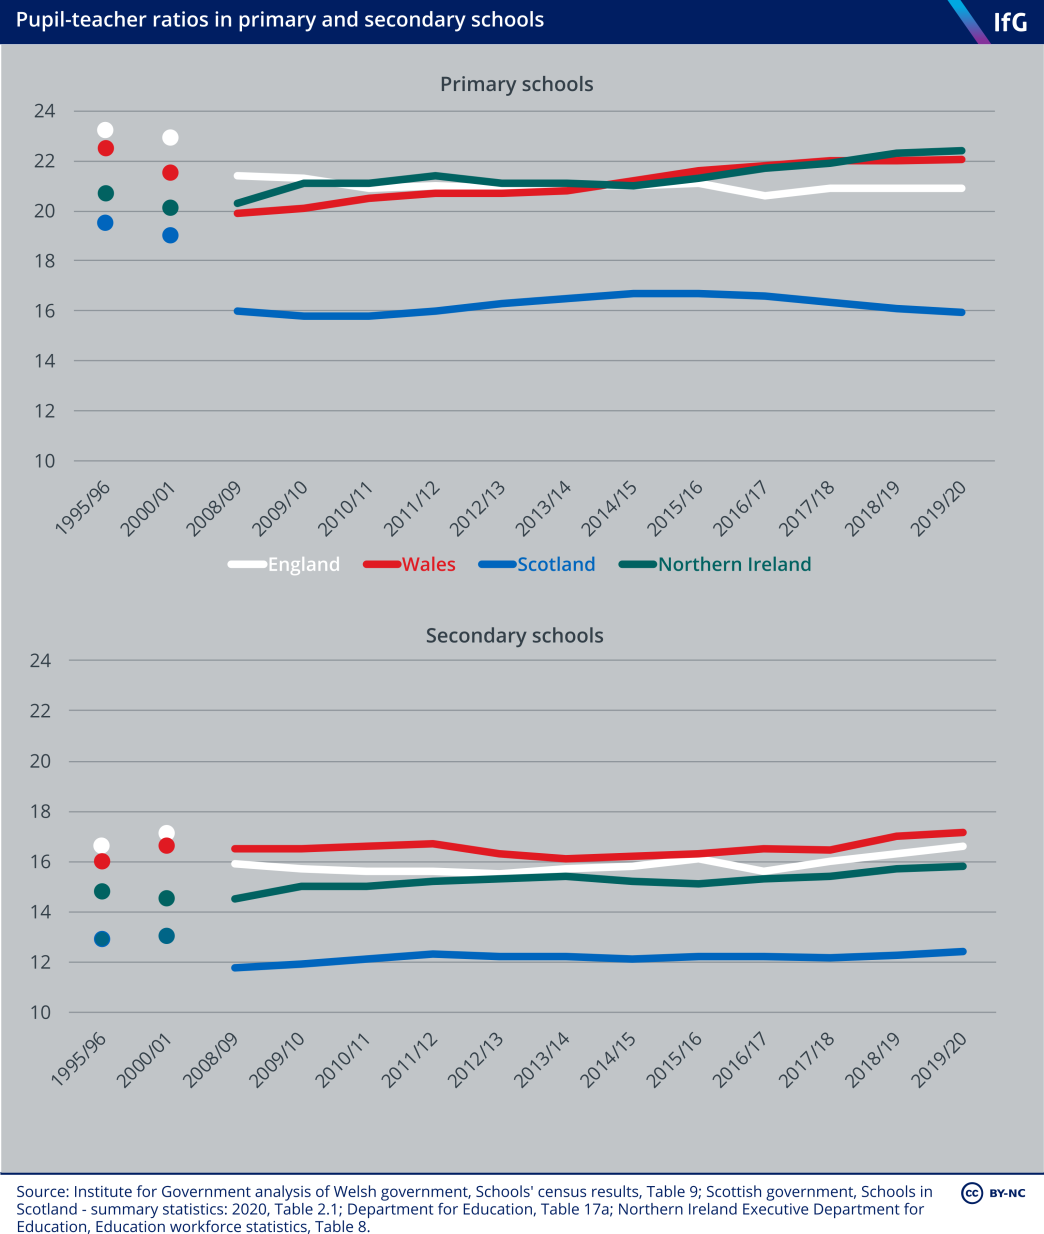
Differences in levels of spending translate into differences in the resources used to run schools – in particular, the number of teaching staff. In England, Scotland and Wales most money spent on schools pays staff salaries. In England, three quarters of school spending pays for staff costs and most of that goes on teaching staff – approximately 65% of total school spending goes on teachers, supply teachers and teaching assistants.[62] In Scotland, 75.5% of the schools budget is spent on staff (and 52% on teachers)[63]; in Wales the figure is 65%.[64],*
Scotland has consistently employed the most teachers per pupil, suggesting that Scottish pupils have the most interaction with teachers. This may be because Scotland has more small, rural schools rather than being a policy choice in itself. Scotland has the fewest people per square km of all four nations and has fewer pupils per school than England and Wales[65] (if not Northern Ireland). There is some – albeit weak and mixed – evidence[66] that smaller class sizes boost pupil attainment – although they are by no means the most effective way of doing so.
* These figures are indicative and are not directly comparable because staff and teaching staff are defined differently in each nation. Northern Ireland does not provide a breakdown of school spending.
School performance
Comparing the performance of schools across the UK is difficult. Schools have a range of functions – from teaching children specific skills and knowledge to supporting children’s social and emotional development – only some of which are measurable in a meaningful way.
Exam grades are one way to evaluate national performance. Schools are, more often than not, judged on headline exam results. But even comparing performance in the same nation over time is problematic due to grade inflation. The absolute attainment that exam grades represent may change over time: a passing grade in one year may reflect a different level of educational attainment from a passing grade in another year.[67] There has been an increase in pupil performance in national exams in all four nations since 2000 but this is not replicated in international tests.[68]
Comparing performance across the four nations is further complicated by the fact that exams are different in each nation, as is the method for judging attainment. In England and Wales, where pupils sat similar exams in the 2000s (albeit under different exam boards) comparisons of GCSE results show that the percentage of pupils achieving the threshold – five A*–C GCSEs or equivalent qualifications – in England was consistently higher than in Wales after 2002.[69] However, England counted vocational qualifications such as BTEC diplomas (specialist work-related qualifications)[70] whereas Wales did not. Comparisons of pupils achieving the threshold only show that English pupils were more likely than Welsh pupils to take vocational equivalents in the 2000s. Excluding vocational equivalents and just looking at GCSEs shows that about the same proportion of English and Welsh pupils achieved five A*–Cs. Breaking down even further to look at the same GCSEs shows that pupils in Wales consistently perform slightly worse than pupils in England[71] – matching the PISA findings for reading and maths described below.
Because of these problems, rather than trying to compare exam results across the UK, we instead compare nations’ performance on international tests – specifically, PIRLS and TIMSS, and PISA scores. Pupils in each nation sit the same test around the same time, so the results are more comparable than grades for exams sat in each nation.* Pupils in Wales whose primary language is Welsh rather than English can take the test in Welsh. Schools decide which language test pupils sit but are told that pupils should take the test in their language of instruction.[72]
PISA measures pupils’ ability to implement and apply knowledge in reading, maths and science. PIRLS and TIMSS are curriculum assessments and instead assess whether pupils have specific reading, maths and science knowledge and skills. We mostly use PISA because Wales does not participate in PIRLS or TIMSS, and Scotland and Northern Ireland have only participated in some waves of PIRLS and TIMSS. Table 5.2 summarises the data available for each nation for PISA, PIRLS and TIMSS.
Table 5.2 International survey tests taken in each nation
|
|
Programme for International Student Assessment* |
Progress in International Reading Literacy Study[73] |
Trends in International Mathematics and Science Study[74] |
|---|---|---|---|
| England | 2006 – 2018 | 2001 – 2016 | 1995 – 2019 |
| Scotland | 2006 – 2018 | 2001 – 2006 | 1995 – 2007 |
| Wales | 2006 – 2018 | - | - |
| Northern Ireland | 2006 – 2018 | 2011 – 2016 | 2011 – 2019 |
* Pupils in England, Wales and Northern Ireland have been assessed in the autumn since 2006, although pupils in Scotland were only assessed in the autumn from 2018. Between 2006 and 2015, they were assessed in March or April. We do not use the 2000 and 2003 data because: nations in the UK did not reach the level of test responses deemed necessary for a robust sample by the OECD in 2000 and 2003; the date at which the test took place was moved to earlier in the academic year in England and Wales (and Northern Ireland in 2006); and in 2003, Welsh pupils, who on average have significantly lower levels of achievement in the test, were included in the English sample. See: Organisation for Economic Co-operation and Development, PISA 2009 Results: Learning Trends Volume V, 2010, pp. 26, 30, www.oecd.org/pisa/pisaproducts/48852742.pdf
Attainment in these international tests reflects not only schools’ effectiveness but also differences in pupils’ needs and motivation, among other things. Many studies have demonstrated that socioeconomic background has a big effect on educational attainment.[75] Therefore, it is possible that the differences in educational attainment between the nations may just reflect differences in pre-school context and pupils’ environment outside school.
The Millennium Cohort Study – a longitudinal study which repeatedly surveyed children born in England, Scotland, Wales and Northern Ireland in 2000 – provides one way to test this theory. The study suggests that there are no major differences in attainment between children in each nation before they start school.[76]
One of the simplest ways to assess performance is to compare scores in maths, reading and science over time. PISA scores are set in relation to the variation in results observed across pupils tested in all nations and are scaled to fit approximately normal distributions. In the reading, maths and science tests, the mean average scores are around 500 points.[77]
However, some caution is needed in interpreting the results of standardised international tests. PISA tests a sample of pupils, rather than all of them. Therefore, small differences between nations or changes in attainment from one year to the next may simply reflect statistical uncertainty caused by sampling variation.[78] There was also a change to the way in which the survey was administered in 2015 – from paper- based to computer-based – which could have had a sizeable impact on results.[79]
With these caveats in mind, the PISA results for the four nations show big differences in levels of attainment and trends over time.
Reading skills are significantly worse in Wales
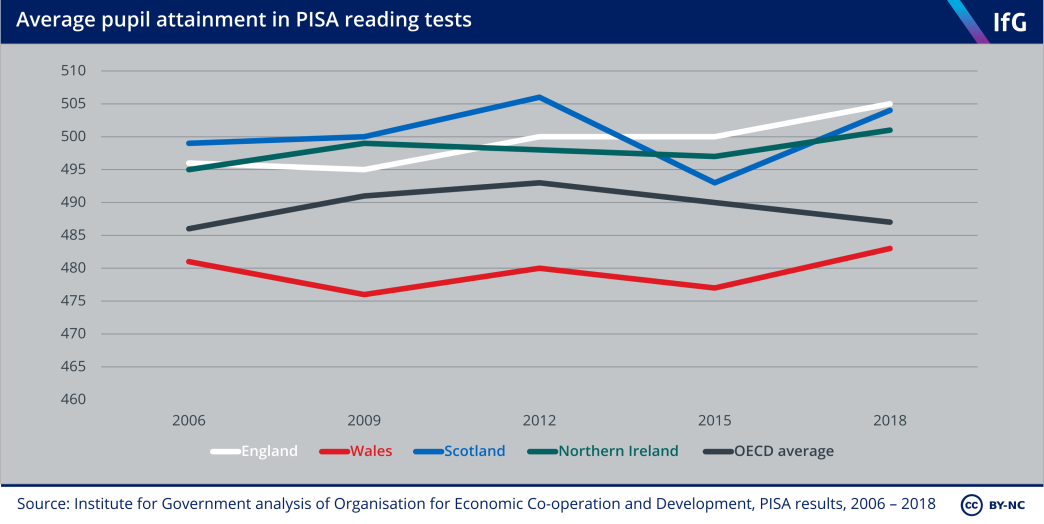
There has been no statistically detectable difference in average reading scores between pupils in England, Scotland and Northern Ireland in each year between 2006 and 2018. In 2018, all three scored significantly above the OECD average. In contrast Welsh pupils consistently score, on average, around 20 points below pupils in Northern Ireland. Wales has a high proportion of low achievers and a low proportion of high achievers.
The OECD estimates that, on average across nations, an extra year’s schooling boosts reading scores by somewhere between 20 and 40 points.[80] This implies that the reading ability of pupils in Wales is somewhere between a year and six months of schooling behind pupils in the other three nations by age 15.
The starkly lower performance of secondary school pupils in Wales is notable and consistent over time. Children in Wales had lower average vocabulary scores than children in the other nations at ages five and seven, but a higher score than children in England and Scotland at age 11[81] – suggesting that Welsh pupils make less progress in secondary school than children in the other nations. Pupils in Wales appear to make less progress even when controlling for socioeconomic factors. A smaller proportion of children eligible for free school meals in Wales (one marker of disadvantage) achieve five or more GCSEs or equivalent at A*–C when compared to children eligible for free school meals in England.[82] One analysis which attempted to match schools in Wales with schools in regions of England that share similar economic and social characteristics still found lower performance when comparing the proportion of pupils gaining five or more GCSEs or equivalent (albeit a smaller gap in performance).[83]
There are many differences between Welsh secondary schools and those in the other nations, but the decisions to remove league tables and standardised testing are two plausible factors in explaining their poorer performance. There is robust evidence that the Welsh government’s decision to remove league tables in 2002 reduced attainment. Removing league tables was associated with a slower increase in the percentage of Welsh pupils achieving five or more A*-C GCSEs or equivalent qualifications in comparison to English pupils – after controlling for pupil backgrounds, prior attainment and levels of school funding.[84] It is possible that removing league tables meant that poorly performing schools in Wales were not publicly shamed and could effectively hide from public pressure.
This comparison is not straightforward, because England counted vocational qualifications such as BTEC diplomas in the 2000s whereas Wales did not.[85] The difference in the percentage of pupils achieving five A*-C GCSEs or equivalent qualifications could therefore reflect schools’ greater incentives to take GCSE equivalents in England to boost league table position.
That research also showed that the biggest effects of removing league tables were on the outcomes of pupils in the worst-performing three quarters of schools. The authors found no difference for pupil attainment in Welsh schools which would have been at the top of the league tables.[86] The removal of league tables, if this had an effect, cannot explain why the highest performers in Wales also underperform their English, Scottish and Northern Irish counterparts in the PISA tests.
It is not clear why the highest-performing pupils in England perform, on average, better than the highest-performing pupils in the other nations, but it may be related to the larger range of schools within England. PISA scores are statistically detectably higher in independent schools and convertor academies than in other types of school in England, even after accounting for differences in their pupils’ socioeconomic backgrounds.[87] The larger proportion of independent, convertor academy and grammar schools in England may contribute to the comparatively high performance of England’s best-performing students compared to the other three nations – although the sample of pupils from these schools in PISA is very low.
Wales readopted policies closer to those in England early in the 2010s – reintroducing league tables (2011) and some testing (2013) – suggesting at least a belief that its experiment of removing league tables and testing had not worked. Wales’ latest PISA scores in 2018 show an improvement in all subjects, which could reflect these policy changes – but there have been other changes to Welsh education policy going on at the same time aimed at boosting performance. These include raising entry requirements for new teachers and trying to improve the quality of professional development for existing teachers.
Why Wales does not have as many high-performing pupils is debated, but the gap that exists suggests that Welsh schools are less effective at supporting pupils capable of achieving the highest scores. The Welsh government recognised this as a problem in 2008 and introduced new guidance for schools and local authorities on how to improve education for more able and talented pupils,[88] but its interventions have not yet managed to increase the number of high attainers. Estyn – the Welsh schools inspectorate – found that only a few primary and secondary schools provided enough support for “more able and talented” pupils to achieve their potential in 2011[89] and 2012,[90] principally because they struggled to identify, track and support the progress of more able and talented pupils – such as by differentiating classroom work and offering harder work to more able pupils.[91] Estyn revisited how much progress the Welsh government had made in 2018 and found that, while there had been improvements “in around a third of schools, more able pupils do not achieve as well as they should or use their skills to a level that matches their ability”.[92]
It is not clear why schools struggle to support high-performing pupils in Wales but may be because there are not enough suitably qualified teachers.[93] Wales has the fewest teachers per pupil of all four nations.
Science attainment has declined in a statistically detectable way in Wales, Scotland and Northern Ireland
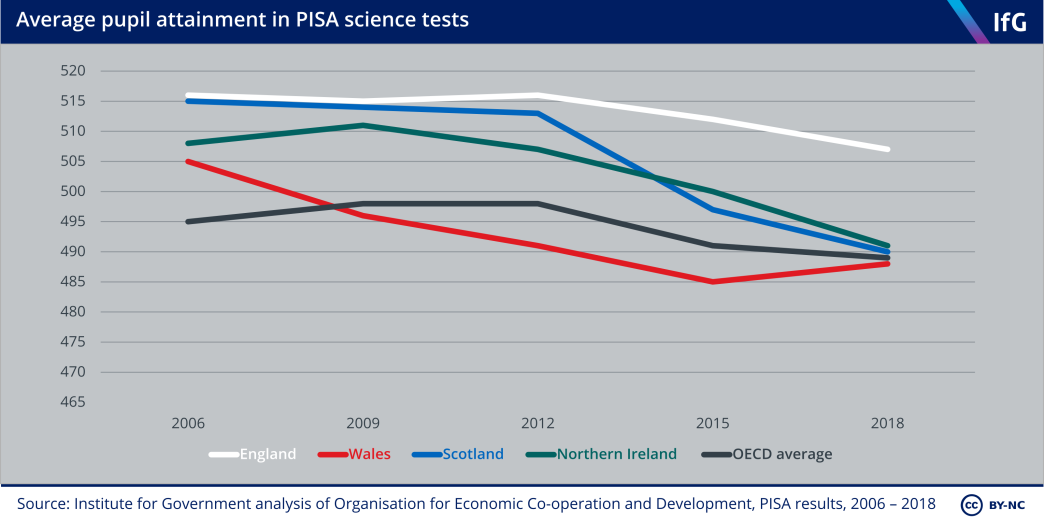
Unlike reading, science results have been falling in all UK nations. Average scores have fallen since 2012 – although the decline in English scores has been slower and performance in Wales improved between 2015 and 2018.
Pupils in England, Scotland and Northern Ireland had scores that were statistically indistinguishable from one another in 2009 but, while the average score achieved by English pupils declined by nine points between 2006 and 2018, the average score achieved by Scottish pupils dropped by 25 points in the same period. The average score achieved by pupils in Northern Ireland declined by 20 points between 2009 and 2018. The roughly 20-point difference between England and the other three nations in 2018 implies that pupils in Scotland, Wales and Northern Ireland are somewhere between a year and six months of schooling behind pupils in England by age 15.
England now performs significantly better than it used to in maths
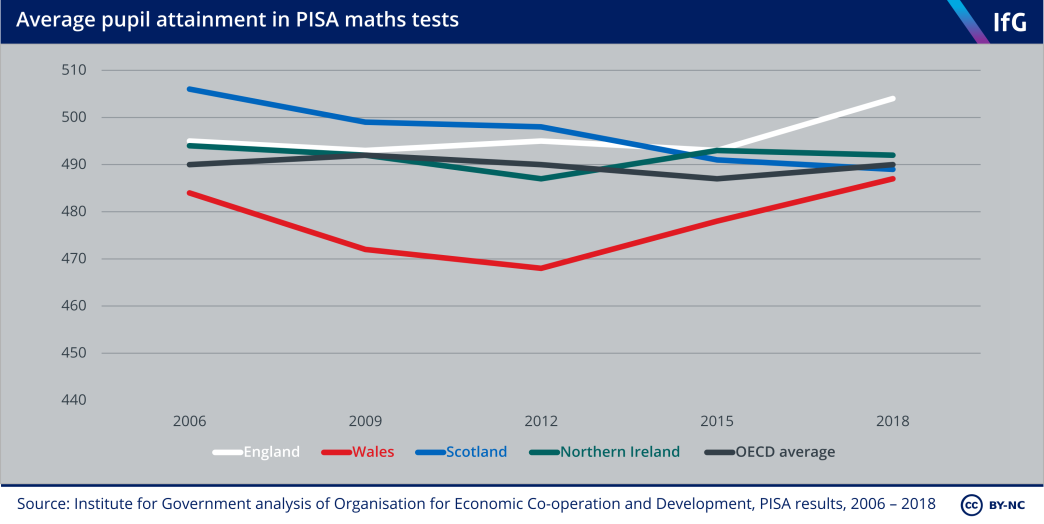
The picture in maths is much more varied – with different trends in each nation. By 2018 there was no significant difference in mean scores between Scotland, Wales and Northern Ireland – although that was the result of falls in Scottish scores, increases in Welsh scores and no change in Northern Ireland’s scores. England’s mean score was slightly – and statistically detectably – higher than the other three nations. Scottish pupils’ scores have gradually declined from the highest score in the UK in 2006 (506) to the second lowest in 2018 (489) – a 17-point drop. Throughout most of the past 16 years, Welsh pupils consistently score lower than the rest of the UK by around 10 points, but Welsh pupils’ scores have significantly improved since 2012 and are now no lower than in Scotland and Northern Ireland.
Scotland’s Curriculum for Excellence has not (so far) lived up to its name
In its 2011 manifesto, the SNP claimed that the 2009 PISA results showed that “decline in Scotland’s educational performance has been halted”, declaring it was “determined to see an increased performance in the next PISA survey”.[94] But maths and science scores are now lower than they were in 2006.
The fall in Scottish maths and science PISA scores after 2012 may be the result of the introduction of the Curriculum for Excellence – the biggest single change in Scottish education policy during this period.* A 2015 OECD review of the Scottish curriculum found weaknesses in maths and science,[95] and concluded that there had been a significant decline in attainment while the Curriculum for Excellence was implemented** – a conclusion corroborated by reliable sources. Data from the Scottish Surveys of Literacy and Numeracy, which ran from 2011 to 2016, suggests there were statistically detectable (albeit small) declines in pupils’ numeracy and literacy after the introduction of the new curriculum.
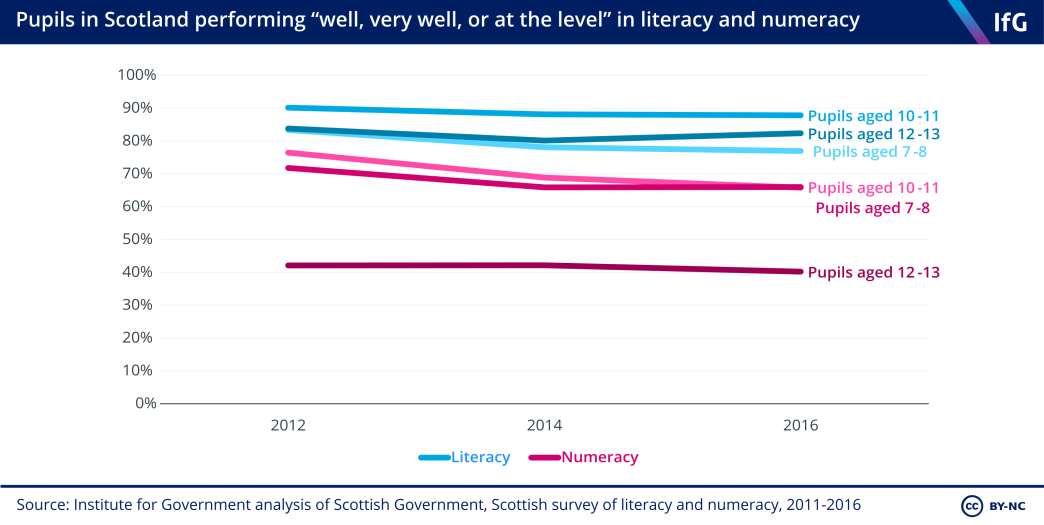
The story after 2015 is more complicated. The fall in Scottish PISA scores after 2012 is not huge and falls in maths and science between 2015 and 2018 were not statistically significant.[96] It is also not clear whether it was the content of the curriculum or its poor implementation which resulted in the decline. Teachers and local authorities found it difficult to implement the new curriculum: teachers had to radically rewrite courses and lesson plans while trying to prepare pupils for exams for which there were few past papers[97] they could use to give pupils an example of the format of the new exams.[98]
Teachers also initially criticised the curriculum for being too vague[99] but later over- prescriptive. The Royal Society of Edinburgh criticised some of the government guidance produced after publication as “either inaccessibly long or too vague to be of much use… often produced retrospectively in response to issues as they arrive rather than being strategically planned”.[100] In response to teacher criticisms that the new curriculum had increased their workload, the Scottish Qualifications Authority (SQA) removed unit assessments the new curriculum had created in 2016.[101]
The implementation of the new curriculum also – inadvertently – reduced the number of subjects that some pupils study from age 15. The SQA advised that pupils should study each National 4 subject in which they take an exam for at least 160 hours. Some schools – especially those in areas of higher deprivation – interpreted this as limiting pupils to enter only a certain number of exams.[102] This reduction in the number of subjects some pupils take at age 15 may have reduced pupils’ overall skills and affected their test-taking ability.
Whether the content of the curriculum, poor implementation, or something else entirely, the introduction of the Curriculum for Excellence is a plausible factor in explaining the fall in Scottish PISA scores in maths and science after 2012.
* Scotland did not cut spending more sharply than the other three nations, nor were there any other major changes in pupil demographics (such as a big wave of immigration, or large decrease in child poverty) after 2012.
** Although it notes that some of the fall in Scottish pupils’ PISA maths attainment predates the Curriculum for Excellence, having fallen dramatically between 2003 and 2006.
Wales has the highest proportion of low achievers in reading – and the lowest proportion of high achievers
The average scores of pupils in each nation provide one angle on performance but it is also useful to look at the distribution of scores – that is, the proportion that achieve high scores and the proportion that achieve low scores.
PISA scores are divided into levels of attainment which correspond to a certain level of proficiency.[103] In the 2018 results, scores were between levels 1 and 6,[104] with Level 2 proficiency defined as the “minimum level of proficiency” that all children should acquire in reading and maths by the end of secondary education.[105],*
England’s higher average performance in all subjects reflects a higher proportion of pupils achieving the very best scores. But lower down the scale, England actually has a similar proportion of pupils achieving the lowest grades as Scotland and Northern Ireland.
Meanwhile, Wales’ lower average performance reflects both fewer pupils achieving top results and more achieving low scores. Wales has the highest proportion of low performers – that is, pupils achieving scores below Level 2 – in reading, although Scotland has slightly more low achievers than Wales in science and maths.
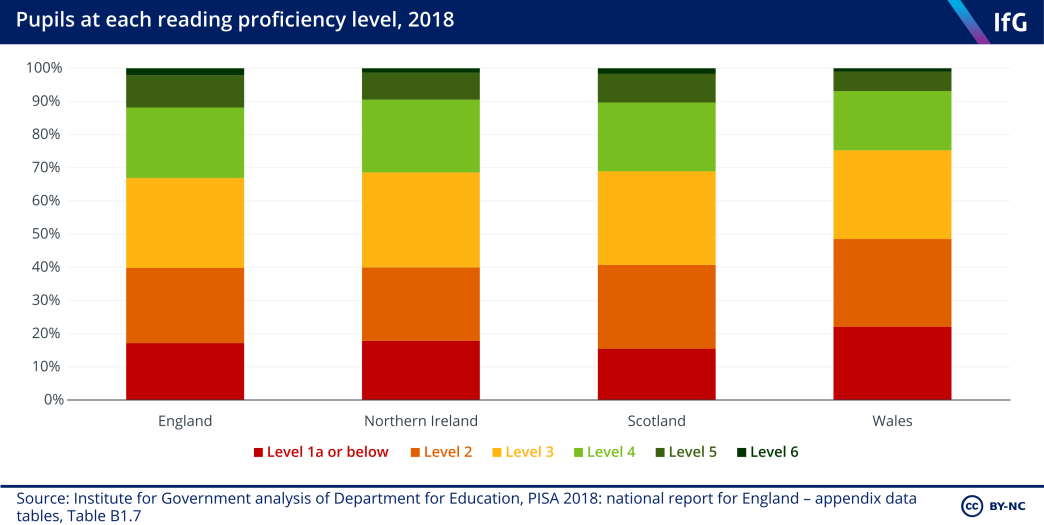
In reading, Scotland had the lowest percentage of pupils below Level 2 (15%), while Wales had the highest (22%). At the other end of the scale, England had the highest proportion of pupils (12%) achieving scores at levels 5 and 6, the highest bands. Scotland and Northern Ireland had similar proportions of high performers (10% and 9% respectively), whereas Wales had a lower proportion of high scorers (7%) in comparison to the other three nations.
* Reading scores also include levels 1b and 1c, and science 1b. PISA does not set a minimum threshold for scientific literacy, but Level 2 is a “threshold below which students typically require some support to engage with science-related questions, even in familiar contexts”. See: Organisation for Economic Co- operation and Development, ‘What can students do in science?’, No date, retrieved 14 April 2021, www.oecd-ilibrary.org/sites/5f07c754-en/1/2/8/index.html?itemId=/content/publication/5f07c754-en&_ csp_=6aa84fb981b29e81b35b3f982f80670e&itemIGO=oecd&itemContentType=book

The science results reflect the reading results. Northern Ireland, Scotland and Wales had similar proportions of pupils below Level 2 (Northern Ireland 19%, Scotland 21%, Wales 20%), while England had a lower proportion (17%). England also had the largest percentage of pupils (10%) at the highest two levels of attainment (levels 5 and 6). Scotland, Wales and Northern Ireland all had a similar proportion of high-performing pupils as the OECD average (7%, 5% and 5% respectively).
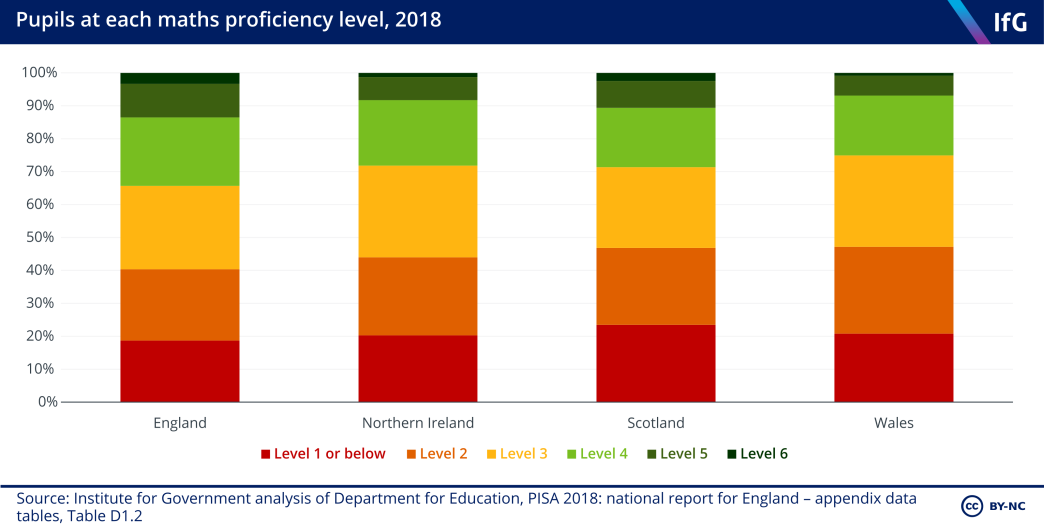
In maths, the proportion of pupils performing below PISA Level 2 was similar in all four nations, but highest (at 23%) in Scotland. England had the largest percentage of pupils (14%) at the two highest levels of attainment (levels 5 and 6). Scotland had the same share of high-performing pupils as the OECD average (11%). Both Northern Ireland and Wales had statistically significantly lower proportions of high performers than the OECD average (8% and 7% respectively).
Wales has “levelled down” the gap between the most and least deprived pupils
In recent years, the UK government[106] and governments in Scotland,[107] Wales[108] and Northern Ireland[109] have shared the same goal of reducing the difference in educational attainment between more and less disadvantaged pupils, as well as increasing overall attainment.
PISA records pupils’ socioeconomic background and assigns them a score on an economic, social and cultural status (ESCS) index – a measure of financial, social and cultural capital.* The index measures include parental education, parental occupation, number of home possessions such as books, and access to the internet.[110] The difference in test scores between the most and least deprived groups of pupils on this index within each country provides a way to assess how big the education disadvantage gap is in each country.
In all countries which participate in PISA, there is a gap in attainment between the most and least deprived pupils. One way to illustrate this gap is to rank pupils by their ESCS index, divide them into four equally sized groups (or quartiles) and then compare the differences in average performance. The OECD analyses country results in this way for the main subject domain** in each year’s test.
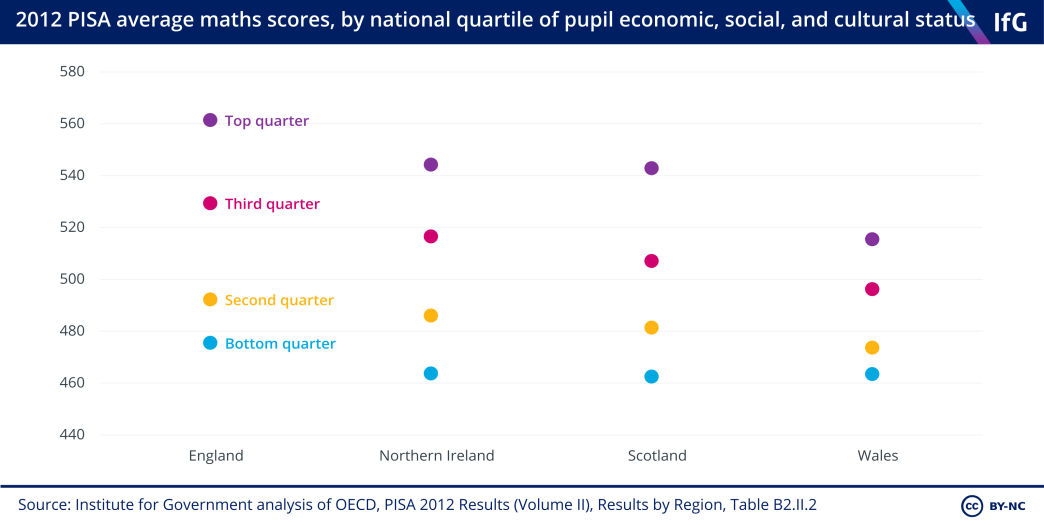
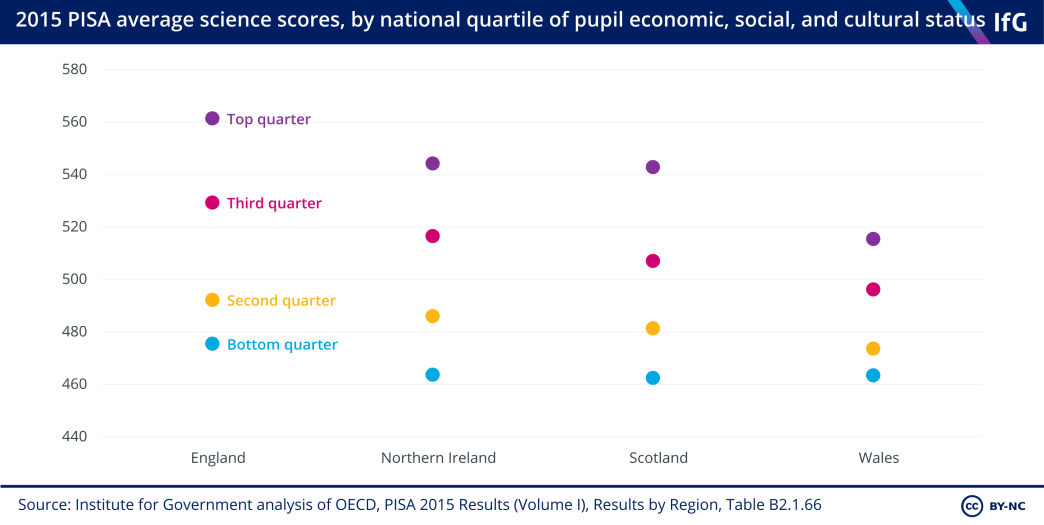
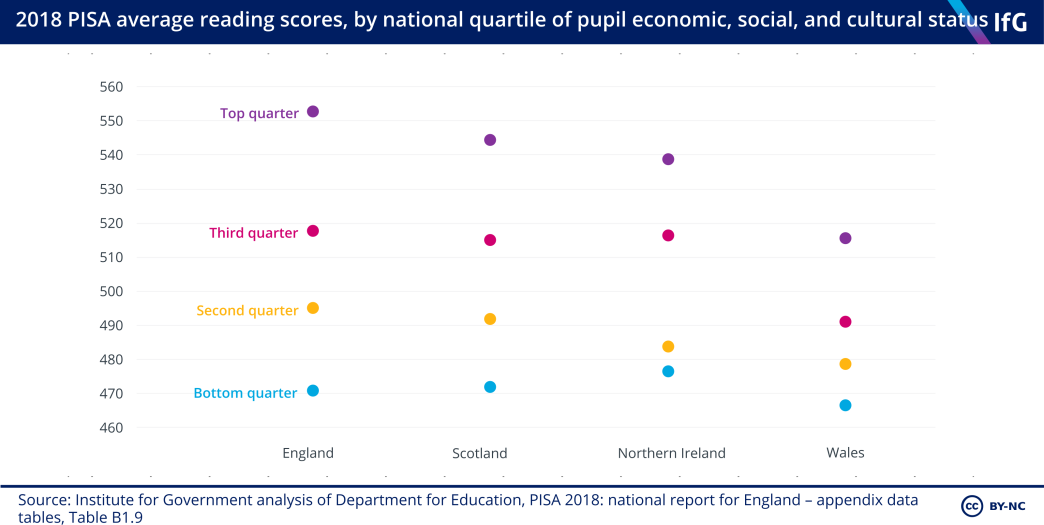
Wales consistently has the smallest education disadvantage gap because the most advantaged pupils in Wales achieve substantially lower scores than the most advantaged pupils in the other three nations – not because its more disadvantaged pupils do better. In 2018, the most advantaged Welsh pupils on average scored 608 points in reading, compared to 634 points in England, 627 points in Scotland, and 623 points in Northern Ireland.
In contrast, England has the largest gap in attainment between the most and least disadvantaged pupils in maths and reading. England has the second largest gap in science, where the difference in Northern Ireland is larger. England has the least equitable results in the sense that the gap between attainment of the most and least advantaged pupils is wider than in the other nations.
In 2018, socioeconomic status explained 9.8% of variation in the reading scores of pupils in England, 8.3% in Scotland, 6.9% in Northern Ireland – but only 4% in Wales. But these difference should not be overstated. All four nations are relatively equitable. Across all OECD countries, the percentage of variance in attainment explained by a pupil’s economic, social, and cultural status was 12%.
* This index is based on pupils’ responses to questions about their parents’ backgrounds, education, and possessions in their homes.
** Each year’s PISA contains a “major domain” of either maths, science or reading, which makes up two-thirds of the test questions in that year. See: Organisation for Economic Co-operation and Development, ‘What is PISA?’, No date, retrieved 14 April 2021, www.oecd-ilibrary.org/education/pisa-2015-assessment-and-analytical-framework/what-is-pisa_9789264281820-2-en