Fixing the children’s social care market: The consequences of a broken care market
Many children live in placements that do not meet their needs. The government’s reforms are promising, but rely on more joined-up public services.

Children are too often in unsuitable care and face a ‘postcode lottery’ in care quality
The lack of appropriate placements, in the right locations, has real, lasting consequences for children in the care system.
Some children are unnecessarily placed in institutional settings, separated from their siblings, unable to access vital therapeutic support, moved far away from their home area and community, and face ongoing instability. As the CMA wrote in 2022:
“Given the vital importance of good placement matches for successful outcomes for children, and particularly the negative impact of repeated placement breakdown, these outcomes should not be accepted. It is a fundamental failure in the way the market is currently performing.” 102 Competition and Markets Authority, Children’s Social Care Market Study: Final report, GOV.UK, 2022, p. 9, https://assets.publishing.service.gov.uk/media/6228726cd3bf7f158c844f65/Final_report.pdf
Overuse of residential settings and splitting siblings up
The shortage of foster carers, for example, means some children who would benefit from family-based placements are being placed in residential care. This is in direct conflict with the Children’s Social Care National Framework, which recognises the importance of family environments for most children’s development and states that children should be raised in them, wherever possible. 103 Department for Education, Children’s Social Care National Framework, GOV.UK, 2023, https://assets.publishing.service.gov.uk/media/657c538495bf650010719097/Children_s_Social_Care_National_Framework_December_2023.pdf It also leaves less capacity for the children who are best suited to residential settings.
Siblings in care are being separated because too few placements can accommodate them together. Although data is limited, the children’s commissioner estimated in 2023 that more than a third (34%) of sibling groups in England are separated in their first placement. 104 Children’s Commissioner, ‘Siblings in care’, 26 January 2023, retrieved 10 April 2026, www.childrenscommissioner.gov.uk/resource/siblings-in-care This sits in tension with local authorities’ duty to place siblings together wherever reasonably practicable and in their best interests.*, 105 Legislation.gov.uk, Children Act 1989, c. 41, p. 3, s. 22C, retrieved 13 April 2026, www.legislation.gov.uk/ukpga/1989/41/section/22C The available evidence, while limited, suggests that sibling co-placements may be more stable and promote better mental health and educational outcomes than if they are placed apart. 106 Meakings S, Sebba J and Luke N, What is Known about the Placement and Outcomes of Siblings in Foster Care?, Rees Centre for Research in Fostering and Education, 2017, www.standupforsiblings.co.uk/wp-content/uploads/2018/03/ReesCentreReview_SiblingsinFosterCare_Feb2017.pdf
* This requirement does not apply if a child is being considered for adoption.
Deprivation of liberty orders and unregistered homes
As recent Institute for Government analysis shows, the dangerous inadequacy of placements for children who have been deprived of their liberty has caused local authorities to turn to deprivation of liberty orders (DoLs). 107 Dellar A, Performance Tracker 2025, ‘Children’s social care’, Institute for Government, 15 October 2025, retrieved 18 March 2026, www.instituteforgovernment.org.uk/publication/performance-tracker-2025/local-services/children-social-care Intended as a last-resort measure for authorising a deprivation of liberty when none of the statutory mechanisms – such as a secure accommodation order – applies, DoLs generally mean children are placed in unregistered settings. These settings are unlawful, lacking Ofsted oversight and any guarantee of minimum standards. When inspectors do investigate, they often find poor-quality care. 108 Ofsted, ‘Unregistered children’s homes’, GOV.UK, 27 November 2024, retrieved 26 September 2025, www.gov.uk/government/publications/unregistered-childrens-homes/unregistered-childrens-homes
Although the DfE has stated that no children should be living in unregistered homes, 109 House of Commons Committee of Public Accounts, Financial Sustainability of Children’s Care Homes: Sixty-first report of session 2024–26, HC 1233, The Stationery Office, 2025, retrieved 13 April 2026, https://committees.parliament.uk/publications/51065/documents/283185/default nearly nine in 10 councils told Ofsted that they had placed children in one in 2024/25 because they could not find places in registered homes that met the children’s needs. 110 Ofsted, The Annual Report of His Majesty’s Chief Inspector of Education, Children’s Services and Skills 2024/25, HC 1474, The Stationery Office, 2025, p. 13, https://assets.publishing.service.gov.uk/media/6929d2b9a245b0985f0342ed/Ofsted_Annual_Report_2024-25.pdf Rachael Wardell, former president of the Association of Directors of Children’s Services, has described this as choosing the “slightly less unacceptable” of two unacceptable alternatives, the other being a child without any placement at all. 10 House of Commons Committee of Public Accounts, Financial Sustainability of Children’s Care Homes: Sixty-first report of session 2024–26, HC 1233, The Stationery Office, 2025, p. 11, retrieved 13 April 2026, https://committees.parliament.uk/publications/51065/documents/283185/default
Despite this, Ofsted has become aware of a growing number of unregistered children’s homes, uncovering 680 in 2024/25, nearly a fivefold increase on the 144 it found in 2020/21. 111 Ofsted, ‘Unregistered children’s homes’, GOV.UK, 27 November 2024, retrieved 26 September 2025, www.gov.uk/government/publications/unregistered-childrens-homes/unregistered-childrens-homes; Ofsted, The Annual Report of His Majesty’s Chief Inspector of Education, Children’s Services and Skills 2024/25, HC 1474, The Stationery Office, 2025, p. 13, https://assets.publishing.service.gov.uk/media/6929d2b9a245b0985f0342ed/Ofsted_Annual_Report_2024-25.pdf With councils under no obligation to disclose these placements, the true figure is almost certainly higher.

The use of DoLs and their impact on children have drawn repeated concern from across the system, including from family court judges, directors of children’s services, Ofsted and family rights groups. 118 Roe A, Children Subject to Deprivation of Liberty Orders, Nuffield Family Justice Observatory, 2023, www.nuffieldfjo.org.uk/wp-content/uploads/2023/09/CHILDR1.1.pdf Too often, children who need stable, specialist support are instead placed in unregistered provision as a stopgap, with the hope that something more suitable will emerge. 119 Roe A and Ryan M, Children Deprived of their Liberty: An analysis of the first two months of applications to the National Deprivation of Liberty Court, Nuffield Family Justice Observatory, 2023, www.nuffieldfjo.org.uk/wp-content/uploads/2023/02/nfjo_report_yp_deprivation_of_liberty-1.pdf The result is poor outcomes for the most vulnerable children and material pressure on the workload of family courts. This situation is far from inevitable. As Lady Arden wrote in a Supreme Court judgment in 2021:
“It is not entirely clear to me… why the Secretary of State cannot or cannot yet enable all children who need to do so to enjoy the security of a registered home. This problem is clearly not a new one… It is not satisfactory that the courts should be used to address not just a specific gap but a systemic gap in the provision of care for children.” 120 Re T (A Child) [2021] UKSC 35 [185].
Distant placements
Finally, the broken care market means many children in care live far away from home. Despite local authorities’ legal duty to provide accommodation in the local area that meets children’s needs, 121 Legislation.gov.uk, Children Act 1989, c. 41, p. 3, s. 22C, retrieved 13 April 2026, www.legislation.gov.uk/ukpga/1989/41/section/22C more than a fifth (22%) of children in care in England in 2025 – 18,100 children – were living in ‘distant’ placements, that is, more than 20 miles from home.*, 122 Department for Education, ‘Children looked after in England including adoptions’, GOV.UK, 26 November 2025, retrieved 23 January 2026, https://explore-education-statistics.service.gov.uk/find-statistics/children-looked-after-in-england-including-adoptions/2025
Ad hoc data reveals the spread of distances within ‘distant’ placements in 2024. While half were within 40 miles, some were considerably further away, including 2,670 that were more than 100 miles away – 3.2% of all placements in that year. 123 Department for Education, ‘Children looked after: a focus on placement location’, GOV.UK, 17 November 2025, retrieved 23 January 2026, https://explore-education-statistics.service.gov.uk/find-statistics/children-looked-after-a-focus-on-placement-location/2024 Only 830 of these were in kinship care, adoption placements or with people with parental responsibility – arrangements where the long distance is often more justifiable in relation to the child’s needs. The remainder were in other forms of provision.
* ‘Home’ is defined as the address where the child was living when they went into the care of the local authority. This is how we define ‘distant’ placements throughout the report. This definition is a reflection of how the DfE splits the data – some placements in this category will be significantly more distant than others.

This illustrates the consequences of not having enough care provision in the right places. In some situations, distance is considered necessary to separate a child from harmful influences; for example, to safeguard them from gangs or child sexual exploitation. But when children live far away from home, they risk losing vital connections to family, friends and support services. 128 Become, Still Too Far, 2024, https://becomecharity.org.uk/content/uploads/2024/08/Still-Too-Far-report-FINAL-v1.pdf Distance can also disrupt education, break the continuity of health and social care support* and may increase vulnerability to exploitation. 129 The All Party Parliamentary Group for Runaway and Missing Children and Adults, No Place at Home, 2019, www.childrenssociety.org.uk/sites/default/files/2020-10/no-place-at-home.pdf And if a child is living far away, local authorities will find it harder to act as an attentive corporate parent – it is more difficult for social workers to spend time with them and, if the child has moved local authority areas, to know and understand the support available. 130 House of Commons Committee of Public Accounts, Financial Sustainability of Children’s Care Homes: Sixty-first report of session 2024–26, HC 1233, The Stationery Office, 2025, retrieved 13 April 2026, https://committees.parliament.uk/publications/51065/documents/283185/default
Children in children’s homes and secure children’s homes live particularly far from their established communities, at a median distance of 19.6 miles in 2024** – nearly three times the 6.9 miles for all children in care. 131 Department for Education, ‘Children looked after: a focus on placement location’, GOV.UK, 17 November 2025, retrieved 23 January 2026, https://explore-education-statistics.service.gov.uk/find-statistics/children-looked-after-a-focus-on-placement-location/2024 To some extent, distance for children in secure settings is unavoidable: secure provision is highly specialised and there are currently only 14 secure children’s homes in England. But the scale of the gap also reflects the substantial mismatch between where these settings are located and where demand exists.
* Transfers of care are key risk areas for patient safety because there is often no formalised system for continuity of care. See Health Services Safety Investigations Body, Continuity of Care: Delayed diagnosis in GP practices, 2023, retrieved 10 April 2026, www.hssib.org.uk/patient-safety-investigations/continuity-of-care-delayed-diagnosis-in-gp-practices
** The latest year for which data is available.

By contrast, children in other settings tend to live much closer to home. Those in supported accommodation are an average of 5.6 miles away, and those in foster care are 6.1 miles away. 136 Department for Education, ‘Children looked after: a focus on placement location’, GOV.UK, 17 November 2025, retrieved 23 January 2026, https://explore-education-statistics.service.gov.uk/find-statistics/children-looked-after-a-focus-on-placement-location/2024 Adoption placements and other residential placements tend to be even more distant than those in children’s homes, but together these two settings accommodate just 3% of children in care, 137 Department for Education, ‘Children looked after in England including adoptions’, GOV.UK, 26 November 2025, retrieved 23 January 2026, https://explore-education-statistics.service.gov.uk/find-statistics/children-looked-after-in-england-including-adoptions/2025 and it is usually a deliberate choice to place children for adoption away from where their birth family live.
Our analysis shows that if a given local authority starts placing more of its children into homes, or places more children into privately provided placements of any type, or if their underlying rate of children in care increases, it is associated with them making more distant placements.* The first of these findings is exactly what Figure 13 would lead us to expect.
The second finding – although weaker than the others** – reflects the greater competition that private placements face from multiple local authorities, and the larger geographic footprint over which some private providers operate. As a result, private placements are used by councils across a wider area than those that serve a single local authority.
DfE data from 2024*** illustrates this: children placed in mainstream foster care with IFAs (predominantly privately run) lived a median of 10.5 miles from home, compared to 5.6 miles for local authority placements – almost half the distance. 138 Department for Education, ‘Children looked after: a focus on placement location’, GOV.UK, 17 November 2025, retrieved 23 January 2026, https://explore-education-statistics.service.gov.uk/find-statistics/children-looked-after-a-focus-on-placement-location/2024 Interviewees attributed this to IFAs operating over a larger footprint and to local authorities competing with one another for available places. 139 25 Institute for Government interviews.
* See M6 in the Methodology, found as a PDF on this report’s webpage, for details on the regression.
** This finding is just insignificant at the 95% level (p-value = 0.053), which means there is a slightly greater than 5% chance we would observe the effect we do if there was no relationship between reliance on private provision and distant placements.
*** The latest year for which data is available.

The third finding (that increases in the rate of children in care are associated with increases in distant placements) suggests that local authorities do not adjust their local supply of placements very responsively to changes in local demand – as the rate of children in care increases, more children are placed further away. This points to nationwide issues with demand forecasting and commissioning practice, and barriers to creating new provision, all of which we discuss in more detail below.
As the system has become increasingly reliant on care homes and private provision, and there has been an increase in the rate of children in care, distant placements have become more common. In 2015, 18% of children in care (12,800 children) were living more than 20 miles from home. By 2025, this was 22%, or 18,100 children, as noted earlier.

The picture is also becoming more uneven across England – how far a child is placed from home increasingly depends on which local authority is responsible for their care. Since 2017, the gap between the quarter of local authorities placing the most children far from home and the quarter placing the least has widened by 5 percentage points (ppts), driven almost entirely by rising rates in the areas placing the most children far from home.
This pattern is even clearer at a regional level. Little has changed since 2017 in the regions where distant placements were already uncommon, but those at the top end of the distribution have continued to pull away. Children in the care of councils in the South East and the South West are now 8ppts more likely to live far from home than in 2017, with nearly a third living more than 20 miles away in 2025 (30% and 33% respectively). That is more than twice the rate seen in the North East and the North West (13% and 14% respectively), where the rate of distant placements has remained relatively stable.

At a local authority level, distant placements are most common in Cumberland, Lincolnshire, and Westmorland and Furness, where around half of children in care (50%, 49% and 48% respectively) were living more than 20 miles away from home in 2025.* At the other end of the spectrum is Wigan, where just 6% were. This is a clear illustration of the postcode lottery shaping children’s experiences of care – where a child is from plays an increasingly major role in how far from home they end up.
* The 2024 reporting year was the first in which Cumberland, and Westmorland and Furness local authorities existed. But their high rate of distant placements is unlikely to be the result of a data error. Their predecessor – Cumbria County Council – also had the highest rate of distant placements of any local authority between 2020 and 2023 (between 53% and 56%). This excludes the City of London, Rutland and the Isles of Scilly, where the care population is small.

There are several reasons for this stark variation. The first is that, as we have already discussed, some areas are cheaper and easier places to set up care provision. As a result, local authorities with lower housing density (which means there are fewer local housing options), higher house prices and higher labour prices often place more children greater than 20 miles from home.*
* See M7 in the Methodology, found as a PDF on this report’s webpage, for details of the regression.
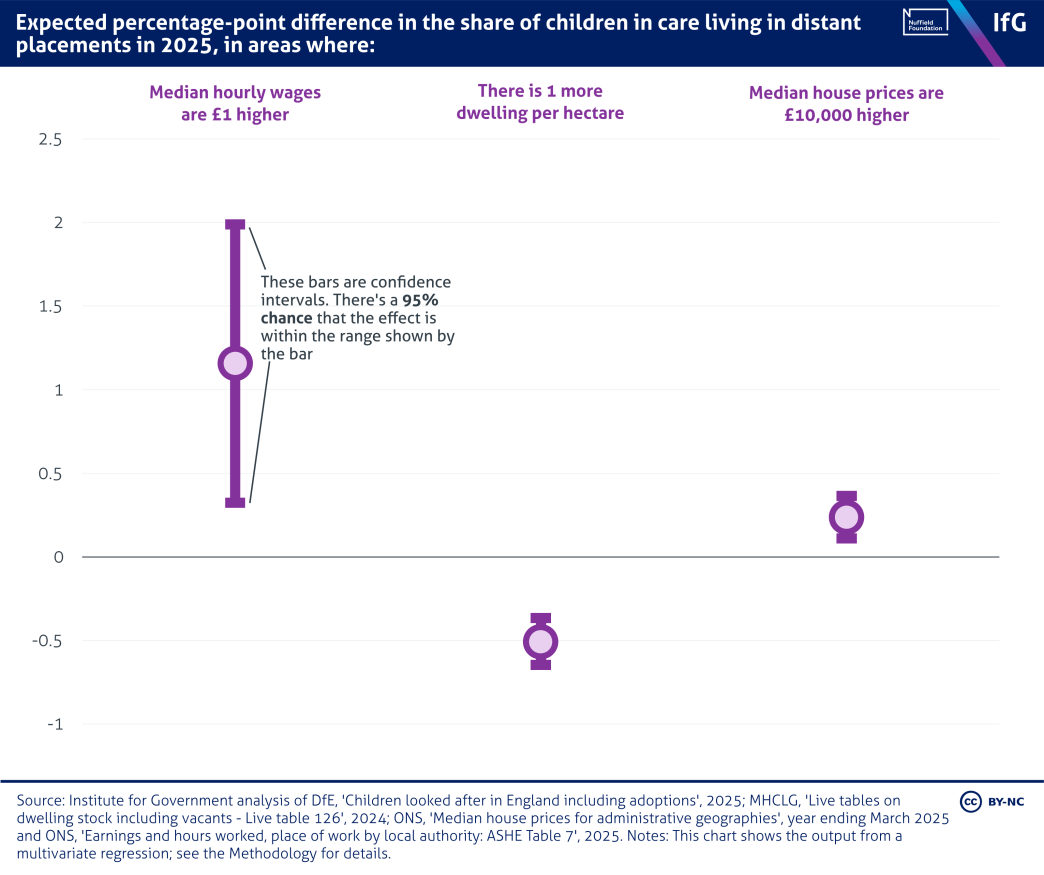
Controlling for the other variables, the fifth of local authority areas with the highest median hourly wages are expected to place 7.3ppts more children into distant placements than the fifth with the lowest. For house prices, the difference is 9.8ppts, and for housing density, the most built-up fifth of areas are expected to place 18.1ppts fewer children into distant placements than the least built-up fifth. Cumberland, Lincolnshire, and Westmorland and Furness have among the lowest housing densities of any local authority, likely contributing to their particularly high levels of distant placements.
Another factor behind the variation in distant placements is varying reliance on care homes and private providers, as noted above. Some of these differences may reflect varying levels of complexity among care cohorts, or external constraints on local supply, such as how fewer households in more deprived areas may be able to foster.
Equally, however, some variation may stem from councils commissioning or delivering services less efficiently – for example, securing poorer deals from providers or placing children in residential care when it is not required. This comes down to leadership quality and demand forecasting capabilities. Local authorities with the skills and will to be data-driven are better able to plan local capacity in children’s services (for more detail, see Chapter 4: Recommendations). 141 Hurst G, Teixeira L and Davies N, A Smarter Approach to Homelessness, Institute for Government, 2025, www.instituteforgovernment.org.uk/sites/default/files/2025-05/A-smarter-approach-to-homelessness.pdf; Bach-Mortensen AM, Murray H, Goodair B, Carter E, Briggs E and O’Higgins A, Are Local Authorities Achieving Effective Market Stewardship for Children’s Social Care Services?, What Works for Children’s Social Care, 2022, https://webarchive.nationalarchives.gov.uk/ukgwa/20230308122151mp_/https://whatworks-csc.org.uk/wp-content/uploads/WWCSC_sufficiency_report_Final_Mar…
Indeed, comparing Cumberland – the area with the highest rate of distant placements – to its five closest ‘statistical neighbours’ (the areas that have the most similar economic and demographic characteristics) reveals striking variation in the rate of distant placements. While Cumberland places 50% of children in care more than 20 miles away from home, County Durham, a similar area, places just 15%, well below the national level.

A smaller but still notable degree of variation emerges when we compare Wigan – the area with the lowest rate – to its statistical neighbours, with Wigan placing 21ppts fewer children more than 20 miles away than Nottinghamshire.

Given that statistical neighbours face similar labour and housing markets, external constraints on local supply (including from rurality) and potentially comparable levels of complexity among children in care, it is likely that differences in the efficiency of local commissioning practices explain much of the variation we see between these areas.
The system is financially unsustainable
Spending on children in care has grown faster than economy-wide inflation every year since 2010/11. By 2024/25, local authorities were spending £8.9billion on children in care, nearly twice as much as the £4.5bn spent in 2009/10 and two thirds (68%) more than the £5.3bn spent in 2015/16 in real terms.

The number of children in care rose by only 16% between 2015/16 and 2024/25, indicating that care is becoming increasingly expensive. If spending had risen in line with the care population since 2015/16, England would have spent only £6.1bn on care in 2024/25, nearly a third (31%) less than it did.
Part of the rise in costs may come from local authorities’ growing reliance on private provision. In 2011, 19,100 children – 29% of those in care – were in privately provided placements. By 2025, that figure had risen by nearly three quarters to 33,000, constituting 40% of children in care. Meanwhile, use of public sector provision dropped from 62% to 44%, approaching parity with private providers.

The government has accused some private providers of “profiteering” 149 Department for Education, Keeping Children Safe, Helping Families Thrive, CP 1200, The Stationery Office, 2024, p. 23, https://assets.publishing.service.gov.uk/media/67375fe5ed0fc07b53499a42/Keeping_Children_Safe_Helping_Families_Thrive_.pdf after the CMA estimated that between 2016 and 2020, the 15 largest private fostering providers had average profit margins of 19.4%, and found “indicative evidence that local authorities could provide some placements more cheaply than purchasing from [independent fostering agencies]”. 150 Competition and Markets Authority, Children’s Social Care Market Study: Final report, GOV.UK, 2022, p. 11, https://assets.publishing.service.gov.uk/media/6228726cd3bf7f158c844f65/Final_report.pdf DfE analysis suggests that placements involving agencies cost local authorities £55,800 a year, £22,100 more than local authority provision.*, 151 Comptroller and Auditor General, Managing Children’s Residential Care, Session 2024–26, HC 1290, National Audit Office, 2025, www.nao.org.uk/wp-content/uploads/2025/09/Managing-childrens-residential-care.pdf The CMA found similar profit margins among children’s home providers (22.6%), 152 Competition and Markets Authority, Children’s Social Care Market Study: Final report, GOV.UK, 2022, https://assets.publishing.service.gov.uk/media/6228726cd3bf7f158c844f65/Final_report.pdf but, despite these profit levels, no evidence that other providers could deliver services more cheaply.
The care market’s reliance on private equity-backed providers has also drawn concern from the Public Accounts Committee (PAC), NAO, and CMA. 153 Ibid.; Comptroller and Auditor General, Managing Children’s Residential Care, Session 2024–26, HC 1290, National Audit Office, 2025, www.nao.org.uk/wp-content/uploads/2025/09/Managing-childrens-residential-care.pdf; House of Commons Committee of Public Accounts, Financial Sustainability of Children’s Care Homes: Sixty-first report of session 2024–26, HC 1233, The Stationery Office, 2025, retrieved 13 April 2026, https://committees.parliament.uk/publications/51065/documents/283185/default These providers now supply nearly a quarter (23%) of fostering places in England 154 Murray J and Mohdin A, ‘Nearly a quarter of foster places in England provided by private equity-backed firms’, The Guardian, 7 July 2025, retrieved 15 September 2025, www.theguardian.com/society/2025/jul/07/nearly-a-quarter-of-foster-places-in-england-provided-by-private-equity-backed-firms and account for seven of the 10 largest providers of children’s homes. 155 Comptroller and Auditor General, Managing Children’s Residential Care, Session 2024–26, HC 1290, National Audit Office, 2025, www.nao.org.uk/wp-content/uploads/2025/09/Managing-childrens-residential-care.pdf While this indicates that the sector is lucrative for investors, the primary concern raised by the CMA is not the cost, but the very high levels of debt that some of these firms carry. This heightens the risk of sudden exits from the market, which would leave the children in their care in incredibly precarious positions while councils scrambled to find alternative placements.
Another key driver of rising care costs is the growing reliance on the more expensive residential care. As discussed above, this shift reflects both changes in the needs of the care population and a persistent shortage of foster carers. In 2024/25, the average placement in a children’s home cost £7,800 a week, or £404,000 a year (in 2026/27 prices). By contrast, foster care averaged £805 a week, or £42,000 annually – nearly 10 times less.
* Adjusted to 2026/27 prices.

But the rising cost of care is not just about the growing use of children’s homes – the price of those placements has also surged. While the unit cost of foster care has stayed relatively stable (+2%) in real terms since 2016/17,* the unit cost of children’s homes is now nearly two thirds (64%) higher.
Some of this surge in prices likely reflects the increasing complexity of some children’s needs and the specialist support this requires. Equally, changes to the National Living Wage, which rose faster than inflation for much of the past decade, 163 Francis-Devine B, National Minimum Wage Statistics, House of Commons Library, 2025, https://researchbriefings.files.parliament.uk/documents/CBP-7735/CBP-7735.pdf have also exerted upward pressure on residential care prices and will continue to do so. 164 Institute for Government interview. The sector is marked by a reliance on low-paid and agency staff, 165 Hoddinott S, Davies N, Pope T, Dellar A and Nye P, Austerity Postponed? The impact of Labour’s first budget on public services, Institute for Government, 2024, retrieved 13 April 2026, www.instituteforgovernment.org.uk/publication/impact-labour-first-budget-public-services both of which make it particularly vulnerable to rising labour costs. And placing children further and further afield often brings additional administrative costs to councils, including increased social worker travel. 166 Department for Education, Final Stage Impact Assessment of Financial Oversight Scheme: Children’s social care, GOV.UK, 2025, https://assets.publishing.service.gov.uk/media/67dd443bc6194abe97358be1/DfE_RP_02_CWS_Bill_CSC_Financial_Oversight_Scheme_IA_the_House_of_Commons.pdf
While these cost pressures have played a role in recent price growth, it also reflects the deeper dysfunction in the care market we outlined earlier. Limited provision for children with the most complex needs leaves local authorities competing with each other for scarce placements, with little bargaining power over the price they pay. Inefficient commissioning practices often compound the problem, with placements frequently spot-purchased rather than secured through longer term contracts with providers. In this environment, children’s home providers can set their own prices, and in this regard the CMA concluded in 2022 that prices and profits were “materially higher… than we would expect if this market were functioning effectively”. 167 Competition and Markets Authority, Children’s Social Care Market Study: Final report, GOV.UK, 2022, p. 5, https://assets.publishing.service.gov.uk/media/6228726cd3bf7f158c844f65/Final_report.pdf
According to a Local Government Association survey, the number of placements costing more than £10,000 a week rose from 120 to 1,510 between 2018/19 and 2022/23. 168 Local Government Association, ‘High-cost children’s social care placements survey’, 29 November 2023, retrieved 26 September 2025, www.local.gov.uk/publications/high-cost-childrens-social-care-placements-survey Ofsted’s chief inspector, Sir Martyn Oliver, has linked some of these “exorbitant fees” to unregistered – and therefore unlawful – children’s homes. 169 Ofsted, The Annual Report of His Majesty’s Chief Inspector of Education, Children’s Services and Skills 2024/25, HC 1474, The Stationery Office, 2025, p. 7, https://assets.publishing.service.gov.uk/media/6929d2b9a245b0985f0342ed/Ofsted_Annual_Report_2024-25.pdf
* The earliest year for which the data on the unit costs of residential care is available.
Recent Institute for Government research has highlighted the dramatic variation across England in per-capita spending on care – with some local authorities spending three and a half times more per child in care than others. 176 Dellar A, Performance Tracker 2025, ‘Children’s social care’, Institute for Government, 15 October 2025, retrieved 18 March 2026, www.instituteforgovernment.org.uk/publication/performance-tracker-2025/local-services/children-social-care Accounting for differences in property and labour costs, which inevitably make care more expensive in some parts of England than others, narrows this gulf only slightly. 177 Dellar A, Performance Tracker 2025, ‘Children’s social care’, Institute for Government, 15 October 2025, retrieved 18 March 2026, www.instituteforgovernment.org.uk/publication/performance-tracker-2025/local-services/children-social-care Our analysis shows that some of the remaining gap can be explained by differences in local authorities’ reliance on residential and private placements, aligning with the cost pressures we discussed above.* Local authorities with higher per-capita costs of care tend to rely more on both private provision and residential care.
The sheer scale of these pressures has led the DfE to conclude that children’s social care is “financially unsustainable”. 178 Comptroller and Auditor General, Managing Children’s Residential Care, Session 2024–26, HC 1290, National Audit Office, 2025, p. 19, www.nao.org.uk/wp-content/uploads/2025/09/Managing-childrens-residential-care. pdf And crucially, councils must confront this reality using a smaller pool of resources than they had in 2010. After deep cuts to council budgets at the start of that decade, core spending power in 2024/25 was 13.5% lower in real terms than it was 2010/11. 179 Hoddinott S and Dellar A, Performance Tracker 2025, ‘Local government’, Institute for Government, 15 October 2025, retrieved 18 March 2026, www.instituteforgovernment.org.uk/publication/performance-tracker-2025/local-services/overview Children’s social care is therefore eating up an ever larger slice of councils’ budgets, rising from 18% of spending in 2011/12 to 27% in 2024/25, with the share rising in all but three councils across England.** It is now the biggest financial pressure that most local authorities face, 180 Simpson F, ‘Most councils describe children’s services as biggest financial pressure’, Children & Young People Now, 22 October 2024, retrieved 15 September 2025, www.cypnow.co.uk/content/news/most-councils-describe-children-s-services-as-biggest-financial-pressure putting some at risk of insolvency. 181 Samuel M, ‘Rising children’s social care costs deepening councils’ financial woes, finds study’, Community Care, 3 November 2023, retrieved 15 September 2025, www.communitycare.co.uk/2023/11/03/rising-childrens-social-care-costs-deepening-councils-financial-woes-finds-study
* This regression also controlled for proxies for the complexity of the needs of children in care, which all had effects on per-capita care spending that were statistically indistinguishable from zero, and the rate of children in care, which showed that areas with lower rates tended to have higher per-capita costs – for more details, see Dellar A, Performance Tracker 2025, ‘Children’s social care’, Institute for Government, 15 October 2025, retrieved 18 March 2026, www.instituteforgovernment.org.uk/publication/performance-tracker-2025/local-services/children-social-care
** All but three of the 133 councils for which we have data over this time period.

- Supporting document
- Methodology - Fixing the broken children's social care market (PDF, 1.22 MB)
- Topic
- Public services
- Political party
- Labour
- Administration
- Starmer government
- Department
- Department for Education
- Tracker
- Performance Tracker
- Publisher
- Institute for Government