Working to make government more effective

Performance Tracker 2023

Performance Tracker 2023: Neighbourhood services

Neighbourhood services – libraries, road maintenance, and waste collection – entered the pandemic with reduced or changed amenities.

A waste disposal man loading bins onto a truck

Neighbourhood services – libraries, planning, bus subsidies, road maintenance, homelessness, public health, and waste collection, disposal and recycling – had been radically cut back before the pandemic following a decade of funding cuts.* 

Since the pandemic, spending on these services overall has increased but new pressures have been placed on some of them by high inflation and falling living standards in local populations. These pressures have fallen harder on some groups and in some parts of the country than others, with a knock-on effect on the change in demand for different services in different local authorities. 

Overall, demand for libraries and the need for support of homeless people have grown. By contrast, demand for bus travel has yet to fully recover, challenging the commercial viability of the current funding model. Limited progress has been made in reducing the backlog of road maintenance or planning applications and there has been little meaningful change in the proportion of waste that is being recycled. 

Meanwhile, the picture in public health is mixed, with some increasing demands from sexual health services and alcohol misuse services while proportionately fewer children are being seen through early years health programmes. 

Given the pressures on local authority workforces, including dissatisfaction with pay and the loss of around a quarter of staff over the past decade, local authorities may struggle to improve service performance and address the falling satisfaction with councils and local areas. The ability of individual local authorities to address these problems will depend on a variety of factors, including funding levels, demographic demands and the quality of governance. 

In this chapter we cover local authority provided services in England. 

A box with text of key facts from the IfG's Performance Tracker chapter on neighbourhood services.

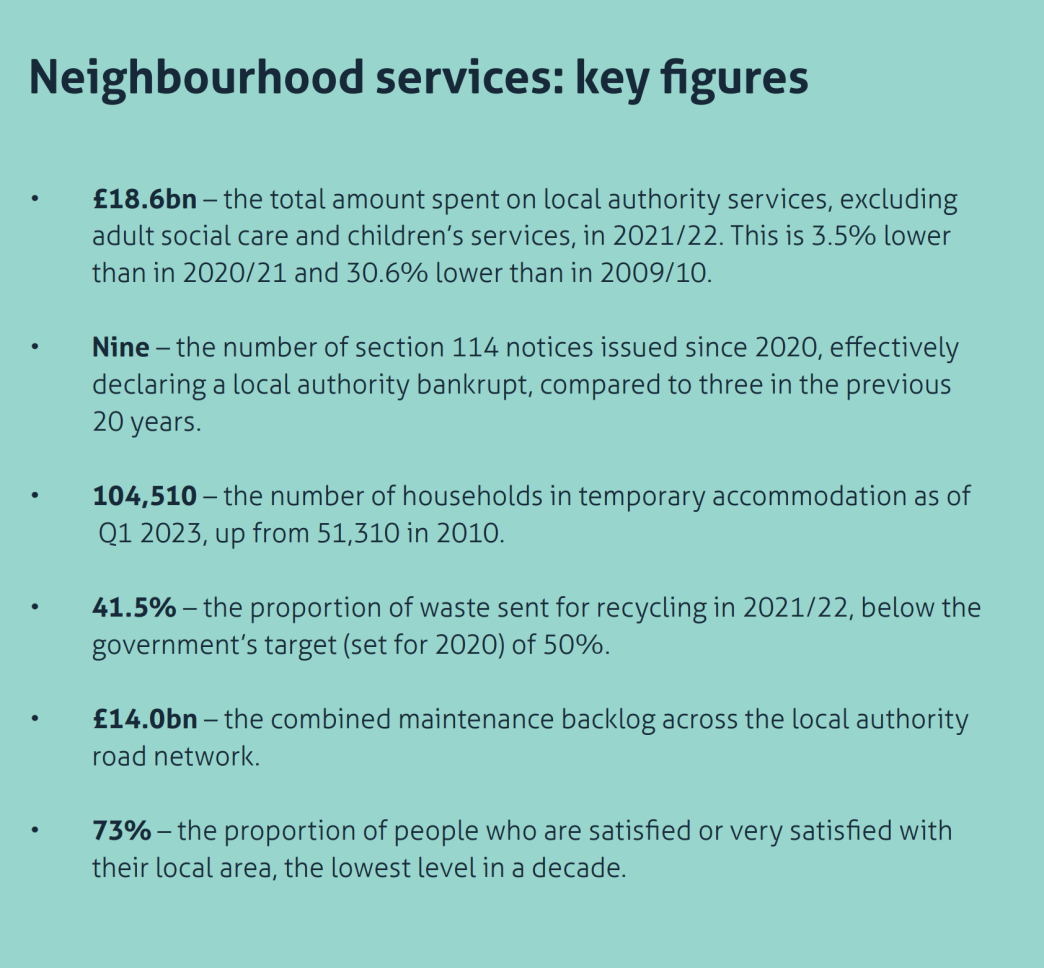
Overall spending on neighbourhood services fell in 2021/22, but there is substantial variation between services

In the decade before the pandemic, successive governments cut local authority grant funding, while demand for adult and children’s social care – covered in earlier chapters – and other statutory duties (such as homelessness services) continued to rise. These pressures forced councils to cut back funding for non-statutory services, making tough decisions about where the cuts should fall. 210 Atkins G and Hoddinott S, Neighbourhood Services Under Strain: How a decade of cuts and rising demand for social care affected local services, Institute for Government, April 2022, www.instituteforgovernment.org.uk/publication/neighbourhood-services-under-strain  Overall, local authority spending on services excluding adult social care and children’s services declined by 38.2% in real terms between 2009/10 and 2019/20.

With the onset of the pandemic, local authorities’ expenditure increased by 20.5% in 2020/21 as they took on new responsibilities. Funding then fell by 3.5% in 2021/22, from £19.9bn to £18.6bn. As a result, local authority spending on non-social care services was 12.3% higher than in 2019/20 but still 30.6% lower than in 2009/10 – though when emergency Covid spending is removed this equates to a 35.1% reduction. 

*This year Performance Tracker has been rescoped to focus on services that account for a higher proportion of neighbourhood services spending. We no longer track food safety, health and safety, and trading standards, which accounted for £0.29bn of expenditure in 2021/22. Instead, we now additionally monitor local authority homelessness, bus subsidy and public health services, which accounted for £7.23bn of expenditure in 2021/22.

The relatively small spending decrease in the last year hides variation between services. Like other statutory duties, spending on homelessness had markedly risen in the past decade and is now 82.6% higher in real terms than in 2009/10. However, spending in this area fell 0.4% in 2021/22. 

The greatest decline was seen in support to bus operators, which fell by 27.3% in 2021/22 compared to 2020/21, yet it remains 70.9% higher in real terms than before the pandemic. This is due to continuing support to bus operators, who, though performing more strongly than in 2020/21, remain reliant on high levels of financial support to maintain services in the face of lower passenger numbers. 217 Department for Transport, ‘Written statement to parliament: Bus funding update’, GOV.UK, 20 February 2023, www.gov.uk/government/speeches/bus-funding-update

Smaller declines were seen in waste collection and disposal, both of which declined 3.3% in real terms – though spending is still 5.8% higher than pre-pandemic levels for waste collection, a reflection of the increased volume of activity seen during the pandemic. The amount spent on road maintenance also declined by 1.3% in 2021/22, and it is now 2.7% below pre-pandemic spending. 

Like waste collection, planning work continued throughout the pandemic with social distancing less of a concern. Indeed, planning spending in 2021/22 is 4.4% higher in real terms than in 2019/20, increasing in both 2020/21 and 2021/22. 

The service with the greatest spending increase in 2021/22 was public health (excluding 0–5 year-old children’s spend),* which grew by 5.9% due to higher service demands and costs across most public health areas. As a result, spending is now 2.0% higher than in 2019/20. Meanwhile, spending on libraries flatlined, increasing by only 0.8%. This remains 6.9% lower than before the pandemic, and almost 50% lower than in 2009/10.

*Public health figures throughout the chapter excludes public health spend on the Covid-19 response. 

Neighbourhood services budgets remained tight in 2022/23 and 2023/24

Data on local authority spending in 2022/23 will not be published until December. However, it is likely that budgets were even tighter for these services in 2022/23 than the year before due to changes to the national living wage and high inflation and energy costs. 218 Local Government Association, ‘LGA analysis – Councils face almost £3 billion funding fap over next two years’, 4 July 2023, www.local.gov.uk/about/news/lga-analysis-councils-face-almost-ps3-billion-funding-gap-over-next-two-years  For example, road maintenance has been affected by energy- linked maintenance costs for signage and street lighting, 219 Asphalt Industry Alliance, ‘Annual Local Authority Road Maintenance Survey 2023’, 21 March 2023, www.asphaltuk.org/wp-content/uploads/ALARM-survey-2023-FINAL-with-links.pdf  with 70% of local authority respondents to an Asphalt Industry Association (AIA) survey reporting unforeseen costs in 2022/23, up from 56% of respondents in 2021/22. 

In the 2022 autumn statement the government outlined several measures to alleviate financial pressure on councils in 2023/24 and 2024/25 220 Davies N, Pope T, Nye P, Hoddinott S, Fright M and Richards G, What does the autumn statement mean for public services?, Institute for Government, 24 November 2022, accessed 1 September 2023, p. 7, www.instituteforgovernment.org.uk/publication/autumn-statement-2022-public-services  – full details of which are outlined in the ‘Adult social care’ chapter. 

The December 2022 local government finance settlement confirmed a £5.1bn increase in core funding for 2023/24, comprising a mix of £2.2bn of social care grants, £1.7bn of other grant funding* and £2.0bn of assumed additional council tax revenue.** Inflation, though, has both overshot and lasted longer than spending plans assumed. Local authority budgets have been further squeezed by changes to minimum wages, which – as the adult social care chapter shows – have brought an additional £1.8bn funding pressure in the adult social care sector in 2023/24. Similar costs are expected for the local government wage bill. 221 Institute for Government interview. 

While the situation will vary between local authorities, analysis from the Local Government Association (LGA) published in July 2023 suggests that councils will exceed core funding by £2bn in 2023/24 and £0.9bn in 2024/25. An interviewee told us that budget pressures will force the council to use reserves as a stop gap while they scale back the services they provide to the public. 222 Ibid.

*Including the Revenue Support Grant and retained business rates. 

**These were in part offset by £0.9bn of services and other grants. For further details see https://researchbriefings.files.parliament.uk/documents/CBP-9721/CBP-9721.pdf, p. 10.

Reserves are likely to have increased during the pandemic, but the precise level remains difficult to determine

Despite expectations that reserves would fall during the pandemic, 238 Atkins G, Pope T, Shepheard M and others, Performance Tracker 2021, Institute for Government, 19 October 2021, www.instituteforgovernment.org.uk/publication/performance-tracker-2021/neighbourhood-services 

 
usable reserves in England as a proportion of expenditure increased on average in 2020/21 across all categories of local authority. While, on average, usable reserves as a percentage of expenditure fell in unitary authorities and shire districts in 2021/22, this was not the case across other categories of local authority and on average all five types held proportionately higher levels of reserves in 2021/22 than in 2019/20. However, the precise numbers are sensitive to accounting adjustments required to compensate for the timing of emergency business rate reliefs disbursed early in the pandemic. And, as one interviewee pointed out, latent issues with data returns from councils may mean some councils’ reserves are currently overstated and it may be several years before these can be properly identified. 239 Institute for Government interview. 

Government ministers have been critical of councils for holding ‘baffling’ levels of reserves. 240 Weakley K, ‘DLUHC: Plan for more transparency over “baffling” reserves data’, Local Government Chronicle, 11 January 2023, retrieved 1 September 2023, www.lgcplus.com/finance/dluhc-plan-for-more-transparency-over-baffling-reserves-data-11-01-2023  And the rapid increase in reserves during the pandemic will, in some councils, relate to unspent Covid grants. However, increasing reserves is a rational decision when facing greater uncertainty around funding and in the broader external environment. Furthermore, arguing that councils should deplete reserves to finance day-to-day expenditure runs against good financial management practice. 241 Institute for Government interview.  Finally, while at a national level reserves increased in 2021/22, the situation varies considerably at a local level. Some councils, like Bradford, are warning that their reserves are running low 242 Holland J, ‘Bradford reserves “close to exhaustion” as director of finance warns “numerous councils are nearing s114 notice”’, Room151, 11 July 2023, retrieved 1 September 2023, www.room151.co.uk/treasury/bradford-reserves-close-to-exhaustion-as-director-of-finance-warns-numerous-councils-are-nearing-s114-notices  and a survey of 116 local authority draft accounts suggests usable reserves for unitary authorities and London borough authorities were depleted by 18% and 17% respectively in 2022/23. 243 Gilmore A and Bates D, ‘Published 22/23 draft accounts show “worrying” decrease in councils’ reserves’, Room151, 15 June 2023, retrieved 1 September 2023, www.room151.co.uk/treasury/published-22-23-draft-accounts-show-worrying-decrease-in-councils-reserves 

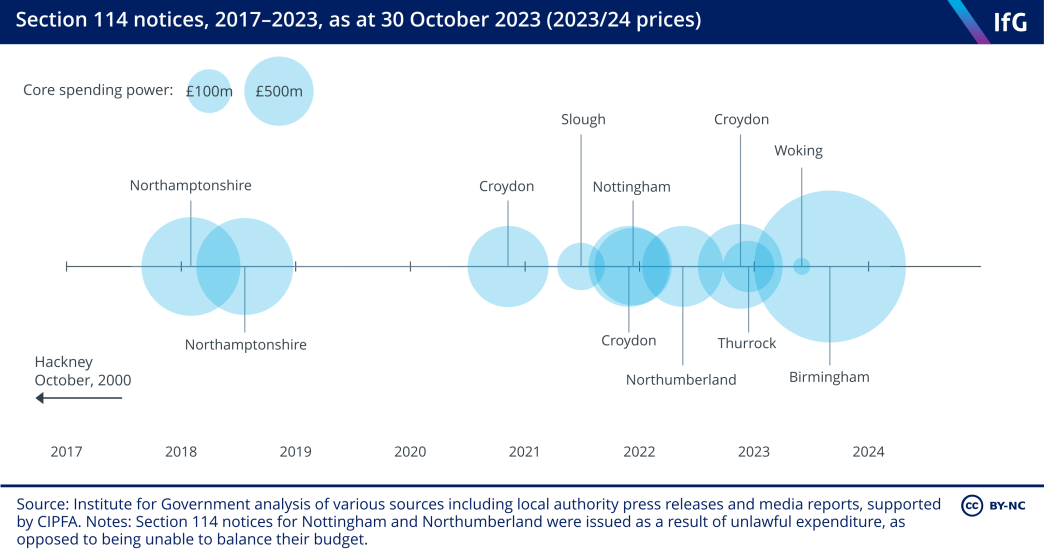
Some councils with risky investments have declared ‘bankruptcy’ but financial problems are more widespread

In the past year, several local authorities, including Croydon, 244 Fright M, ‘Croydon Council’s struggle to balance the books’, Institute for Government, 20 December 2022, www.instituteforgovernment.org.uk/comment/croydon-council-section-114  Thurrock 245 Ibid.  and Woking, 246 Fright M, ‘Croydon Council’s struggle to balance the books’, Institute for Government, 20 December 2022, www.instituteforgovernment.org.uk/comment/croydon-council-section-114  issued section 114 notices – effectively declaring themselves bankrupt 247 Sandford M, ‘Insight: What happens if a council goes bankrupt?’, House of Commons Library, 21 November 2022, retrieved 1 September 2023, https://commonslibrary.parliament.uk/what-happens-if-a-council-goes-bankrupt – after large losses on investments. 

Following cuts to local government grants, these local authorities sought alternative revenues through large-scale investments, financed by loans, often in commercial property. 248 Comptroller and Auditor General, Local authority investment in commercial property, Session 2019–20, HC 45, National Audit Office, 2020, www.nao.org.uk/wp-content/uploads/2020/02/Local-authority-investment-in-commercial-property.pdf  But several councils are now highly leveraged and in its recent Fiscal Risks and Sustainability report the OBR identified the £96bn borrowed by the local authority sector as a risk to public finances. 249 Gilmore A, ‘OBR: £96bn local authority borrowing presents “risk” to public finances’, Room151, 13 July 2023, retrieved 1 September 2023, www.room151.co.uk/151-news/obr-96bn-local-authority-borrowing-presents-risk-to-public-finances  Covid led to reduced demand for commercial property and recent interest rate rises have increased financing costs, affecting the commercial viability of these investments and leaving some councils highly exposed. 250 Hastings R, ‘Local authority finances have been driven to the brink by austerity and incompetence – now taxpayers are suffering’, i newspaper, 3 May 2023, retrieved 1 September 2023, https://inews.co.uk/news/politics/local-councils-austerity-incompetence-taxpayers-suffering-2312207  Additionally, in early September 2023, Birmingham City Council filed a section 114 notice due to issues with the valuation of an earlier equal pay settlement, 251 Holland J, ‘Birmingham City Council issues section 114 notice’, Room151, 5 September 2023, retrieved 8 September 2023, www.room151.co.uk/treasury/birmingham-city-council-issues-section-114-notice  and was reported to be considering issuing a second section 114 notice linked to a lack of urgency about the speed of responding to the equal pay settlement. 252 Weakley K, ‘Birmingham set to issue second 114 notice’, Local Government Chronicle, 21 September 2023, retrieved 21 September 2023, www.lgcplus.com/finance/birmingham-set-to-issue-second-114-notice-21-09-2023/ 

A timeline showing which local authorities have declared section 114 notices, from Northamptonshire in 2017 to most recently Birmingham in 2023. Larger circles correspond to greater core spending power.

The recent sharp rise in interest rates may also affect the viability of other capital finance projects, such as building renovations, the construction of new council offices or upgrading library facilities. 263 Institute for Government interview.  , 264 Comptroller and Auditor General, Financial sustainability of local authorities: capital expenditure and resourcing, Session 2016-17, HC 234, National Audit Office, 2016, p. 14, www.nao.org.uk/wp-content/uploads/2016/06/ Financial-sustainability-of-local-authorities-capital-expenditure-and-resourcing.pdf  These issues have contributed to the financial pressures that local authorities are under more generally. While the impact varies across local authorities, only 14% of senior council leaders are confident in the sustainability of their authority. More than 90% expect to increase taxes and increase fees for services, more than 50% will be cutting spending, and more than 70% expect to deplete ‘rainy day’ financial reserves. 265 Stride G, ‘The state of local government finance 2023: survey results’, LGiU, 7 March 2023, retrieved 1 September 2023, https://lgiu.org/publication/the-state-of-local-government-finance-2023-survey-results  The struggle to meet day-to-day spending has increased the likelihood of other section 114 notices. 266 Institute for Government interview.  For example, high use of temporary accommodation has left Hastings Council vulnerable to a section 114 notice. 267 BBC News, ‘Hastings council bankruptcy fears amid housing crisis’, 12 July 2023, retrieved 1 September 2023, www.bbc.co.uk/news/uk-england-sussex-66178662  Indeed, a survey of 47 urban local authorities found that 10% of its members may issue a section 114 notice this year and 20% may need to next year. 268 Boakye K, ‘LGA chair wans of more section 114s due to “broken” system’, Local Government Chronicle, 8 September 2023, retrieved 8 September 2023, www.lgcplus.com/finance/lga-chair-warns-of-more-section-114s-due-to-broken-system-08-09-2023/ 

Homelessness increased in 2022 and councils are struggling to find appropriate accommodation

Based on estimates from the Department for Levelling Up, Housing and Communities, there were 3,069 people sleeping rough in autumn 2022,* a 25.6% increase on the 2,443 estimated in 2021, though 28.1% below the 4,226 estimated in 2019. 269 Department for Levelling Up, Housing and Communities, ‘Official Statistics: Rough sleeping snapshot in England: autumn 2022’, 28 February 2023, retrieved 1 September 2023, www.gov.uk/government/statistics/rough-sleeping-snapshot-in-england-autumn-2022/rough-sleeping-snapshot-in-england-autumn-2022  This estimate is, however, a snapshot of one night in October. Estimates based on the Greater London Authority CHAIN dataset suggest a total of 10,053 rough sleepers in London during the 2022/23 financial year, which was 21% higher than in 2021/22. 270 Booth R, ‘Soaring number of rough sleepers in London “extremely alarming”’, The Guardian, 27 June 2023, retrieved 1 September 2023, www.theguardian.com/society/2023/jun/27/rough-sleepers-london-number-soaring-gla-data  This data also suggests that 6,391 people were seen sleeping rough for the first time in London in 2022/23. 271 Booth R, ‘Soaring number of rough sleepers in London “extremely alarming”’, The Guardian, 27 June 2023, retrieved 1 September 2023, www.theguardian.com/society/2023/jun/27/rough-sleepers-london-number-soaring-gla-data 

Part of the increase in rough sleeping over the past year may be linked to the ending of pandemic emergency measures such as controls on evictions and the ‘Everyone In’ programme, through which 9,866 people were put into hotels and emergency accommodation and 23,273 were moved into more settled accommodation by November 2020. 272 Comptroller and Auditor General, Investigation into the housing of rough sleepers during the COVID-19 pandemic, Session 2019-2021, HC 1075, National Audit Office, 2021, retrieved 1 September 2023, www.nao.org.uk/wp-content/uploads/2021/01/Investigation-into-the-housing-of-rough-sleepers-during-the-COVID-19-pandemic.pdf 

*The department estimates the total number of people sleeping rough on a given night in autumn. Further details on methodology can be seen here: www.gov.uk/government/statistics/rough-sleeping-snapshot-in-england-autumn-2022/rough-sleeping-snapshot-in-england-autumn-2022

The official estimates of homelessness are smaller than those calculated by others. The homelessness charity Crisis defines homelessness more broadly to include unconventional accommodation (for example, cars), hostels, unsuitable temporary accommodation and sofa surfing. 280 Watts B, Bramley G, Fitzpatrick S and others, ‘The homelessness monitor: Great Britain 2022’, Crisis, September 2022, retrieved 1 September 2023, p. 73, www.crisis.org.uk/media/248457/the-homelessness-monitor-great-britain-2022_full-report_final.pdf  , 281 Howells T, Davison A and Stoyanova S, ‘“Hidden“ homelessness in the UK: evidence review’, Office for National Statistics, 29 March 2023, retrieved 1 September 2023, www.ons.gov.uk/peoplepopulationandcommunity/housing/articles/hiddenhomelessnessintheukevidencereview/2023-03-29 

 
Based on this broader definition, Crisis estimates that approximately 242,000 households were homeless in 2022, up from 224,000 in 2018 and 206,000 in 2012. 282 Fitzpatrick S, Bramley G, McMordie L and others, ‘The Homelessness Monitor: England 2023’, Crisis, July 2023, retrieved 1 September 2023, p. 88, www.crisis.org.uk/media/utehvxat/homelessness-monitor-england_report-2023_v11.pdf 

Overall, it does appear that there has been a long-term increase in the number of households unable to afford accommodation. 283 Watts B, Bramley G, Fitzpatrick S and others, ‘The homelessness monitor: Great Britain 2022’, Crisis, September 2022, retrieved 1 September 2023, p. 40, www.crisis.org.uk/media/248457/the-homelessness-monitor-great-britain-2022_full-report_final.pdf This is due to a combination of factors including freezes to the local housing allowance,*, 284 Watts B, Bramley G, Fitzpatrick S and others, ‘The homelessness monitor: Great Britain 2022’, Crisis, September 2022, retrieved 1 September 2023, p. 32, www.crisis.org.uk/media/248457/the-homelessness-monitor-great-britain-2022_full-report_final.pdf  , 285 Wilson W, Hobson F and Harker R, ‘Local Housing Allowance (LHA): help with rent for private tenants’, House of Commons Library, 9 March 2023, https://commonslibrary.parliament.uk/research-briefings/sn04957  a reduction in available rental properties contributing towards higher rents 286 Geraghty L, ‘”A bad situation is becoming disastrous”: Number of homes for rent in London has plummeted since COVID’, Big Issue, 5 July 2023, retrieved 1 September 2023, www.bigissue.com/news/housing/number-of-homes-for-rent-in-london-has-plummeted-since-the-pandemic  and the broader cost-of-living crisis. 

*The local housing allowance (LHA) is a process for determining housing benefits for those renting from a private landlord – this is based on the number of bedrooms required for the claimant. 

Local authorities’ homelessness services appear to have struggled to keep up with higher demand over the past year. For example, the proportion of those securing suitable accommodation for more than six months fell from 39.0% in 2021/22 to 36.5% in 2022/23. Meanwhile, the proportion of those whose relief duty* has ended after 56 days without securing suitable accommodation rose from 40.0% to 43.4% over the same period. Under these circumstances, when 56 days have elapsed, the local authority’s duty relief to ‘homeless’ applicants ends 289 Shelter, ‘Local authority ends relief duty to homeless applicants’, (no date), retrieved 1 September 2023, https://england.shelter.org.uk/professional_resources/legal/homelessness_applications/ending_duties/local_authority_ends_relief_duty_to_homeless_appl…; and, instead, applicants are characterised as a priority need for long-term council accommodation, receiving temporary accommodation in the short term. 290 Shelter, ‘Who has priority need when applying as homeless’, (no date), retrieved 1 September 2023, https://england.shelter.org.uk/professional_resources/legal/homelessness_applications/priority_need_in_homelessness_applications/who_has_a_priority_n…;

*Since the passage of the Homelessness Reduction Act (2017), local authorities face an obligation to work to relieve homelessness for all eligible applicants who become homeless. For further details see https://researchbriefings.files.parliament.uk/documents/SN01164/SN01164.pdf 

The use of temporary accommodation has increased by 104.7% (more than doubled) since 2010 and now stands at 104,510 households, 301 Department for Levelling Up, Housing and Communities, ‘Statutory homelessness live tables’, 25 July 2023, retrieved 21 September 2023, www.gov.uk/government/statistical-data-sets/live-tables-on-homelessness  up from 51,310. 302 Department or Levelling Up, Housing and Communities, ‘Detailed local authority level homelessness prevention and relief figures: 2009 to 2016’, GOV.UK, https://assets.publishing.service.gov.uk/government/uploads/system/uploads/attachment_data/file/692748/Detailed_local_authority_level_homelessness_fi…; This is the highest use of temporary accommodation since 1998 and follows a 4.0% increase in the last quarter and a 10.0% increase over the past year. 303 Department for Levelling Up, Housing and Communities, ‘Statutory homelessness live tables’, 25 July 2023, retrieved 21 September 2023, www.gov.uk/government/statistical-data-sets/live-tables-on-homelessness  According to one interviewee, housing teams are competing with children’s services and immigration teams for appropriate private sector accommodation, driving up costs. 

Demands on library services increased during the past year

Despite a continuing reduction in library spending, demands on these services are increasing. Libraries saw a 68% increase in footfall between 2020/21 and 2021/22 as lockdowns lifted and people opted for more in-person services. This could also be linked to a shift in where people access services – as people return to centralised library sites which co-locate with other public services, such as Jobcentre Plus, GP surgeries 304 Mildenhall hub, (no date), retrieved 25 October 2023, www.mildenhallhub.info  and theatres. 305 Storyhouse, (no date), retrieved 25 October 2023, www.storyhouse.com  These centralised library sites experienced the largest reductions in footfall during the pandemic, as visitors went to smaller local branches. 306 Institute for Government interview.  Yet with fewer facilities on offer, small libraries attracted a relatively smaller footfall, and contributed to lower overall footfall during the pandemic. 307 Institute for Government interview.   

It is too early to tell the full impact of inflation on libraries but there is evidence it may have increased demand. According to a survey of 3,000 parents in December 2022, 20% reported buying fewer books for children due to cost-of-living pressures, a figure that rose to 1 in 3 among parents that reported struggling financially, with 28.2% of parents borrowing more children’s books from libraries. 308 National Literary Trust, ‘Children and young people’s access to books and educational devices at home during the cost-of-living’, 27 February 2023, retrieved 3 September 2023, https://literacytrust.org.uk/research-services/research-reports/children-young-people-book-access-cost-of-living   

Demand for other library services may also have increased, with 81% of libraries surveyed in June 2022 anticipating higher footfall in order to access warm spaces. 309 Libraries Connected, ‘Libraries and the cost of living crisis – briefing note’, June 2022, retrieved 3 September 2023,  www.librariesconnected.org.uk/resource/libraries-and-cost-living-crisis-briefing-note  By that time, 59% of libraries had seen an increase in people attending events and staying for the rest of the day and 44% of libraries had already experienced increased demand for services to help with the cost-of-living crisis. 310 Libraries Connected, ‘Libraries and the cost of living crisis – briefing note’, June 2022, retrieved 3 September 2023, www.librariesconnected.org.uk/resource/libraries-and-cost-living-crisis-briefing-note  Relevant services provided by libraries include food, clothing and hygiene banks, access to price comparison websites, personal budgeting classes and workshops, and help with applying for and managing Universal Credit. 

Waste collection, disposal and recycling levels have been stable in the past year

The amount spent on waste collections and disposals decreased slightly in 2021/22 – both falling by 3.3% in real terms – but the volume of waste disposals increased by 0.9% over the year. The proportion of household waste that was sent for recycling remained almost unchanged at 41.5% in 2021/22, up from 41.4% in 2020/21, which was the lowest level since 2011/12. The year 2021/22 was also the fifth in a row that incineration exceeded recycling as the most used method of waste disposal, with 47.4% of waste being incinerated. The government has still yet to meet its target (originally set for 2020) of 50% recycling and an assessment from the Climate Change Committee suggests it is off course for meeting the 65% recycling target by 2035. 316 Climate Change Committee, Progress in reducing emissions, 2023 Report to Parliament, June 2023, p. 302, www.theccc.org.uk/publication/2023-progress-report-to-parliament

While the government missed its target for recycling of household waste, it exceeded its 2020 target to reduce the amount of biodegradable municipal waste (BMW) sent to landfill. 317 Comptroller and Auditor General, The government’s resources and waste reforms for England, Session 2022–23, National Audit Office, 2023, www.nao.org.uk/wp-content/uploads/2023/06/governments-resources-and-waste-reforms.pdf The government has set itself a net zero strategy target of eliminating BMW, including food waste, sent to landfill by 2028. 318 Comptroller and Auditor General, The government’s resources and waste reforms for England, Session 2022–23, National Audit Office, 2023, Figure 1, www.nao.org.uk/wp-content/uploads/2023/06/governments-resources-and-waste-reforms.pdf., However, it may struggle to meet this, with the amount of BMW being sent to landfill increasing by 8% in 2021. 

Public health 

In April 2013, responsibility for public health transferred to local authorities, including a duty to improve public health and the provision of certain public health services. 319 Heath S, ‘Local authorities’ public health responsibilities (England)’, House of Commons Library, 13 March 2014, retrieved 26 September 2023, https://researchbriefings.files.parliament.uk/documents/SN06844/SN06844.pdf In exercising these responsibilities, local authority public health teams collaborate with local partners to improve health outcomes and commission services directly. 320 Department of Health and Social Care, ‘Directors of public health in local government: roles, responsibilities and context’, 29 June 2023, retrieved 3 September 2023, www.gov.uk/government/publications/role-of-the-director-of-public-health-in-local-authorities/directors-of-public-health-in-local-government-roles-re…; However, the full range of public health interventions – including local authority measures targeting health and life expectancy – is difficult to assess. We therefore evaluate three services within public health where output metrics allow clearer assessment of local authority performance: sexual health services, substance misuse and children’s early years health programmes.* 

*The services discussed in this chapter represent a subset of services from the largest public health spending areas. 

Sexual health services – sexually transmitted infection (STI) rates are up due to society reopening and increased testing

Spending on STI testing and treatment increased by 4.0% in real terms between 2020/21 and 2021/22 to £377.8m (in 2023/24 terms). However, it remains 3% below spend in 2019/20 and 28% below 2013/14 levels. Other sexual health services have also markedly reduced over this period, with funding for contraception falling by 24% and spending on advice, prevention and promotion falling by 45% since 2013/14. 

The recorded incidence of most STIs is up from pandemic-era lows but remains below pre-pandemic highs.** The STI with the highest observed prevalence in the public is chlamydia, of which there were 352.4 cases per 100,000 in 2022, up 24% on 2021, though still below 2019 levels. 323 UK Health Security Agency, ‘Sexually transmitted infections and screening for chlamydia in England: 2022 report’, 6 June 2023, retrieved 3 September 2023, www.gov.uk/government/statistics/sexually-transmitted-infections-stis-annual-data-tables/sexually-transmitted-infections-and-screening-for-chlamydia-…; A similar pattern can be seen for herpes (44 cases per 100,000) and other genital warts (46 cases per 100,000). However, rates of both gonorrhoea and syphilis are now above 2019 levels, reaching 146 per 100,000 people and 15 per 100,000 respectively – in each case, the highest rate since comparable records began in 2013. Increasing STI identification has contributed to an increase in the need for sexual health services to notify the partners of people with STIs across almost all STI categories. Overall, the number of partner notifications grew from 79,805 in 2021 to 90,984 in 2022. 324 UK Health Security Agency, ‘Sexually transmitted infections (STIs) annual data tables’, Table 4: all STI diagnosis and service numbers in England and regions by gender and sexual orientation, 2018 to 2022, 6 June 2023, www.gov.uk/government/statistics/sexually-transmitted-infections-stis-annual-data-tables

**Data on the testing, diagnosis and care outcomes related to HIV and PrEP uptake are reported separately online at www.gov.uk/government/statistics/hiv-annual-data-tables/hiv-testing-prep-new-hiv-diagnoses-and-care-outcomes-for-people-accessing-hiv-services-2022-r…

The overall trend has likely been driven by the lifting of pandemic-era social distancing restrictions and the reopening of many sexual health services that were closed during 2020. The higher recorded STI rates may also be in part attributable to more testing, which increased as services reopened.* Between 2020 and 2022 the volume of testing increased for chlamydia by 22%, gonorrhoea by 32%, hepatitis A, B or C by 69%, syphilis by 39% and HIV by 25%. These increases have not been enough to fully reverse the marked declines seen during the pandemic and testing for most STIs remains below 2019 levels, most notably HIV testing, which has fallen by more than 40%. Consequently, STI caseload data may underestimate the prevalence of some STIs currently in the community. 

While the number of tests conducted has fallen, local authorities are now delivering more STI consultations than ever – up from 3.9 million to 4.4 million between 2019 and 2022. This is largely due to the shift to online consultations, which increased from 0.5 million consultations in 2019 to 1.7 million in 2022. This more than offset the decline in face-to-face consultations, which fell from 3.3 million to 2.2 million over the same period. 

*While increasing volumes of STI testing were delivered in this time, sexual health services were redeployed in response to the emergency roll-out of mpox vaccines during 2022, which may have limited access to STI testing in some areas. 

Substance and alcohol misuse treatment: increasing contact with services hasn’t translated into substantially more successful treatment

While spending on drug misuse treatment for adults increased by 2.0% to £396.9m in 2021/22, it remains 2% below 2019/20 levels and down 47% against 2013/14. By contrast, spending on alcohol misuse treatment only marginally increased to £195.0m in 2021/22, though this is 3% lower than 2019/20 levels and down 23% on 2013/14 levels. Preventative spending has improved more markedly between 2020/21 and 2021/22, by 7.0% for alcohol misuse in adults and 14.7% for drug misuse in adults, standing 2.0% and 11% higher in respective terms than 2019/20 levels.* Overall spending on drugs and alcohol treatment is likely to increase in 2022/23 and 2023/24 due to £154.3m of time-limited grants. 330 Office for Health Improvement and Disparities, ‘Additional drug and alcohol treatment funding allocations: 2023 to 2024 and 2024 to 2025’, Guidance, 16 February 2023, retrieved 25 September 2023, www.gov.uk/government/publications/extra-funding-for-drug-and-alcohol-treatment-2023-to-2025/additional-drug-and-alcohol-treatment-funding-allocation…;

Between 2019/20 and 2021/22, the number of adults in contact with drug and alcohol services rose from 270,705 to 289,215, a 6.8% increase. 331 Office for Health Improvement and Disparities, ‘Adult substance misuse treatment statistics 2021 to 2022: report’, 19 January 2023, retrieved 3 September 2023, www.gov.uk/government/statistics/substance-misuse-treatment-for-adults-statistics-2021-to-2022/adult-substance-misuse-treatment-statistics-2021-to-20…;  www.gov.uk/government/statistics/substance-misuse-treatment-for-adults-statistics-2020-to-2021/adult-substance-misuse-treatment-statistics-2020-to-20…; Despite this, the number of adults entering treatment in 2022 (133,704) was similar to the previous two years (130,490 and 132,124). 332 Office for Health Improvement and Disparities, ‘Adult substance misuse treatment statistics 2021 to 2022: report’, 19 January 2023, retrieved 3 September 2023, www.gov.uk/government/statistics/substance-misuse-treatment-for-adults-statistics-2021-to-2022/adult-substance-misuse-treatment-statistics-2021-to-20… The two biggest categories of need among those in treatment came from opiate treatment (49%) and alcohol treatment (29%), 333 Office for Health Improvement and Disparities, ‘Adult substance misuse treatment statistics 2021 to 2022: report’, 19 January 2023, retrieved 3 September 2023, www.gov.uk/government/statistics/substance-misuse-treatment-for-adults-statistics-2021-to-2022/adult-substance-misuse-treatment-statistics-2021-to-20… with the number accessing the latter up by 10% in 2021/22. Despite reaching 84,697 people in treatment, this is still substantially below the peak of 91,651 in 2013/14. 334 Office for Health Improvement and Disparities, ‘Adult substance misuse treatment statistics 2021 to 2022: report’, 19 January 2023, retrieved 3 September 2023, www.gov.uk/government/statistics/substance-misuse-treatment-for-adults-statistics-2021-to-2022/adult-substance-misuse-treatment-statistics-2021-to-20…

While there have been small improvements in the rate of successful completion of drug and alcohol treatments between 2020 and 2021, still only a minority of those who enter treatment complete it and do not return to treatment services in the following six months. In 2021, only 5.0% of people who attended opiate drug treatment programmes completed them successfully and did not return within six months; the figure for non-opiate drug treatment programmes was 34.3%, and 36.6% for alcohol treatment programmes. In all cases, this is below the success rates achieved in the previous decade. 

*Disaggregated spending lines for preventative expenditure is not available for 2013/14. 

A 17-year analysis by the Office for Health and Improvement Disparities (OHID) suggests that 14% of people starting to access treatment in England between 2005 and 2006 were still receiving treatment in March 2022. 337 Office for Health Improvement and Disparities, ‘Adult substance misuse treatment statistics 2021 to 2022: report’, 19 January 2023, retrieved 3 September 2023, www.gov.uk/government/statistics/substance-misuse-treatment-for-adults-statistics-2021-to-2022/adult-substance-misuse-treatment-statistics-2021-to-20…; Separate analysis by OHID shows that 42% of people in treatment in England at the end of March 2022 had accessed drug and alcohol treatment services four or more times before. 338 Office for Health Improvement and Disparities, ‘Adult substance misuse treatment statistics 2021 to 2022: report’, 19 January 2023, retrieved 3 September 2023, www.gov.uk/government/statistics/substance-misuse-treatment-for-adults-statistics-2021-to-2022/adult-substance-misuse-treatment-statistics-2021-to-20…;  

Children’s early years health programmes – proportionately fewer children are being seen by health visitors

The proportion of babies visited within 14 days of being born fell markedly in 2021/22, from 88.0% to 82.7%. Analysis from the Institute of Health Visiting suggests that only 76% of new birth visits, 54% of 6–7 week postnatal contacts and 4% of 3–4 months check-ups are carried out by a qualified health visitor. 347 Institute of Health Visiting, State of Health Visiting, UK survey report: A vital safety net under pressure, 18 January 2023, retrieved 3 September 2023, p. 16, https://bit.ly/3DqvCrH Indeed, England is an outlier in this respect, underperforming against other nations in the UK in terms of the percentage of check-ups undertaken by a qualified health visitor. 348 Institute of Health Visiting, State of Health Visiting, UK survey report: A vital safety net under pressure, 18 January 2023, retrieved 3 September 2023, p. 16, https://bit.ly/3DqvCrH

One factor that may have contributed to this is the 7.1% fall in the number of NHS- employed health visitors,* from 6,595 to 6,124 between 2020/21 and 2021/22. 349 NHS, ‘NHS workforce statistics – March 2023 (including selected provisional statistics for April) 29 June 2023, retrieved 3 September, https://digital.nhs.uk/data-and-information/publications/statistical/nhs-workforce-statistics/march-2023 This continues a longer-term trend, with the size of this workforce falling by around 40% across NHS and non-NHS providers. 350 Institute of Health Visiting, State of Health Visiting, UK survey report: A vital safety net under pressure, 18 January 2023, retrieved 3 September 2023, p. 23, https://bit.ly/3DqvCrH 

Workforce shortages have contributed to under provision of health reviews – a survey of health visiting practitioners in autumn 2022 showed that only 13% of health visitors in England are able to deliver antenatal contact to all families, only 54% are able to deliver the 6–8 week postnatal reviews to all families and only 15% are able to deliver the 9–12 month review to all families. 351 Institute of Health Visiting, State of Health Visiting, UK survey report: A vital safety net under pressure, 18 January 2023, retrieved 3 September 2023, p. 6, https://bit.ly/3DqvCrH  The Institute of Health Visiting estimates that as of November 2022, one in five children were missing out on vital health and development reviews. 352 Institute of Health Visiting, State of Health Visiting, UK survey report: A vital safety net under pressure, 18 January 2023, retrieved 3 September 2023, p. 6, https://bit.ly/3DqvCrH   Analysis of the Healthy Child Programme in 2022 suggests that children from the most deprived backgrounds are marginally less likely to have a 2 to 2½ year health review than those from the least deprived backgrounds and, for local authorities where data was available, children in care were much less likely than others to have a health check recorded. 353 National Institute of Health and Care Research, ‘Almost 1 in 4 toddlers miss the 2 year development check’, 19 October 2022, retrieved 3 September 2023, https://evidence.nihr.ac.uk/alert/almost-1-in-4-toddlers-miss-the-2-year-development-check 

Demand for bus services has fallen, requiring greater government subsidy

Use of buses fell during the pandemic and has yet to return to pre-pandemic levels. In English metropolitan areas, 0.6 billion passenger journeys were made in 2021/22, up from 0.3 billion in 2020/21 yet still 30.8% below the 0.8 billion passenger journeys in 2019/20. Similarly, there were 0.8 billion passenger journeys travelled in English non-metropolitan areas in 2021/22, double the 0.4 billion in 2020/21 yet still 31.5% below the 1.1 billion passenger journeys in 2019/20. 354  
Institute for Government analysis of Department for Transport, ‘Local bus passenger journeys (BUS01), 27 June 2023, retrieved 3 September, https://assets.publishing.service.gov.uk/government/uploads/system/uploads/attachment_data/file/1132738/bus01.ods
 

*Health visitors are registered nurses or midwives that have received additional training in community public health nursing. The majority of public health nurses are employed by the NHS. The responsibility for commissioning health services, however, lies with local authorities. Delivery models vary across local authorities, with some health visiting services integrated into working with other teams. For examples of this see www.local.gov.uk/sites/default/files/documents/improving-outcomes-childr-bf1.pdf 

The drop in the number of bus journeys has been bigger in some groups than others. For example, elderly and disabled passenger numbers are down 38.2% in English metropolitan areas and down 42.7% in non-metropolitan areas in 2021/22. 366 Ibid.

The fall in passenger numbers against pre-pandemic levels has challenged the commercial model of bus operators. 367 Pickett L, Stewart I and Page M, ‘The National Bus Strategy: Bus policy in England outside London’, House of Commons Library, 17 May 2022, retrieved 3 September 2023, https://commonslibrary.parliament.uk/research-briefings/cbp-9464  Prior to the pandemic, local authorities were already subsidising bus operators to provide services that would not be commercially viable without public support and to reimburse concessionary fares.*, 368 Tyers R, Edwards H, Page M and Stewart I, ‘Buses and Taxis FAQ’, House of Commons Library, 13 January 2023, retrieved 3 September 2023, https://commonslibrary.parliament.uk/research-briefings/cbp-8734  Yet even before the pandemic, analysis undertaken by the North East Combined Authority suggests grants failed to keep up with costs, 369 North East Combined Authority (NECA), ‘Supplementary written evidence submitted to the Transport Select Committee’, February 2019, retrieved 3 September 2023, https://committees.parliament.uk/writtenevidence/99284/html leading to services being left at risk of closure. 370 Whitehead M, ‘Underfunding of bus scheme leaves elderly “isolated”’, LocalGov, 11 February 2019, retrieved 3 September 2023, www.localgov.co.uk/Underfunding-of-bus-scheme-leaves-elderly-%E2%80%98isolated%E2%80%99/46852 

In July 2021, the government launched the temporary Bus Recovery Grant – a £226.5m fund to subsidise low bus fares and support bus operators. 371 House of Commons Transport Committee, Implementation of the National Bus Strategy, Fourth report of the session 2022–23 (HC 161), The Stationery Office, 30 March 2023, p. 10, https://committees.parliament.uk/publications/34612/documents/190548/default This was supposed to be in place until March 2022. 372 Pickett L, The National Bus Strategy: Bus policy in England outside London, House of Commons Library, 17 May 2022, p. 22, retrieved 3 September 2023, https://researchbriefings.files.parliament.uk/documents/CBP-9464/ CBP-9464.pdf  Yet sustained pressure on bus operators, including higher fuel prices, pressures on staff recruitment linked to national driver shortages and DVLA licensing delays, 373 House of Commons Transport Committee, Implementation of the National Bus Strategy, Fourth report of the session 2022–23 (HC 161), The Stationary Office 30 March 2023, para. 13, https://committees.parliament.uk/publications/34612/documents/190548/default  has led to the scheme being extended repeatedly. Indeed, a House of Lords committee raised concerns in early 2023 that reducing this emergency support could lead to a reduction in services of up to 20%. 374 Scott E, ‘Built Environment Committee: Public transport in towns and cities’, House of Lords Library, 30 March 2023, retrieved 3 September 2023, https://lordslibrary.parliament.uk/built-environment-committee-public-transport-in-towns-and-cities  In February 2023, the government provided a further £155m to extend the Bus Recovery Grant and the £2 bus fare cap until 30 June 2023, 375 Department for Transport, ‘Written statement to parliament: Bus funding update’, GOV.UK, 20 February 2023, www.gov.uk/government/speeches/bus-funding-update
 
with this later being extended until October 2023. 376 Department for Transport, ‘£2 bus fare cap: Guidance’, 1 July 2023, retrieved 3 September 2023, www.gov.uk/guidance/2-bus-fare-cap In May 2023, the government made a further £200m available to extend the £2 bus cap to 30 November 2023 and run a £2.50 bus cap to November 2024. The government also released £160m to local authorities to assist with the delivery of the government’s national bus strategy between July 2023 and March 2025. 

*Additionally, the Bus Services Operators Grant is paid by the Department for Transport directly to bus operators. For further details see https://researchbriefings.files.parliament.uk/documents/CBP-8734/CBP-8734.pdf, p. 20. 

Following a 1.3% real-terms decline in spending between 2020/21 and 2021/22, there has been little change in the performance of road maintenance services. The proportion of local authority-maintained A, B and C roads that require maintenance has remained flat over the last year, continuing a longer-term trend since the mid- 2010s. The number of unclassified roads in need of maintenance fell from 17% to 15%, but this only takes it back to where it was in 2019/20. Official data for 2022/23 has yet to be released, but estimates from the Asphalt and Industry Association (AIA) suggest a small deterioration in the quality of unclassified roads in the last year, with 16% of roads classified as red and 29% of roads classified as amber, up from 15% and 27% respectively in 2021/22. 379 Asphalt Industry Alliance, ‘Annual Local Authority Road Maintenance Survey 2023’, 21 March 2023, www.asphaltuk.org/wp-content/uploads/ALARM-survey-2023-FINAL-with-links.pdf The AIA estimates that the combined maintenance backlog across the network is now £14.02bn and would take 11 years to fully repair with adequate funding and resources. 380 Ibid.

A sharp fall in planning applications eased some pressures on planning departments, but many still face large backlogs

Spending on planning services increased 1.8% in real terms in 2021/22 to £1.2bn. This is 4.4% higher than in 2019/20, but remains 16.3% lower than in 2009/10. 

There was a sharp rise in planning applications in 2021/22 (possibly attributable to a pandemic-era spike in home improvements), but the number of planning applications submitted has now returned to pre-pandemic trends, with 395,227 applications submitted in 2022/23, a 13.9% decline from 459,177 cases in 2021/22. The recent reduction may also reflect depressed demand, as higher prices reduce the viability of new projects. 

The reduction in demand has helped authorities to limit the expansion of the backlog of applications. In 2022/23, 87% of major planning applications, 83% of minor applications and 87% of other applications* were decided within time limits. This broadly returns performance to the pre-pandemic trend. 

However, a significant minority of cases are still not decided within time limits, and earlier this year nine underperforming councils were instructed by DLUHC to improve their performance or face their cases being transferred to the planning inspectorate. 386 Jack Shaw, Tweet, 12 May 2023, https://twitter.com/JackTShaw/status/1656975858496675840 Further, 22% of architects’ practices surveyed in April 2023 had needed to abandon projects in the past three months due to delays in processing of planning applications; 387 The Royal Institute of British Architects, RIBA future trends survey: April 2023, p. 5, https://riba-prd-assets.azureedge.net/-/media/GatherContent/Business-Benchmarking/Additional-Documents/RIBA-Future-Trends-Report-Apr-2023pdf.pdf  this was a threefold increase on the rate in 2021. 388 Highfield A, ‘“Crisis” in planning recruitment is bottlenecking project starts’, Architects Journal, 1 June 2023, retrieved 3 September 2023, www.architectsjournal.co.uk/news/crisis-in-planning-recruitment-is-bottlenecking-project-starts 

Industry commentators attribute this to local authorities struggling to recruit new staff following a mass exodus after the pandemic. 389 Highfield A, ‘“Crisis” in planning recruitment is bottlenecking project starts’, Architects Journal, 1 June 2023, retrieved 3 September 2023, www.architectsjournal.co.uk/news/crisis-in-planning-recruitment-is-bottlenecking-project-starts  Only 1 in 10 council planning departments have their full staff complement and more than half of councils were at no more than 90% capacity between 1 January and 31 December 2022. 390 Kenyon M, ‘Revealed: capacity and churn issues facing planning teams’, Local Government Chronicle, 16 May 2023, retrieved 3 September 2023, www.lgcplus.com/services/regeneration-and-planning/revealed-capacity-and-churn-issues-facing-planning-teams-16-05-2023/   

*Other applications include: householder developments, listed building consents, and other planning related decisions. For full details see https://scambs.moderngov.co.uk/documents/s42075/Adoption%20of%20Statement%20of%20Community%20Involvement%20-%20Appendix%201d%20-%20Types%20of%20plann…;

Local authorities face widespread recruitment and retention problems

Local government faces a long-term workforce capacity problem. 403 Institute for Government interview.  While demands on councils have increased, the number of local authority staff was cut over the past decade: between Q4 2012 and Q1 2023 both headcount and FTE fell by 23.8%. 404 Institute for Government analysis of Local Government Association, ‘Local Government Employment Quarter 4, 2022’, retrieved 3 September 2023, www.local.gov.uk/sites/default/files/documents/QPSES%202022%20Q4%20-%20summary_0.pdf; Local Government Association, ‘Local Government Employment Quarter 4, 2012’ retrieved 3 September 2023, www.local.gov.uk/sites/default/files/documents/qpses-2012-q4-summary-pdf-528.pdf 

Local authorities now also face recruitment and retention challenges. In a survey conducted by the LGA, 94% of councils reported experiencing recruitment and retention difficulties, with 58% struggling to recruit planning officers and 53% having problems finding legal professionals. 405 Local Government Association, Local Government Workforce Survey 2022, research report, May 2022, pp. 12–14,www.local.gov.uk/sites/default/files/documents/LG%20Workforce%20Survey%202022%20-%20Final%20for%20Publication%20-%20Tables%20Hard%20Coded.pdf 
 
Local authorities are struggling to compete with private sector pay and are losing staff because of it. 406 Calkin S, ‘Widespread workforce shortages revealed’, Local Government Chronicle, 16 February 2022, retrieved 11 July 2022, www.lgcplus.com/politics/workforce/widespread-workforce-shortages-revealed-16-02-2022  As one of the lowest-paying public sector employers, local government also faces competition from other public sector bodies like the NHS. 407 Cooke N, ‘August 2022: Addressing the workforce capacity crisis in local government’, Local Government Association, August 2022, retrieved 3 September 2023, www.local.gov.uk/our-support/workforce-and-hr-support/workforce-blog/august-2022-addressing-workforce-capacity 

Local government may also face additional staffing challenges due to strikes. In February 2023, the LGA, acting for the National Employers’ Council, offered staff a £1,925 pay rise effective from 1 April 2023 – equivalent to a 9.42% pay rise for those on the lowest salary band and 3.88% for those on the highest pay spines. The total increase to the national pay bill was estimated at £1.093bn. 408 Kenyon M, ‘Council staff offered £1,925 pay rise’, Local Government Chronicle, 23 February 2023, retrieved 3 September 2023, www.lgcplus.com/politics/workforce/council-staff-offered-1925-pay-rise-23-02-2023 This was rejected by 75% of Unite local authority staff (including refuse collection workers, housing workers and care staff), 409 Unite the Union, ‘Local government workers deserve fair pay’, 24 August 2023, retrieved 3 September 2023,  www.unitetheunion.org/campaigns/local-government-workers-deserve-fair-pay 64% of GMB local authority members (including carers, school staff, social workers and refuse collection workers) 410 Boakye K, ‘GMB joins Unite in rejecting pay offer’, Local Government Chronicle, 10 May 2023, retrieved 3 September 2023, www.lgcplus.com/politics/workforce/gmb-joins-unite-in-rejecting-pay-offer-10-05-2023  and council chief executives – who were offered a 3.5% uplift. 411 Knott J, ‘Chiefs reject 3.5% pay rise offer’, Local Government Chronicle, 31 May 2023, retrieved 3 September 2023, www.lgcplus.com/politics/workforce/chiefs-reject-3-5-pay-rise-offer-31-05-2023 Only council service directors have accepted the deal. While Unison (which represents some council employees) has decided against calling strike action, Unite staff at 23 local authorities are planning to strike in the autumn and ballots are under way at GMB to decide whether staff will undertake industrial action later in the year. 412 Boakye K, ‘GMB ballots for strikes over national pay offer’, Local Government Chronicle, 12 September 2023, retrieved 23 September 2023, www.lgcplus.com/politics/workforce/gmb-ballots-for-strikes-over-national-pay-offer-12-09-2023  

While the current offer has been rejected by the majority of unions, it is nonetheless already higher than some councils anticipated for 2023/24. 413 Institute for Government interview.  Councils may struggle to finance a higher settlement with no additional resources. 414 Institute for Government interview. 

Satisfaction with councils is falling, but not evenly across areas or services

People’s satisfaction with their local area reached its lowest level in over a decade in June 2023, though a large majority of residents, 73%, were still either very or fairly satisfied with their local area. Satisfaction with local councils has been in decline since February 2022, with 60% of residents now satisfied with their local council – on par with pre-pandemic series lows from October 2018 and February 2019. Overall, there has been a faster decline in satisfaction with local councils, which declined by 12 percentage points between September 2012 and June 2023 compared to an 11 percentage point decline in satisfaction with local area – though in both cases satisfaction recorded series highs at the onset of the pandemic. 

The trends for individual services differ – though data is not available for all services covered in this chapter. Satisfaction with both waste collection and libraries has declined slightly in the last year (to 79% and 36% respectively). While satisfaction with waste collection has remained broadly flat over the past decade, satisfaction with libraries has declined by 4 percentage points since June 2022. By contrast, satisfaction with road maintenance declined at a faster rate in the past year to 33%, in line with series low observations of 32% scored in February 2020 and June 2018. 416 Local Government Association, Polling on resident satisfaction with councils: Round 35, June 2023, www.local.gov.uk/sites/default/files/documents/Polling-on-resident-satisfaction-with-councils-Round-35-Research-Report-June-2023-AA.pdf 

Related content

14 MAR 2024 Project

Performance Tracker

Our flagship report assesses the comparative problems faced by critical public services such as the NHS, schools and the police.

03 JAN 2024 IfG in the news

BBC News: Junior doctor strikes

Senior researcher Stuart Hoddinott speaks to BBC News amid the ongoing junior doctor strike, and comments on the impact on the performance of the NHS.