Performance Tracker 2023: Hospitals
Despite more funding and higher staff numbers, hospitals are struggling to return to pre-pandemic performance levels.
Hospitals have experienced a string of crises in the past few years: Covid, high inflation, one of the worst flu seasons on record, and ongoing industrial action. These have compounded existing performance problems caused by underinvestment in capital, cuts to management capacity and running the system ‘too hot’. This has made it impossible for the service to operate normally.
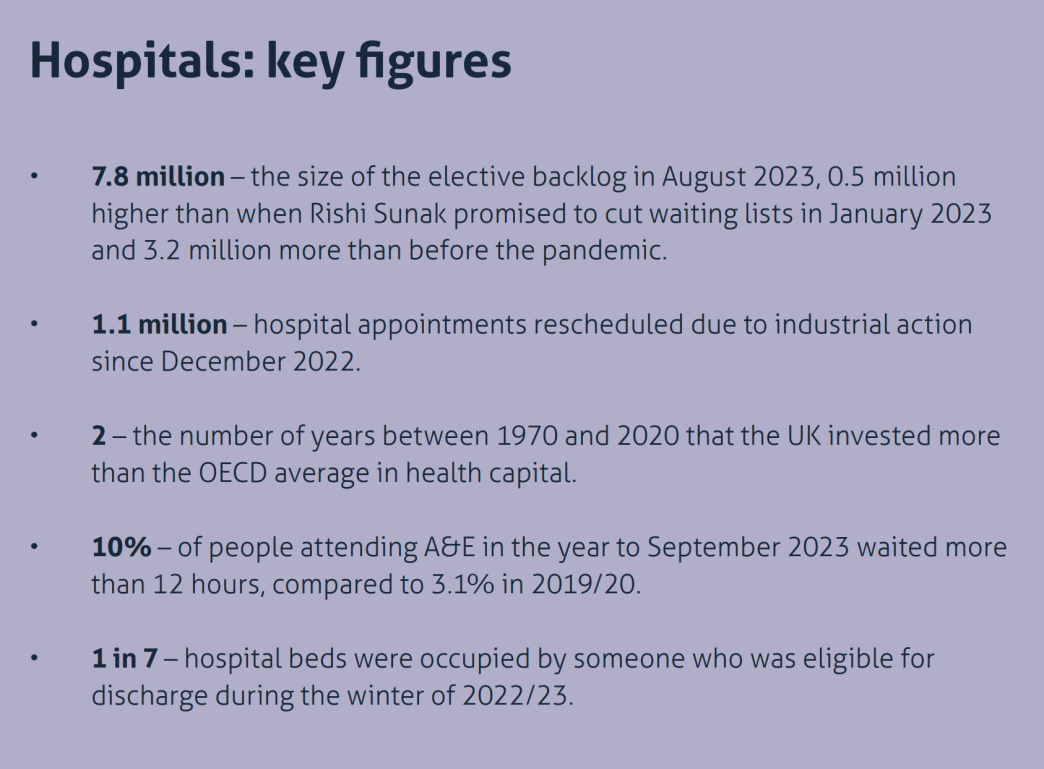
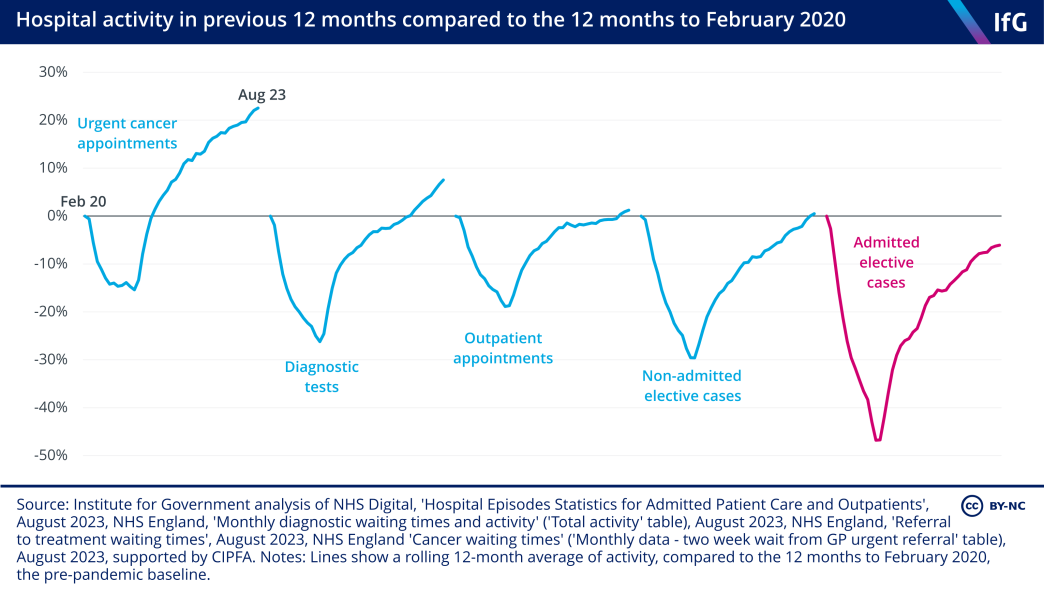
This is evident in the difficulties that the service has had in returning to pre-pandemic activity levels in some areas – a standard of performance that was already well below that of 2010. Hospitals completed fewer elective cases* and outpatient appointments in 2022/23 than in 2019/20. While hospitals carried out more urgent cancer appointments and diagnostic tests, the length of time patients are waiting to receive elective and cancer treatment is higher on average now than it was before the pandemic, and the elective backlog is still growing by around 100,000 cases every month, reaching 7.8 million in August 2023.
Slower flow of patients through hospitals continues to contribute to poor performance of urgent and emergency care, which, while better than during the winter of 2022/23, is still substantially worse than pre-pandemic levels. Better co-ordination across hospitals, general practice, community care and adult social care would help improve hospital discharge and keep people out of hospital in the first place. But the government has hampered this by cutting the budgets for the management of integrated care systems (ICSs) – the 42 regional bodies that oversee NHS activity across England and the government’s own reform designed to improve co-ordination between services – by 30%, less than a year after placing them on a statutory footing. The need to find the savings required has diverted the already limited management and planning resources of ICSs away from improving integration.
Poor hospital performance comes despite large increases in both spending and numbers of staff. There are more staff than ever working in hospitals, but there has also been a substantial outflow of staff from the service since the peak of the NHS’s pandemic response. To fill the resulting vacancies, the NHS has relied on recruitment from outside the UK and the EU. Replacing experienced staff with inexperienced staff is not a like-for-like exchange. It takes time for new staff to embed in the service and requires more experienced colleagues to train them. The result – for now, at least – is a less productive workforce.
*The technical term for each case on the waiting list is an ‘elective pathway’, but we choose to use the term ‘case’ as it is easier to understand.
The government is spending considerably more on hospitals than before the pandemic
The period between 2009/10 and 2019/20 was unusual in the history of the NHS for the relatively small increases in spending that government provided. Spending on health* increased on average by 1.7% per year in real terms between 2009/10 and 2019/20, compared to an average increase of 6% per year between 1997/98 and 2009/10, and an average growth of 4.1% between 1949/50 and 2009/10.
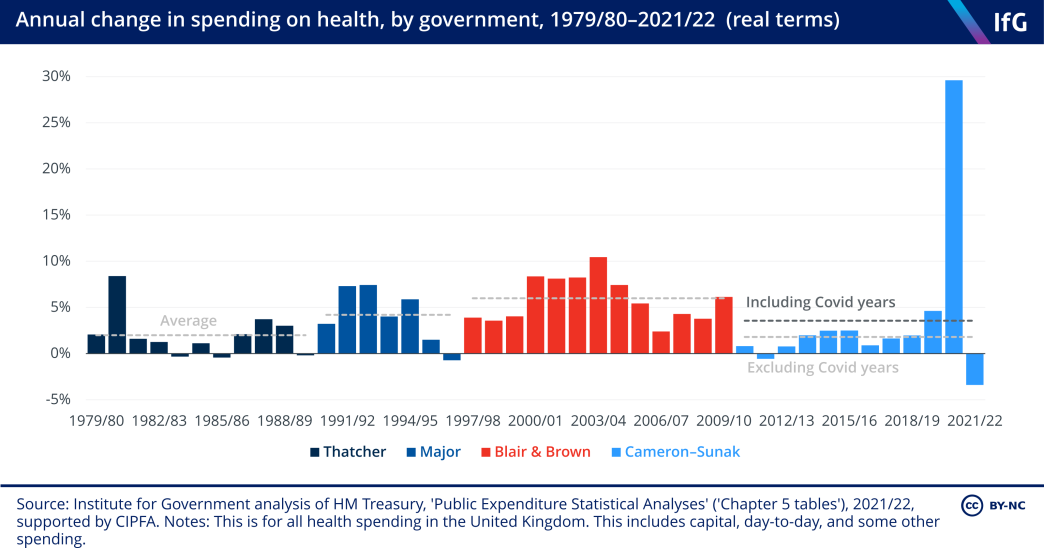
Spending on NHS providers – a subset of the spending described above, which is a closer proxy for the money spent on hospitals – rose substantially during the first year of the pandemic – by 9.8% in real terms between 2019/20 and 2020/21. The real-terms increase of 3.3% between 2020/21 and 2021/22 was smaller than the previous year, but still well above the annual average increase of 2.3% between 2009/10 and 2019/20.
Some of the increase in spending on hospitals since 2019/20 was Covid-related as the government allocated money to help the service deal with the additional pressures associated with it. It is impossible to quantify how much the NHS spent on responding to Covid in hospitals specifically, as estimates such as the National Audit Office’s (NAO) Covid tracker are aggregated across the entire NHS. 313 National Audit Office, ‘COVID-19 cost tracker’, last updated 23 June 2022, retrieved 19 October 2023, https://www.nao.org.uk/overviews/covid-19-cost-tracker As guidance, the British Medical Association (BMA) estimates that the government provided the Department of Health and Social Care (DHSC) with £47bn of ring-fenced Covid funding in 2020/21 and around £40bn in 2021/22 (though this money is intended for the entire health system, not just hospitals). 314 BMA, ‘Health funding data analysis’, last updated 10 August 2023, retrieved 19 October 2023, https://www.bma.org.uk/advice-and-support/nhs-delivery-and-workforce/funding/health-funding-data-analysis This equates to just over a quarter of the money spent on health in 2019/20 – the last year before the pandemic.
Spending would likely have risen more quickly than in the previous decade, even in the absence of the pandemic. The government launched The NHS Long Term Plan in 2019,
315
NHS, ‘Local NHS allocated £570 billion to fund the NHS Long Term Plan’, 19 January 2019, retrieved 19 October 2023, https://www.england.nhs.uk/2019/01/local-health-groups-allocated-570-billion-to-fund-the-nhs-long-term-plan/
which aimed to increase spending by 3.3% per year between 2018/19 and 2023/24 (compared to the 6.3% per year average increase that was seen between 2018/19 and 2022/23).
316
Charlesworth A, Gershlick B, Firth Z and others, Investing in the NHS long term plan, The Health Foundation,
June 2019, https://www.health.org.uk/sites/default/files/upload/publications/2019/S08_Investing%20in%20The%20NHS%20long%20term%20plan_WEB_0.pdf
A substantial portion of this extra spending has gone on staff costs. Spending on staff increased by 11.4% in real terms between 2019/20 and 2021/22, consuming 53.6% of the uplift in spending between those two years. 317 Department of Health and Social Care, DHSC annual report and accounts: 2021 to 2022, 26 January 2023, retrieved 19 October 2023, https://www.gov.uk/government/publications/dhsc-annual-report-and-accounts-2021-to-2022 This is mainly due to the NHS employing more staff, as opposed to rising salaries, as discussed further below.
* The spending measure in Figure 2.1 differs slightly from the measure in Figure 2.2. Figure 2.2 shows spending on NHS providers – the best proxy for hospital spending – in England. The numbers in Figure 2.1 show the increases in the government’s total health spending for the UK, which includes other areas such as general practice. We use this measure for the longer-term time series because there is no comparable data for provider spending that goes back as far as health spending.
The government increased funding for the service in the 2022 autumn statement
In the 2022 autumn statement, the government recognised that the NHS requires more funding to meet cost pressures and improve performance, and increased funding by £3.3bn in each of 2023/24 and 2024/25 318 HM Treasury, Autumn Statement 2022, CP 751, The Stationery Office, November 2022, p. 26,https://assets.publishing.service.gov.uk/government/uploads/system/uploads/attachment_data/file/1118417/CCS1022065440-001_SECURE_HMT_Autumn_Statement… – representing an increase of approximately 2% in cash terms in each year compared to the previous plans. As a result, spending on the NHS is now expected to grow by 2.0% per year on average in real terms between 2022/23 and 2024/25 compared to the planned increases of 1.4% that the government laid out in the 2021 spending review.
This additional money is for the entire NHS but was stated as being intended to improve emergency and elective performance in hospitals. In particular, the government has set specific ambitions for improving category 2* ambulance response times, elective activity rates, and accident and emergency (A&E) waiting times. 319 HM Treasury, Autumn Statement 2022, CP 751, The Stationery Office, November 2022, p. 26,https://assets.publishing.service.gov.uk/government/uploads/system/uploads/attachment_data/file/1118417/CCS1022065440-001_SECURE_HMT_Autumn_Statement…
But much of that increase will be spent paying for higher costs due to higher inflation and higher-than-expected wage increases following industrial action. The government estimates that the 5% pay rise for Agenda for Change staff (all staff apart from doctors and the most senior managers working in hospitals) in 2023/24 will cost £1.3bn more than the 3%–3.5% uplift that was originally budgeted for. 320 Browne F, ‘NHS pay rises will cost £4bn and will be funded from ‘areas of underspending’, govt says’, Sky News, 17 March 2023, retrieved 19 October 2023, https://news.sky.com/story/nhs-pay-rises-will-cost-4bn-and-will-be-funded-from-areas-of-underspending-govt-says-12836167 In addition, the pay rise for doctors announced in July 2023 321 Department of Health and Social Care, ‘NHS staff receive pay rise’, press release, 13 July 2023, retrieved 19 October 2023, https://www.gov.uk/government/news/nhs-staff-receive-pay-rise will cost approximately £325m more than budgeted for, 322 Institute for Government analysis of doctors’ pay deal and staffing data. bringing the total wage bill increase above budget in 2023/24 to £1.6bn – just under half of the uplift announced at the autumn statement. It is unclear, therefore, given the impact of inflation on non-staff spending, if that increase will be enough to expand hospital activity.
This inflationary pressure is partly reflected in the tenuous financial position of a number of ICSs. At the July 2023 meeting of the NHS England board, the chief financial officer reported that 15 of the 42 ICSs had submitted a deficit plan for 2023/24, with a total forecast overspend of £720m. 323 NHS England, ‘Financial performance update’, 27 July 2023, retrieved 19 October 2023, https://www.england.nhs.uk/long-read/financial-performance-update This is approximately 0.5% of the £160bn NHS England budget for 2023/24.
* This is the second most severe category and is for serious conditions such as strokes and chest pains.
The service is spending less responding to Covid
NHS England relaxed some of its Covid infection prevention and control (IPC) measures in April 2022. 324 Iacobucci G, ‘Covid-19: NHS relaxes infection prevention and control measures‘, BMJ, 22 April 2022, retrieved 19 October 2023, https://www.bmj.com/content/377/bmj.o1029 But variation between trusts – in, for example, rates of community transmission and the extent of physical changes to the layout of hospitals – meant that Covid measures stayed in place in some trusts longer than in others throughout 2022/23. 325 Institute for Government interviews.
The story is different in 2023/24. The vast majority of hospitals have almost entirely rolled back their IPC measures. 326 Institute for Government interview. In addition, the number of people in hospital with Covid has dropped during 2023; the average number of people in hospital with Covid per day was 4,457 to the end of September –54.3% lower than in the same period in 2022.
This is positive for hospitals and has arguably happened more quickly than many expected. Fewer Covid-related admissions in hospital means less pressure on beds and improved patient flow through hospitals.
Staff numbers have increased substantially since 2019
In July 2023 there were 20.1% more nurses and 19.9% more doctors working in hospitals and community settings than in March 2019, in full-time-equivalent (FTE) terms.
This increase in staffing is largely in line with the NHS’s goal to increase the workforce in The NHS Long Term Plan, which started from April 2019 and aimed to increase doctor and nurse training places. 329 NHS, The NHS Long Term Plan, January 2019, p. 83, https://www.longtermplan.nhs.uk/wp-content/uploads/2019/08/nhs-long-term-plan-version-1.2.pdf That ambition was supplemented with the specific goal in the Conservative Party’s 2019 manifesto of increasing the number of nurses by 50,000 before March 2025. 330 Mason R, ‘Public spending battle lines drawn as Boris Johnson launches Tory manifesto’, The Guardian, 25 November 2019, https://www.theguardian.com/politics/2019/nov/24/boris-johnson-launches-conservative-manifesto-with-50000-nurses-pledge By July 2023, there were 44,881 more FTE nurses in hospital and community settings than in March 2019, meaning that the government is on track to hit its target by March 2025. The NHS has also recently released its long-term workforce plan, more on which below.
The NHS is relying on international recruitment to grow the workforce
During the pandemic, the source of new nurses and doctors in hospitals changed. More British staff started to leave the service from June 2021 onwards, with their roles then filled by staff from outside the UK and the European Economic Area (EEA). For nurses and health visitors, there were 11,984 net joiners from the rest of the world in the 12 months to June 2023. In the same period, 25,050 British nurses joined the service – a number that is more or less in line with pre-pandemic trends. However, 27,813 British nurses and health visitors left the service, an increase of 11.6% compared to the 12 months to March 2020 (the last pre-pandemic period). This means that there was a net reduction of 2,763 British nurses and health visitors in this time.
Similarly, among doctors, new recruits from the rest of the world have almost entirely driven the increase in the workforce. Of the net 6,523 joiners in the 12 months to June 2023, 5,881 were from the rest of the world, with only a small net increase (273) from the UK.
International recruitment is a legitimate route to filling workforce vacancies and is preferable to not being able to staff wards. But it comes with risks. In relation to doctors, those who trained abroad are more likely to give up their licence to practise in the first six years after registering than their British equivalents (who mostly register when they qualify); between 2015 and 2021, 89% of British doctors remained registered, compared to 66% of their international colleagues. 339 General Medical Council, The state of medical education and practice in the UK: The workforce report 2022, October 2022, p. 58, https://www.gmc-uk.org/-/media/documents/workforce-report-2022---full-report_pdf-94540077.pdf However, the opposite is true of nurses. Work from the Nuffield Trust shows that nurses from the rest of the world stay in NHS hospital and community settings for 12 years on average, compared to nine years for British staff and six years for EEA staff. 340 Palmer B, Leone C and Appleby J, Return on investment of overseas nurse recruitment: lessons for the NHS, Nuffield Trust, October 2021, p. 2, https://www.nuffieldtrust.org.uk/sites/default/files/2021-10/1633336126_recruitment-of-nurses-lessons-briefing-web.pdf
The government also has less control over the future supply of staff when it relies on recruitment from abroad. It cannot mandate that countries train more nurses or doctors and it cannot control the offers that competing countries make to attract a limited international pool of staff. The World Health Organization (WHO) estimates that there will be a global shortfall of 10 million health workers by 2030. 341 World Health Organization, ‘Health workforce: Overview’, (no date), retrieved 19 October 2023, https://www.who.int/health-topics/health-workforce#tab=tab_1 This could potentially reduce the ability of countries that are the source of health workers to provide their own effective health service; the WHO says that the “international migration of health workers may exacerbate health workforce shortfalls, particularly in low- and lower-middle income countries”. 342 World Health Organization, ‘Health workforce: Overview’, (no date), retrieved 19 October 2023, https://www.who.int/health-topics/health-workforce#tab=tab_1 There is also a moral question about recruiting staff from countries in need of their own health and care staff. 343 World Health Organization, ‘WHO health workforce support and safeguards list 2023’, 8 March 2023, retrieved 19 October 2023, https://www.who.int/publications/i/item/9789240069787 Finally, immigration is a politically contentious topic, meaning that there could be political pressure in future to reduce the number of health workers coming from abroad. This is shown by recent calls from some parts of the Conservative Party to cut the number of health and social care workers that the government grants visas to work in the UK, 344 Duggan J, ‘Fact check: Tory MPs’ plans to cut social care worker visas by 100,000 to reduce immigration’, i news, 3 July 2023, retrieved 19 October 2023, https://inews.co.uk/news/fact-check-tory-mps-cut-social-care-worker-visas-reduce-immigration-2450046 and for the government to restrict the number of family members that health workers can bring to the UK on their visas. 345 Riley-Smith B, Martin D and Edginton S, ‘Sunak urged to limit legal migration as winning policy for election campaign’, The Telegraph, 24 September 2023, retrieved 19 October 2023, https://www.telegraph.co.uk/politics/2023/09/24/rishi-sunak-urged-to-limit-legal-migration-election-policy
Vacancy rates have mostly returned to pre-pandemic trends
Vacancy rates – which show the difference between the number of funded posts and those that are filled by permanent or fixed-term staff, but do not show posts that are filled by temporary staff 346 Palmer B, ‘Chart of the week: Staff vacancies and shortfalls in the NHS’, Nuffield Trust, 3 August 2022, retrieved 19 October 2023, https://www.nuffieldtrust.org.uk/resource/chart-of-the-week-staff-vacancies-and-shortfalls-in-the-nhs – fell in hospitals during the early stages of the pandemic, before rising again from the middle of 2021. The total number of vacancies (which includes nursing and medical vacancies, but also vacancies for roles such as health care assistants, porters, management staff, ambulance staff and many others) rose to a high of 9.6% across the health service at the end of both June and September 2022 – the highest level since the NHS started publishing this data in 2017. Since that post-pandemic peak, most vacancy rates have fallen back to largely pre-pandemic levels. For the year ending June 2023, the average vacancy rate across the NHS was 8.9%, which is in line with levels before the pandemic, when they fluctuated between 8% and 9%.
The story is similar in nursing, where vacancies reached 10.8% in the year to June 2023, which is only slightly below the 11.2% in the year to March 2020.
Medical vacancies, however, tell a different story. Although these vacancies are slightly above pandemic-era levels, they are well below the levels seen before the pandemic. In the 12 months to June 2023, the average vacancy rate for doctors was 6.2%, compared to 7.3% in March 2020. This seems to be the continuation of a pre-pandemic trend that saw slowly declining vacancy rates in the medical profession; in the 12 months to March 2018, the vacancy rate for doctors was 8.3%.
Hospitals often cover vacancies with bank and agency staff. The NHS does not publish regular data on the use of these temporary staff, but the NHS Long Term Workforce Plan says that spending on bank and agency staff increased from £3.5bn and £2.4bn in 2018/19 to £5.2bn and £3.0bn in 2021/22 respectively – respective increases of 49% and 25%. 350 NHS England, NHS Long Term Workforce Plan, June 2023, p. 30, https://www.england.nhs.uk/wp-content/uploads/2023/06/nhs-long-term-workforce-plan-v1.2.pdf Aside from the cost, there is some evidence that heavy use of temporary staff can provide poorer quality care, that it is more difficult for them to work in established teams and that they offer poor value for money. 351 Runge J, Hudson-Sharp N and Rolfe H, Use of agency workers in the public sector, National Institute of Economic and Social Research, February 2017, p.13, https://www.niesr.ac.uk/wp-content/uploads/2021/10/NIESR_agency_working_report_final.pdf
Retention worsened directly after the pandemic, but is now improving
The proportion of the workforce resigning voluntarily from their post increased after the first year of the pandemic and reached a peak of 10.8% in the year to September 2022 – the highest level on record – although they may have moved elsewhere in the service. Staff leaving their post has an impact on performance. Previous Institute for Government work shows that high levels of new staff in post likely contribute to lower productivity as it takes time for more senior staff to train them.
352
Freedman S and Wolf R, The NHS productivity puzzle: Why has hospital activity not increased in line with funding and staffing?, Institute for Government, June 2023, p. 29, https://www.instituteforgovernment.org.uk/publication/nhs-productivity
By June 2023, the proportion of the workforce resigning had fallen back to 9.7%, although this is still the joint highest level of any 12-month period before the pandemic.
Staffing instability is also captured by looking at how many people remained in their jobs at the end of a 12-month period, compared to the beginning (Figure 2.9). In the year to September 2022, there was a record low among all NHS staff, among doctors and among nurses and health visitors, with only 87.3%, 88.3% and 88.3% of respective staff groups remaining in the same post for 12 months or more. Although there has been an improvement since then, movement remains higher than before the pandemic.
Staff are less experienced than they were, which may be contributing to poor productivity in the short term
High leaving rates and rising demand for staff over the past few years have driven a surge in recruitment, which means that those currently in post in some staff groups are, on average, less experienced than their predecessors.
Most notably, there was a 31.3% increase in the number of registered nurses who have been on the register for less than five years between March 2021 and March 2023. This compares to a 7.7% increase in the total number of registered nurses over the same period.
This has implications for the effectiveness of staff working in the service. Having more experienced staff members on a ward is associated with better patient outcomes. 355 Zaranko B, Sanford N J, Kelly E and others, ‘Nurse staffing and inpatient mortality in the English National Health Service: a retrospective longitudinal study’, BMJ Quality and Safety, 2022, vol. 32, no. 5, retrieved 19 October 2023, https://qualitysafety.bmj.com/content/32/5/254 And training new staff drains the time of more experienced colleagues, reducing the time they have available to carry out patient-focused work.
Staff absences have fallen from their pandemic peak, but remain high
The proportion of available staff days lost to illness increased during the pandemic and has remained high since then. In 2019/20, 4.46% of days were lost to illness. This rose to 5.36% in both 2021/22 and 2022/23.
During the pandemic, there was an increase in the number of absences due to both mental health reasons and due to respiratory and other infectious diseases. In 2022/23, 1.24% of staff days were lost due to mental health reasons; this was an improvement on 2021/22, when 1.35% of days were lost for this reason, but still 10.0% higher than 2019/20, when it was 1.13%.
While there was a sharp increase in days lost to mental ill health during the pandemic, it followed a number of years of gradually increasing proportion of staff days lost to that reason: in 2015/16, only 0.83% of staff days were lost to mental ill health. Though difficult to directly compare, it seems as though the rates of mental ill health in the NHS have worsened faster than in the general population. In 2015/16, 0.46 days per worker were lost to stress, depression or anxiety in Great Britain. This rose to 0.48 in 2018/19, an increase of 4.3%.*,
356
Health and Safety Executive, ‘Working days lost in Great Britain, LFSILLTYP dataset, Table 3’, https://www.hse.gov.uk/statistics/tables/index.htm
In comparison, the proportion of working days in hospitals lost due to mental health reasons increased by 22.6% in the same time.
* We use this year because the Health and Safety Executive, which publishes the time series, says that data is less comparable from 2019/20 onwards due to Covid.
The rise in absences due to respiratory and other infectious diseases is even more notable. In 2022/23, 1.43% of staff days were lost for this reason, up from 1.35% in 2021/22 and just 0.60% in 2019/20.
The continued prevalence of absences due to respiratory and other infectious diseases throughout 2022 occurred despite substantially fewer staff absent due to Covid in 2022/23 than in 2021/22: the average number of staff absent per day for that reason fell from 24,379 in 2021/22 to 5,600 in 2022/23. 366 NHS England, ‘Urgent and Emergency Care Daily Situation Reports 2022-23’, (no date), retrieved 19 October 2023, https://www.england.nhs.uk/statistics/statistical-work-areas/uec-sitrep/urgent-and-emergency-care-daily-situation-reports-2022-23 The persistence of respiratory and other infectious disease absences is therefore likely to be the result of a particularly bad flu season in the winter of 2022/23. 367 Mahase E, ‘Flu deaths in UK hit five year high last winter’, BMJ, 22 June 2023, retrieved 19 October 2023, https://www.bmj.com/content/381/bmj.p1445 Though there is no data for the number of staff absent with flu, the prevalence in the population seems to have been much higher in 2022/23 than in 2021/22; the government estimates that there were 49,300 admissions due to flu in 2022/23 compared to 8,400 in 2021/22 368 UK Health Security Agency, ‘Surveillance of influenza and other seasonal respiratory viruses in the UK, winter 2022 to 2023’, last updated 3 July 2023, retrieved 19 October 2023, https://www.gov.uk/government/statistics/annual-flu-reports/surveillance-of-influenza-and-other-seasonal-respiratory-viruses-in-the-uk-winter-2022-to… – an increase of 486.9%.
Poor pay and conditions are driving low staff morale
The pandemic has had a large negative impact on working experiences, with many staff suffering burnout from the stressful working conditions and ‘moral injury’ – a feeling of guilt or anger that arises from an individual being forced to do something that violates their moral values. 369 Durham University Department of Theology and Religion, ‘Understanding Moral Injury’, 9 November 2022, https://www.durham.ac.uk/departments/academic/theology-religion/about-us/news/understanding-moral-injury-/ , 370 Durham University Department of Theology and Religion, ‘Understanding Moral Injury’, 9 November 2022, https://www.durham.ac.uk/departments/academic/theology-religion/about-us/news/understanding-moral-injury-/ , 371 University of Surrey, ‘NHS staff may have experienced “betrayal-based moral injury” during Covid-19 pandemic, finds study’, 14 September 2021, retrieved 19 October 2023, https://www.surrey.ac.uk/news/nhs-staff-may-have-experienced-betrayal-based-moral-injury-during-covid-19-pandemic-finds-study In the case of health care workers, this sense of moral injury largely arose from an inability to deliver the level of care they believed patients should receive due to high demand and a lack of resources.
It is not just the pandemic, though, which has contributed to declining morale in the service. There is evidence of a poor working culture within some hospitals. A report by the General Medical Council (GMC) found that 12% of trainee doctors had “been intentionally humiliated in front of others”, with the number reaching 19% for trainees in surgical posts. 372 General Medical Council, National Training Survey 2023 results, July 2023, p. 17, https://www.gmc-uk.org/-/media/documents/national-training-survey-2023-initial-findings-report_pdf-101939815.pdf That data supports the anecdotal evidence reported in The Times of widespread sexism among surgeons. 373 Sylvester R, ‘Sexual assault, crude banter – what it’s like to be a female surgeon’, The Times, 8 April 2023, retrieved 19 October 2023, https://www.thetimes.co.uk/article/sexism-assault-female-surgeons-nhs-times-health-commission-lnqbm2kjp The Messenger review – a government-commissioned review into leadership across health and social care – found that “acceptance of discrimination, bullying, blame cultures and responsibility avoidance has almost become normalised in certain parts of the system”. 374 Department of Health and Social Care, Leadership for a collaborative and inclusive future, 8 June 2022, retrieved 19 October 2023, https://www.gov.uk/government/publications/health-and-social-care-review-leadership-for-a-collaborative-and-inclusive-future/leadership-for-a-collabo…
Among the variables we looked at, satisfaction with pay is the metric that has seen the largest and most sustained decline in staff satisfaction across the NHS. It was down 10.6 percentage points in 2022 compared to 2017, with only a quarter of NHS staff reporting being satisfied with their pay.
This dissatisfaction with pay is likely to be partly explained by the large real-terms decline in hospital staff pay since 2010. The earnings of nurses and health visitors fell by 13.5% in real terms between August 2010 and May 2023, before recovering slightly in June 2023 to 8.1% beneath 2010 levels. This sharp jump in June 2023 is because that is when the NHS paid staff the one-off bonuses that unions and the government agreed in March. 387 Department of Health and Social Care, ‘Over one million NHS staff to receive pay rises from today’, press release, 1 June 2023, retrieved 19 October 2023, https://www.gov.uk/government/news/over-1-million-nhs-staff-to-receive-pay-rises-from-today Between August 2010 and June 2023, consultants’ and junior doctors’ earnings fell by 21.1% and 21.2% in real terms respectively.
Even though consultant pay has fallen the second furthest since 2010, that year did come at the end of a period of sustained wage growth for senior doctors. In cash terms, consultant earnings per FTE grew from £68,350 in 1998/99 to £119,729 in 2008/09, which represents a real-terms increase of more than 45%. 388 House of Commons Health Committee, ‘Written Evidence: Public Expenditure on Health and Personal Social Services 2009, 6. Workforce’, 20 January 2010, retrieved 19 October 2023, https://publications.parliament.uk/pa/cm200910/cmselect/cmhealth/269/269we77.htm Even with those falls in real-terms pay, consultants remain in the top 3% of the income distribution. 389 HM Revenue and Customs, ‘Percentile points from 1 to 99 for total income before and after tax ‘, last updated 8 March 2023, retrieved 19 October 2023, https://www.gov.uk/government/statistics/percentile-points-from-1-to-99-for-total-income-before-and-after-tax However, consultants will likely feel aggrieved that their pay has fallen by more than a fifth in real terms since 2010.
The government has taken steps to redress some of these falls, with the decision to award consultants a 6% pay increase and junior doctors somewhere between an 8.1% and 10.3% pay increase (depending on their level of training) in 2023/24 390 Department of Health and Social Care Media Centre, ‘Government accepts recommendations from NHS pay review bodies ‘, 14 July 2023, retrieved 19 October 2023, https://healthmedia.blog.gov.uk/2023/07/14/government-accepts-recommendations-from-nhs-pay-review-bodies – both of which are above forecast levels of inflation for 2023/24.
Long-running industrial action is hampering pandemic recovery
Dissatisfaction with pay and with wider working conditions are the two primary contributing factors to industrial action that started in summer 2022 and is ongoing at the time of writing. In that time, non-medical hospital staff, junior doctors and, most recently, consultants have all walked out at some point. 391 Garratt K, ‘NHS strike action in England’, House of Commons Library, 17 October 2023, retrieved 19 October 2023, https://commonslibrary.parliament.uk/research-briefings/cbp-9775
As discussed in the ‘Cross-service analysis’ chapter of this report, the government’s strikes strategy has likely extended industrial action, which has badly hampered hospital activity. One interviewee told us that for every three-day junior doctor strike, the NHS loses between 1% and 2% of its total elective activity for the year. 392 Institute for Government interview. Since December 2022, the NHS has rescheduled more 1.1 million appointments due to strike action. 393 NHS England, ‘Industrial action in the NHS’, last updated 6 October 2023, retrieved 19 October 2023, https://www.england.nhs.uk/publication/preparedness-for-potential-industrial-action-in-the-nhs/ But the dataset showing rescheduled appointments does not capture the appointments that are not made after the NHS knows that strikes will go ahead, meaning that there will have been other appointments that would have gone ahead without industrial action.
The burden of strikes extends beyond just the lost activity. It costs the NHS more than usual to backfill the shifts that striking staff leave unfilled, predominantly through having to pay senior staff a premium to work in those times. The NHS estimated that the April junior doctors’ strike had a total financial impact of £360m (on a budget of £167bn) and that it means the NHS can afford 2% less elective activity across the entire year. 394 Kelly J, ‘Financial performance update’, NHS England, 27 July 2023, retrieved 19 October 2023, https://www.england.nhs.uk/long-read/financial-performance-update Finally, there is a large but unquantifiable opportunity cost of the strikes. Responding to strike action occupies management time across trusts, 395 Kelly J, ‘Financial performance update’, NHS England, 27 July 2023, retrieved 19 October 2023, https://www.england.nhs.uk/long-read/financial-performance-update , 396 Institute for Government interviews. reducing the resources that could otherwise be spent on other initiatives to reduce waiting lists or improve hospital performance.
The continuation of the strikes therefore threatens the government’s target for bringing down waiting lists. NHS England has recognised this threat to the target by reducing trusts’ elective activity targets for 2023/24 from 107% of pre-pandemic levels to 105%, 397 Illman J, ‘Exclusive: NHSE cuts elective targets and admits PM’s waiting list pledge under threat’, Health Service Journal, 12 July 2023, retrieved 19 October 2023, https://www.hsj.co.uk/policy-and-regulation/exclusive-nhse-cuts-elective-targets-and-admits-pms-waiting-list-pledge-under-threat/7035171.article and providing £350m of funding to trusts to compensate them for money lost from reduced activity. 398 Illman J, ‘Exclusive: NHSE cuts elective targets and admits PM’s waiting list pledge under threat’, Health Service Journal, 12 July 2023, retrieved 19 October 2023, https://www.hsj.co.uk/policy-and-regulation/exclusive-nhse-cuts-elective-targets-and-admits-pms-waiting-list-pledge-under-threat/7035171.article
The average number of monthly additions to the elective waiting list in 2019/20 was 1,687,243. But in 2021/22 and 2022/23 the NHS had not yet returned to that rate, averaging 1,579,485 and 1,662,878 per month respectively. This is despite the expectation during the pandemic that pent-up demand would result in a large surge in people being added to the elective waiting list.
There are several reasons for this. First, the NHS has increased its use of ‘advice and guidance’ (A&G) – where a GP consults with a secondary care colleague before making a referral, discussed in more detail below. This has resulted in a lower referral rate from GPs to secondary care (see GPs chapter for more details). According to a report from the NAO, the NHS expects that increased use of A&G will result in 1.4 million fewer additions to the waiting list in 2023/24 403 Comptroller and Auditor General, Managing NHS backlogs and waiting times in England, Session 2022–23, HC 799, National Audit Office, 2022, retrieved 19 October 2023, p. 18, https://www.nao.org.uk/wp-content/uploads/2022/11/managing-NHS-backlogs-and-waiting-times-in-England-Report.pdf – roughly 7% of the total new additions in 2019/20. Second, even though GPs are conducting more appointments than ever, it seems as though capacity is still not meeting demand. This means that people who a GP might have referred to the elective waiting list have not been referred still, due to delays in accessing care. Finally, interviewees hypothesised that people may be less likely to come forward for care for minor issues than they were before the pandemic – due, for example, to being deterred by messaging about pressures on the NHS – though this is very hard to quantify. 404 Institute for Government interviews.
In its delivery plan for tackling the elective backlog, published in February 2022, the NHS estimated that it would need to deliver 30% more activity by 2024/25 than before the pandemic to start to reduce the waiting list for elective care. 405 NHS England, Delivery plan for tackling the COVID-19 backlog of elective care, February 2022, p. 5, https://www.england.nhs.uk/coronavirus/wp-content/uploads/sites/52/2022/02/C1466-delivery-plan-for-tackling-the-covid-19-backlog-of-elective-care.pdf In more recent work, the Institute for Fiscal Studies (IFS) estimates that due to the lower- than-expected number of people being added to the waiting list – in particular due to increased use of A&G – the NHS would now need to increase elective activity by 20.9% to achieve the same outcome. 406 Warner M and Zaranko B, One year on from the backlog recovery plan: what next for NHS waiting lists?, Institute for Fiscal Studies, February 2023, p.7, https://ifs.org.uk/sites/default/files/2023-02/IFS-Report-R241-One-year-on-from-the-backlog-recovery-plan-what-next-for-NHS-waiting-lists-final.pdf This would still be an enormous increase in activity, but is substantially less than the NHS’s original estimate.
Elective activity has increased in the past year but is still below pre-pandemic levels
After a substantial drop in 2020/21, the NHS is slowly managing to increase elective activity. Hospitals completed 3.3 million admitted cases and 13.2 million non- admitted cases in 2022/23, an 11.0% and 7.8% increase respectively from 2021/22. Despite the year-on-year increase, 2022/23 activity levels were still below the levels achieved before the pandemic, even though there have been large increases in funding and staffing. Hospitals completed 5.3% and 2.0% fewer admitted and non-admitted cases in 2022/23 than in 2019/20. The first five months of 2023/24 (to the end of August 2023) show that the gradual improvement from the worst days of the pandemic is continuing. The NHS completed 1.2% more non-admitted cases between April and August 2023 compared to the same months in 2019. There were 6.7% fewer admitted cases, but this is also roughly in line with the trend of declining numbers of admitted cases that predated the pandemic, due to a shift towards non-admitted procedures where possible. While this improvement is welcome, it still leaves activity beneath where we expect it to be if the pre-pandemic trend of increasing activity had continued.
Interviewees told us that a succession of crises hampered efforts to increase activity following the disruption of Covid. First, there was the cost-of-living and inflation crisis, which meant tight budgets constrained activity. Second, interviewees said that the churn of secretaries of state throughout the summer and autumn of 2022 created inconsistent policy making and hampered preparations for the winter. This is evident in the late announcement of additional financial support for delayed discharge in January 2023. Third, the winter also saw one of the worst flu seasons in recent history, 409 Julian S, ‘How have hospital admissions for Covid-19 and flu changed in recent years? ‘, Nuffield Trust, 9 May 2023, retrieved 19 October 2023, https://www.nuffieldtrust.org.uk/resource/how-have-hospital-admissions-for-covid-19-and-flu-changed-in-recent-years which further constrained capacity. Finally, as discussed above, the wave of industrial action across the service is reducing the amount of elective activity that can take place.
The elective waiting list is still increasing
Relatively low activity means that the elective waiting list is still growing, even with lower-than-expected demand. Despite a slight flattening out between November 2022 and February 2023, there were consistent increases in the waiting list between March and August 2023, meaning that the waiting list stood at 7.75 million incomplete cases at the end of August 2023 – the highest level on record and 69.3% higher than the 4.57 million in February 2020. Even before the onset of the pandemic, the waiting list had grown steadily since 2010, rising from 2.53 million in April 2010 to 4.57 million in February 2020 – an increase of 80.4%.
The waiting list counts the number of incomplete cases, meaning that someone could be on the list more than once, for multiple reasons. At the end of May 2023, NHS England estimated that of the 7.5 million cases then on the elective waiting list, the number of unique individuals was 6.3 million.
410
NHS England, ‘Statistical Press Notice: NHS referral to treatment (RTT) waiting times data May 2023’, 13 July 2023, https://www.england.nhs.uk/statistics/wp-content/uploads/sites/2/2023/07/May23-RTT-SPN-publication-version-PDF-432K-25787.pdf
There is no more recent data than May as NHS England has stopped publishing that piece of information.
People are also more likely to stay on the waiting list for longer than before the pandemic. The proportion of people treated within 18 weeks of a referral has steadily declined since 2019/20. In 2022/23, only 60.1% of pathways were completed in less than 18 weeks, down from 84.2% in 2019/20 and well below the target of 92%. Once again, poor performance predates the pandemic. The last time the NHS hit this target was February 2016.
The NHS missed the first two of its elective recovery targets, and is not making enough progress on reducing waiting times
According to the NHS backlog recovery plan, the NHS aims to deal with everyone who has been waiting a long time for treatment by the end of the following months:
412
NHS England, Delivery plan for tackling the COVID-19 backlog of elective care, February 2022, p. 4, https://www.england.nhs.uk/coronavirus/wp-content/uploads/sites/52/2022/02/C1466-delivery-plan-for-tackling-the-covid-19-backlog-of-elective-care.pdf
• people waiting 104 weeks or more by July 2022
• people waiting 78 weeks or more by April 2023
• people waiting 65 weeks or more by March 2024
• people waiting 52 weeks or more by March 2025.
The NHS missed the first two of these targets. By the end of August 2023, there were still 8,998 people who had been waiting at least 78 weeks for elective treatment, down from 10,737 in March 2023, but an increase on July. The NHS came closer to hitting the target for 104-week waits, eliminating all but 2,890 by the end of July 2022.
NHS England claimed that the target for 78-week waits was missed due to junior doctor strikes. 417 Illman J, ‘NHSE blames junior doctors’ strike for impending elective target failure’, Health Service Journal, 29 March 2023, retrieved 19 October 2023, https://www.hsj.co.uk/performance-healthcheck/nhse-blames-junior-doctors-strike-for-impending-elective-target-failure/7034531.article While strikes are certainly reducing elective activity, work from the Health Service Journal shows that junior doctor strikes only accounted for approximately 2,000 of the 10,737 people waiting at least 78 weeks at the end of March 2023, 418 Illman J, ‘Exclusive: NHS to miss April deadline to end 78-week waits by around 11k patient’, Health Service Journal, 23 March 2023, retrieved 19 October 2023, https://www.hsj.co.uk/quality-and-performance/exclusive-nhs-to-miss-april-deadline-to-end-78-week-waits-by-around-11k-patients/7034497.article meaning the NHS would have missed the target even if junior doctors had not been striking. That said, some leeway should be given to hospitals on these targets – some people choose not to accept care at a time when the NHS offers it to them, meaning they remain on the list longer than they might have, and the complexity of some other cases means hospitals cannot quickly clear them off the list. 419 Morris L, ‘Major milestone: NHS all but clear backlog of longest two-year waiters ‘, National Health Executive, 9 August 2022, retrieved 19 October 2023, https://www.nationalhealthexecutive.com/articles/major-milestone-nhs-all-clear-backlog-longest-two-year-waiters
However, between March and August 2023, the number of people waiting 65 weeks or more grew by 15,079 (or 16.0%) and the number waiting at least 52 weeks grew by 37,565 (or 10.5%).
Political turmoil in 2022 contributed to arguably the worst winter in NHS history
The NHS experienced arguably the worst winter in its history during 2022/23.
420
Hoddinott S, The NHS crisis: Does the Sunak government have a plan?, Institute for Government, January 2023, https://www.instituteforgovernment.org.uk/publication/nhs-crisis
December 2022 saw historic lows in ambulance response times, and historically long A&E waiting times and ambulance handover delays.
The mean ambulance response time for conditions such as strokes and chest pain (referred to as category 2) in December 2022 was more than 1 hour and 30 minutes, compared to a target of 18 minutes. The mean ambulance response time for the most serious call-outs (referred to as category 1), including life-threatening conditions, also reached a record high of 10 minutes 58 seconds, compared to a target of 7 minutes.
In major A&E departments*, 422 NHS England, A&E Attendances and Emergency Admissions Monthly Return Definitions, July 2019, p. 4, https://www.england.nhs.uk/statistics/wp-content/uploads/sites/2/2019/07/AE-Attendances-Emergency-Definitions-v4.0-final-July-2019.pdf the lowest proportion of attendees on record were seen within the targeted four hours, at 49.6% in December 2022. There was only one month in 2022/23 (May 2022) when performance was above 60%. Even then, only 60.1% of people who attended major A&E departments were seen within four hours, compared to a target of 95%.
In 2023, the NHS began releasing information on how many people waited for more than 12 hours in A&E. Along with data revealed by a Royal College of Emergency Medicine Freedom of Information request, this shows that 211,720 people (or roughly 15%) waited more than 12 hours in A&Es in December 2022.
425
Royal College of Emergency Medicine, ’NHS Performance Tracker’, (no date), retrieved 19 October 2023, https://rcem.ac.uk/data-statistics
That compares to a target that only 2%.
426
Royal College of Emergency Medicine, ’NHS Performance Tracker’, (no date), retrieved 19 October 2023, https://rcem.ac.uk/data-statistics
The government responded to this crisis by providing £750m to both the NHS and local authorities to increase capacity in social care, the number of ambulances and the number of beds in hospitals. 432 Hoddinott S, The NHS crisis: Does the Sunak government have a plan?, Institute for Government, January 2023, https://www.instituteforgovernment.org.uk/publication/nhs-crisis The goal was to improve flow through hospitals so the NHS could treat people more quickly.
The efficacy of these interventions is questionable, but it was not helped by the late disbursement of funds, which was itself the result of the government’s rushed planning and preparation before winter 2022/23.
433
Hoddinott S and Davies N, Adult social care: Short-term support and long-term stability, Institute for Government, 10 March 2023, retrieved 19 October 2023, https://www.instituteforgovernment.org.uk/publication/adult-social-care
Political turmoil exacerbated the poor preparation – this saw four different health secretaries in post between July and October 2022 (though Steve Barclay filled the post twice, once in July and then again in October).
434
Department of Health and Social Care, ‘Secretary of State for Health and Social Care’, (no date), retrieved 19 October 2023, https://www.gov.uk/government/ministers/secretary-of-state-for-health-and-social-care
Interviewees reported that this lack of political direction and uncertainty made planning very difficult, as successive secretaries of state rapidly shifted priorities. Liz Truss’s health secretary, Thérèse Coffey, launched Our Plan for Patients in September 2022,
435
Department of Health and Social Care, ‘Our plan for patients’, 22 September 2022, retrieved 19 October 2023,
https://www.gov.uk/government/publications/our-plan-for-patients/our-plan-for-patients
only to see that document superseded when Rishi Sunak and Barclay outlined their own priorities for the service in the middle of November, weeks before the start of the winter crisis.
436
Department of Health and Social Care, ‘Health and Social Care Secretary sets out key priorities ahead of winter’, 16 November 2022, retrieved 19 October 2023, https://www.gov.uk/government/news/health-and-social-care-secretary-sets-out-key-priorities-ahead-of-winter
* These are type-1 A&E departments and are what people typically think of when discussing A&Es and which the NHS defines as A&Es with “a consultant led 24-hour service with full resuscitation facilities and designated accommodation for the reception of accident and emergency patients”.
Poor patient flow is driving poor performance, not high demand
In targeting the improvement of patient flow through hospitals, the government has identified lengthening waiting times for urgent and emergency care as the cause of poor patient flow. Attendances at major A&Es have increased slowly since the sharp decline at the start of the pandemic and in 2022/23 were 2.5% higher than in 2019/20 – an annual rate of growth of only 0.8%. In contrast, A&E attendances grew at a rate of 1.4% per year between 2011/12 and 2019/20. There were 8.1 million ambulance incidents in 2022/23, 7.6% lower than the 8.8 million in 2019/20.
Rather than high demand, the delays that manifest at the front door of hospitals in the form of long A&E waits and ambulance handover delays are mostly caused by poor flow through the hospital and delays discharging people once they are fit, more on which below.*
Patient flow issues led to queues of ambulances outside hospitals as crews struggled to hand over patients to hospital staff. This led to 37.2% of ambulance arrivals at hospital being delayed for 30 minutes or more in December 2022, up from 20.1% in December 2021 and 13.3% in December 2020.
* Interviewees told us that people are also presenting to A&E departments with more complex cases, but this is very hard to prove with publicly available evidence.
The NHS has been successful in getting people to come forward for cancer treatment
There was a decline in the number of people referred for cancer treatment during the pandemic, raising concerns that many cancers would go untreated. In response, the NHS ran a successful campaign to encourage people to come forward for care. 438 NHS England, ‘NHS chief urges people to come forward for life saving cancer checks ahead of new campaign’, 14 August 2021, retrieved 19 October 2023, https://www.england.nhs.uk/2021/08/nhs-chief-urges-people-to-come-forward-for-life-saving-cancer-checks-ahead-of-new-campaign
This resulted in a large increase in the number of cancer appointments following an urgent referral from a GP in 2021/22 and 2022/23. The NHS conducted 2.9 million urgent cancer appointments in 2022/23 compared to 2.4 million in 2019/20 – an increase of 21.1%. Though this is a large increase in activity, it is still roughly in line with the trend rise in the number of appointments over the decade before 2019/20. While impressive, this does imply that some people who might have come forward for care during the pandemic have still not done so.
Waits for treatment are still increasing
While more people are coming forward for cancer care, performance against the target that 85% of cancer treatment should start within two months of an urgent cancer referral has deteriorated since the start of the pandemic. That decline against the target could be because more people are now coming forward for care, therefore putting more pressure on the system. But the NHS has also increased capacity for cancer care, with approximately 17% more oncology (cancer care) consultants in July 2023 than in July 2019.
The year 2022/23 was the worst on record for performance against the 85% target, with only 61.1% of treatments starting within two months of an urgent referral. This compared to 77.2% in 2019/20.
Hospitals are providing more tests than before the pandemic, though are still below trend
Other than cancer appointments, the one major area of hospital activity that delivered more activity in 2022/23 than in 2019/20 was diagnostics. Hospitals carried out 24.4 million diagnostic tests in 2022/23, 5% more than in 2019/20. However, our modelling shows that, if pre-pandemic growth in the number of tests had continued, hospitals would have carried out 2.8 million – or 11.5% – more tests in 2022/23 than they actually did.
Having more staff has partly driven the increase in the number of diagnostic tests being carried out – including having 16.8% more diagnostic radiographers in July 2023 than in July 2019. But it is also because the government has taken steps to increase diagnostic capacity, with measures such as community diagnostic centres (CDCs), explored more below.
Cross-cutting contributors to poor hospital performance
Despite more spending on the service and a large increase in the number of nurses and doctors, overall hospital activity has not returned to the level that hospitals achieved directly before the pandemic in a range of key areas.
Given higher spending and staffing levels, this implies that hospitals are now less productive than they were before the pandemic. Previous work from the Institute for Government shows that the reasons for this decline include:
• underinvestment in capital
• a lack of management capacity
• poor retention of experienced staff
• high vacancies at critical points of patient flow
• poorly aligned incentives across the service. 440 Freedman S and Wolf R, The NHS productivity puzzle: Why has hospital activity not increased in line with funding and staffing?, Institute for Government, June 2023, https://www.instituteforgovernment.org.uk/publication/nhs-productivity
Falling bed numbers have contributed to high bed occupancy
The number of beds in hospitals has declined for several decades, though it increased slightly during the pandemic. In 1987/88, there were 182,865 available general and acute (G&A) beds in hospitals.* This fell to 132,841 by 2009/10 and to 114,097 by 2019/20, an overall decline of 37.6%. The number of G&A beds in hospitals increased slightly during the pandemic, and at the end of the first quarter of 2023/24 there were 116,116.
Some of the decline in bed numbers is for good reasons: the government wanted to push care out of hospitals and into the community; patients are staying in hospital for a shorter length of time than they used to; and technical progress means that some procedures that previously required a patient to be in hospital can now be done as a day case. 442 Ewbank L, Thompson J, McKenna H and others, ‘NHS hospital bed numbers: past, present, future’, The King’s Fund, 5 November 2021, retrieved 19 October 2023, https://www.kingsfund.org.uk/publications/nhs-hospital-bed-numbers
But there is evidence that bed reductions in hospitals went too far before the pandemic, given there was not the increase in community capacity needed to achieve the government’s goal of moving care out of hospitals. The NAO recommends that bed occupancy should not exceed 85%, otherwise hospitals may experience “regular bed shortages, periodic bed crises and increased numbers of hospital-acquired infections”. 448 Comptroller and Auditor General, Emergency admissions to hospital: managing the demand, Session 2013–14, HC 739, National Audit Office, 2013, p. 22, https://www.nao.org.uk/wp-content/uploads/2013/10/10288-001-Emergency-admissions.pdf Bed occupancy began to creep up in the early 2010s and, by the middle of the decade, one in six trusts reported occupancy levels above 95%. 449 Appleby J, Baird B, Thompson J and Jabbal J, The NHS under the coalition government, Part two: NHS performance, The King’s Fund, March 2015, p. 16, https://www.kingsfund.org.uk/sites/default/files/field/field_publication_file/the-nhs-under-the-coalition-government-nhs-performance-kings-fund-mar15… There was a dip in occupancy at the start of the pandemic, as the NHS urgently discharged patients, but that trend quickly reversed and G&A occupancy has been above 85% since October 2020. Adult G&A occupancy was above 95% between September 2022 and March 2023. While there was a slight dip during the summer months, it returned to 94.6% in September 2023. The NHS has a target for 2023/24 to reduce adult G&A bed occupancy to 92%. 450 NHS England, 2023/24 priorities and operational planning guidance, 27 January 2023, p. 7, https://www.england.nhs.uk/wp-content/uploads/2022/12/PRN00021-23-24-priorities-and-operational-planning-guidance-v1.1.pdf
As part of its Delivery Plan for Recovering Urgent and Emergency Care Services, published in January 2023, the government aimed to have “5,000 more staffed, sustainable beds in 2023/24” compared to the “originally planned levels of beds in 2022/23”. 451 NHS England, Delivery plan for recovering urgent and emergency care services, January 2023, p. 12, https://www.england.nhs.uk/wp-content/uploads/2023/01/B2034-delivery-plan-for-recovering-urgent-and-emergency-care-services.pdf It is difficult to fully evaluate this pledge as there is no information about what the “originally planned levels” were in 2022/23. But regardless, there were 2,714 fewer G&A beds in the largest acute trusts in September 2023 than January 2023, 452 NHS England, ‘Critical care and General & Acute Beds – Urgent and Emergency Care Daily Situation Reports’, (no date), retrieved 19 October 2023, https://www.england.nhs.uk/statistics/statistical-work-areas/bed-availability-and-occupancy/critical-care-and-general-acute-beds-urgent-and-emergency… when the delivery plan was launched.
* We discuss G&A beds rather than total beds because they are a better proxy for hospital capacity than the specialised beds included in the non-G&A bed category.
Delayed discharge is slowing patient flow
One of the key reasons for slow patient flow is the difficulty that hospitals have in discharging patients in a timely manner.
Between 1 December 2022 and 28 February 2023, an average of 13,571 people were in hospital beds at the end of the day who were eligible for discharge. That is approximately 14% of G&A beds in hospitals.
The causes of delayed discharge are complex and, following the government’s decision to stop publishing reasons for delayed discharge between February 2020 and May 2023, difficult to attribute to specific causes. The decision to start publishing some data again from June 2023 is very welcome. 458 NHS England, ‘Discharge delays (Community)’, (no date), retrieved 19 October 2023, https://www.england.nhs.uk/statistics/statistical-work-areas/discharge-delays-community-data The press and the government have mostly laid the blame for delayed discharge on a lack of capacity in adult social care. However, work from the Nuffield Trust shows that social care accounts for less than half of delayed discharge, with the remaining proportion accounted for by reasons within the NHS, 459 Schlepper L, Dodsworth E and Scobie S, ‘Understanding delays in hospital discharge’, Nuffield Trust, 10 March 2023, retrieved 19 October 2023, https://www.nuffieldtrust.org.uk/news-item/understanding-delays-in-hospital-discharge such as the lack of a discharge summary, no transport to convey someone home or a delay in issuing prescriptions. 460 Cavallaro F, Grimm F, Allen L and others, ‘Why are delayed discharges from hospital increasing? Seeing the bigger picture’, The Health Foundation, 3 March 2023, retrieved 19 October 2023, https://www.health.org.uk/publications/long-reads/why-are-delayed-discharges-from-hospital-increasing-seeing-the-bigger
As discussed above, the government provided additional funding to address delayed discharges, but this was not as impactful as it might have been.
Poor flow makes it difficult to increase activity
High bed occupancy and the resultant reduction in patient flow have affected hospital activity. Despite more or less similar level of attendances (0.1% more) at the largest A&Es in the 12 months to September compared to the 12 months to February 2020, there were 6.8% fewer admissions. There are a few potential reasons for this change. The Health Foundation hypothesises that high bed occupancy – among other reasons – meant that “hospitals were forced to change admission thresholds – ie not admitting some patients for shorter admissions who would have been admitted in 2019”.
461
Cavallaro F, Ewbank L, Marszalek K and others, ‘Longer hospital stays and fewer admissions ‘, The Health Foundation, 23 June 2023, retrieved 19 October 2023, https://www.health.org.uk/publications/long-reads/longer-hospital-stays-and-fewer-admissions
Increased admission thresholds during periods of high bed occupancy is a phenomenon that has been observed before. One study found that “a patient attending [an emergency department] during a period of very high… occupancy was 3.3% less likely… to be admitted” when compared with periods of average occupancy.
462
Wyatt S, Joshi R, Mortimore JM and Mohammed MA, ‘Relationship between emergency department and inpatient occupancy and the likelihood of an emergency admission: a retrospective hospital database study’, BMJ Emergency Medicine Journal, 2021, vol. 39, no. 3, pp. 174–180, https://emj.bmj.com/content/39/3/174.full
It could also be the case that hospitals are treating patients with less severe conditions in different ways now than they were before the pandemic. For example, the NHS has extended the use of ‘virtual wards’ 467 NHS England, 2022/23 priorities and operations planning guidance, 22 February 2023, p. 22, https://www.england.nhs.uk/wp-content/uploads/2022/02/20211223-B1160-2022-23-priorities-and-operational-planning-guidance-v3.2.pdf – which allows patients to receive treatment at home, and is discussed in more detail below. The NHS is also increasing the use of what is known as ‘same day emergency care’ (SDEC) centres, 468 NHS England, Delivery plan for recovering urgent and emergency care services, January 2023, p.17, https://www.england.nhs.uk/wp-content/uploads/2023/01/B2034-delivery-plan-for-recovering-urgent-and-emergency-care-services.pdf which are designed to allow patients to access care that may have previously required a short admission. 469 NHS England, ‘Same day emergency care’, (no date), retrieved 19 October 2019, https://www.england.nhs.uk/urgent-emergency-care/same-day-emergency-care In both these cases, the interventions are relatively new and have been rolled out across the country in an inconsistent manner. It is therefore difficult to fully attribute such a large national reduction in admissions to these changes.
It is still unclear what effect the reduction in admissions has on the quality of care that people receive when they attend A&Es. There could also be implications for the wider health and care system; people who are not treated at an A&E department when they once might have been may seek care somewhere else, adding to pressure on those services.
The ratio of managers to staff is lower than before the pandemic
One of the most maligned staff groups in the health service is managers. They are commonly attacked in the press and by MPs,
470
Discombe M, ‘MP says NHS ‘shambles’ is fault of ‘utterly useless senior managers’, Health Service Journal, 9 January 2023, retrieved 19 October 2023, https://www.hsj.co.uk/leadership/mp-says-nhs-shambles-is-fault-of-utterly-useless-senior-managers/7034011.article
normally framed as taking resources away from the ‘front line’. But the reality is that the NHS has a severe lack of managers. The number of managers in July 2023 was only 2.9% higher than in September 2009, following deep cuts in the first half of the last decade. In the same time period, the number of nurses and doctors grew by more than 30% and 40% respectively. As a result of the rising number of other staff, the number of FTE NHS staff for every manager and senior manager grew from 26.7 to 33.4 over this period – an increase of 25.3%. It should be noted that the number of official managers in the NHS does not include other staff – such as doctors and nurses – who often also take on a management role.
The NHS is undermanaged compared to the rest of the economy. Only 3.0% of the NHS workforce were managers or senior managers in July 2023, down from 3.7% in September 2009. In comparison, across the entire economy, approximately 11% of staff are employed in management roles.
483
Office for National Statistics, ‘Datasets, EMP04: Employment by occupation’, 11 September 2018, retrieved 19 October 2023, https://www.ons.gov.uk/employmentandlabourmarket/peopleinwork/employmentandemployeetypes/datasets/employmentbyoccupationemp04
While clinicians and nurses are certainly carrying out some management tasks, there is a severe lack of administrative capacity that dedicated managers would be able to meet.
484
Kirkpatrick I and Malby B, ‘Is the NHS overmanaged? ‘, NHS Confederation, 24 January 2022, retrieved 19
October 2023, https://www.nhsconfed.org/long-reads/nhs-overmanaged
This lack of management hampers the productivity of front-line staff; there are fewer people to co-ordinate where and how staff should be working to be most effective, to book and manage elective appointments
485
Institute for Government interview.
or to identify bottlenecks in patient flow. Managers also do administrative work that, if they do not do it, often falls to front-line staff. At higher levels of seniority, managers can co-ordinate resources across many constituent organisations – for example, trusts or ICSs – to improve efficiency.
486
Kirkpatrick I and Malby B, ‘What do NHS managers contribute?’, NHS Confederation, 11 February 2022,
retrieved 19 October 2023, https://www.nhsconfed.org/long-reads/what-do-nhs-managers-contribute
But on one visit to a trust, we saw that a lack of more junior management capacity meant that senior managers in the trust were often carrying out operational planning, rather than the more strategic work that they are arguably best placed to deliver. Increasing the numbers of managers (up to a point) helps to improve patient outcomes and patient satisfaction.
487
Kirkpatrick I and Malby B, ‘What do NHS managers contribute?’, NHS Confederation, 11 February 2022,
retrieved 19 October 2023, https://www.nhsconfed.org/long-reads/what-do-nhs-managers-contribute
Even when there is management capacity, the NHS often does not provide managers with enough autonomy to carry out their work effectively. Institute for Government work from earlier in the year shows that this has been happening in a number of ways. First, there has been increasing centralisation of NHS decision making over the past decade and a half. 488 Freedman S and Wolf R, The NHS productivity puzzle: Why has hospital activity not increased in line with funding and staffing?, Institute for Government, June 2023, p. 47, https://www.instituteforgovernment.org.uk/publication/nhs-productivity For example, the Blair government introduced foundation trusts as a way of giving top-performing NHS trusts more autonomy over spending and decision making. 489 Nuffield Trust, ‘A Short Guide to NHS Foundation Trusts’, (no date), retrieved 19 October 2023, https://www.nuffieldtrust.org.uk/sites/default/files/2019-11/foundation.pdf But the power of foundation trusts has been gradually eroded, 490 Collins B, ‘The foundation trust model: death by a thousand cuts ‘, The King’s Fund, 15 February 2016, retrieved 19 October 2023, https://www.kingsfund.org.uk/blog/2016/02/foundation-trust-model and the Health and Care Act 2022 allowed the DHSC to impose capital spending limits on foundation trusts. 491 Brown S, ‘Guidance sets out how FT capital resource limits will work’, Healthcare Financial Management Association, 18 January 2023, retrieved 19 October 2023, https://www.hfma.org.uk/news/news-list/Article/guidance-on-ft-capital-resource-limits Centralisation has advantages and disadvantages, but there is evidence that it prevents managers from making effective decisions about how to, for example, spend their capital budgets. 492 Freedman S and Wolf R, The NHS productivity puzzle: Why has hospital activity not increased in line with funding and staffing?, Institute for Government, June 2023, p. 48, https://www.instituteforgovernment.org.uk/publication/nhs-productivity
Second, there has been a proliferation of targets from the centre of government with which trusts have to comply. 493 Freedman S and Wolf R, The NHS productivity puzzle: Why has hospital activity not increased in line with funding and staffing?, Institute for Government, June 2023, p. 50, https://www.instituteforgovernment.org.uk/publication/nhs-productivity The need to do so means that managers are drawn away from work that could help improve productivity, and instead they focus on meeting targets that sometimes have little to do with improving outcomes.
Underinvestment in capital
The UK has consistently spent less on health-related capital* – investment in buildings, maintenance of the estate, equipment in hospitals and IT systems, among other things – than many other countries in the Organisation for Economic Co- operation and Development (OECD). Since 1970, the UK only exceeded the weighted OECD average in two years: 2007 and 2009. 494 OECD Statistics, ‘Gross fixed capital formation in the health care system’, (no date), retrieved 19 October 2023, https://stats.oecd.org/Index.aspx?DataSetCode=SHA_HK# Between 1970 and 2010, the UK spent 84.3% of the OECD average on health capital. This fell to 62.5% in the years between 2011 and 2020.
Even within the context of longer-term underinvestment, the 2010s was a period of very low capital spending in the health service. The average amount spent on capital in health care was 0.41% of GDP between 2000 and 2009. This fell to 0.30% between 2010 and 2019 – a reduction of more than 26%.
Historic underinvestment in capital is hindering hospital productivity
The effect of underinvestment in the health service is difficult to fully quantify, though there are some indicators that point to the drag that it is having on staff’s ability to do their jobs.
The hospital estate maintenance backlog – the amount of money needed to return the NHS estate to full working order – rose to the highest level on record in 2021/22: £10.2bn. The proportion of the backlog that is classified as ‘high risk’ – where repairs must be carried out urgently to prevent “catastrophic failure, major disruption to clinical services or deficiencies in safety liable to cause serious injury and/or prosecution”
497
NHS Digital, ’Estates Return Information Collection, Summary page and dataset for ERIC 2021/22, Data Definitions’, https://digital.nhs.uk/data-and-information/publications/statistical/estates-returns-information-collection/england-2021-22
– is also the highest on record at 17.6%. This backlog limits the ability of staff to carry out their work effectively. It can mean, for example, that parts of hospitals are closed due to sewage leaks.
498
BBC News, ‘NHS battles sewage leaks as repair backlog grows’, 17 February 2023, retrieved 19 October 2023,
https://www.bbc.co.uk/news/health-64653482
It is not just the estate that the NHS has underinvested in, but also IT systems and equipment. The NHS has many fewer CT (computerised tomography) scanners and MRI (magnetic resonance imaging) machines in hospitals than comparable countries in the OECD, at only 10.02 and 8.57 per one million people respectively. In comparison, Spain has 19.23 and 15.86 and Germany has 19.54 and 13.14 respectively. This lack of equipment acts as a bottleneck for diagnostic tests in hospitals, which prevents increased elective and other activity.
The government’s major capital project for hospitals is the New Hospital Programme (NHP), which follows from a Conservative manifesto commitment to build 40 new hospitals by 2030. 509 NHS Confederation, Conservative Party manifesto: Health and social care analysis, 25 November 2019, retrieved 19 October 2023, https://www.nhsconfed.org/system/files/media/BRIEFING-Conservative-manifesto_0.pdf In 2020, the DHSC announced 32 hospitals that it would build under this scheme (with a further eight to be announced) and the 2020 spending round allocated £3.7bn worth of funding for the programme in the four years between 2021/22 and 2024/25. 510 Comptroller and Auditor General, Progress with the New Hospital Programme, Session 2022–23, HC 1662, National Audit Office, 2023, p. 7, https://www.nao.org.uk/wp-content/uploads/2023/07/New-hospital- programme-report.pdf This represents approximately 8% of the DHSC’s capital budget for that period. 511 HM Treasury, Autumn Statement 2022, CP 751, The Stationery Office, November 2022, p. 21, https://assets.publishing.service.gov.uk/government/uploads/system/uploads/attachment_data/file/1118417/CCS1022065440-001_SECURE_HMT_Autumn_Statement… In May 2023, the government announced that it was going to delay the building of eight hospitals that it originally intended to build as part of the NHP and instead rebuild five hospitals that are currently built mostly of reinforced autoclaved aerated concrete (RAAC) 512 Department of Health and Social Care, ‘Five major hospitals to be rebuilt as part of over £20 billion new hospital infrastructure investment’, 25 May 2023, retrieved 19 October 2023, https://www.gov.uk/government/news/five-major-hospitals-to-be-rebuilt-as-part-of-over-20-billion-new-hospital-infrastructure-investment – a material that caused the unexpected and sudden collapse of a school in Kent in 2018. 513 Reuben A and Cuffe R, ‘RAAC: How long have we known about unsafe concrete in schools?’, BBC News, 6 September 2023, retrieved 19 October 2023, https://www.bbc.co.uk/news/education-66709154
But the NAO has raised doubts about the veracity of the government’s claim that the NHP will build 40 new hospitals. In its report from July 2023, it said that “by the definition used in 2020, [the] NHP will no longer construct 40 new hospitals by 2030”.
514
Comptroller and Auditor General, Progress with the New Hospital Programme, Session 2022–23, HC 1662, National Audit Office, 2023, p. 14, https://www.nao.org.uk/wp-content/uploads/2023/07/New-hospital-programme-report.pdf
It also says that of the 32 hospitals announced in October 2020, only 11 (34%) “represented whole new hospitals”.
515
Comptroller and Auditor General, Progress with the New Hospital Programme, Session 2022–23, HC 1662, National Audit Office, 2023, p. 10, https://www.nao.org.uk/wp-content/uploads/2023/07/New-hospital-programme-report.pdf
The rest are rebuilds of existing hospitals, new buildings at existing sites or major refurbishments of existing hospital buildings.
516
Comptroller and Auditor General, Progress with the New Hospital Programme, Session 2022–23, HC 1662, National Audit Office, 2023, p. 24, https://www.nao.org.uk/wp-content/uploads/2023/07/New-hospital-programme-report.pdf
Some of the government’s interventions are helping to improve hospital performance
Community diagnostic centres (CDCs)
One of the government’s primary interventions to work through the elective backlog was the introduction of community diagnostic centres (CDCs). These were intended both to increase diagnostic capacity and to put diagnostic capability closer to those who require it. 517 NHS Health Education England, ‘Community Diagnostic Centres (CDC)’, (no date), retrieved 19 October 2023, https://www.hee.nhs.uk/our-work/cancer-diagnostics/community-diagnostic-centres-cdc As of 14 August 2023, there were 108 CDCs across England, with plans to reach a total of 160 by March 2025. 518 NHS England, ‘NHS delivers another record year of lifesaving cancer checks for patients‘, 14 August 2023, retrieved 19 October 2023, https://www.england.nhs.uk/2023/08/nhs-delivers-another-record-year-of-lifesaving-cancer-checks-for-patients
The launch of CDCs does seem to have helped the number of diagnostic tests that the NHS carries out return to 2019/20 levels (as discussed above), but this is difficult to assess due to the lack of data. Despite CDCs being operational since July 2021, the NHS only started publishing activity data in March 2023. This data shows that 4.7% of diagnostic tests carried out in England took place in CDCs in March, April and May 2023.
However, it is unclear whether all this activity is truly additional. According to research by The King’s Fund, 47 of the 92 CDCs that were open at the time of the research had been built on existing hospital sites, 530 Wickens C, Jefferies D and Sircar S, ‘Are community diagnostic centres really moving care closer to home?’, The King’s Fund, 13 October 2022, retrieved 19 October 2023, https://www.kingsfund.org.uk/blog/2022/10/are-community-diagnostic-centres-really-moving-care-closer-home raising questions of whether they are truly moving diagnostic capacity into the community, as the government intended. 531 Department of Health and Social Care, ‘40 community diagnostic centres launching across England’, press release, 1 October 2021, retrieved 19 October 2023, https://www.gov.uk/government/news/40-community- diagnostic-centres-launching-across-england There is also the question of staffing. Hospitals often find it difficult to staff their existing diagnostic departments, let alone provide staff for CDCs. 532 Wickens C, Why do diagnostics matter? Maximising the potential of diagnostics services, The King’s Fund, October 2022, p. 26, https://www.kingsfund.org.uk/sites/default/files/2022-10/Why%20do%20diagnostics%20matter%20online%20version_0.pdf If it is staff that is the limiting factor on expanding diagnostic capacity, then opening CDCs will do little to help, other than displace activity from one area to another. But despite these issues, interviewees told us that, on balance, they felt that a good proportion of CDC activity is additional, although they were unable to quantify how much.
This data also does not capture all CDC activity. CDCs also carry out tests – for example, a number of blood tests – that are not tracked as part of the NHS’s diagnostic dataset that we use to inform our analysis.
Surgical hubs
Surgical hubs are areas of a hospital – either in addition to the current estate or by reallocating part of the existing estate – that are dedicated to carrying out elective procedures. 533 Department of Health and Social Care, ‘Over 50 new surgical hubs set to open across England to help bust the COVID-19 backlogs’, press release, 26 August 2022, retrieved 19 October 2023, https://www.gov.uk/government/news/over-50-new-surgical-hubs-set-to-open-across-england-to-help-bust-the-covid-backlogs These hubs are intended to work through high-volume, low-complexity procedures 534 Department of Health and Social Care, ‘Over 50 new surgical hubs set to open across England to help bust the COVID-19 backlogs’, press release, 26 August 2022, retrieved 19 October 2023, https://www.gov.uk/government/news/over-50-new-surgical-hubs-set-to-open-across-england-to-help-bust-the-covid-backlogs such as cataract removal. The government has to date opened “around 93 hub sites”, 535 Getting It Right First Time, ‘More surgical hubs awarded accreditation for meeting top clinical and operational standards’, NHS England, 24 July 2023, retrieved 19 October 2023, https://gettingitrightfirsttime.co.uk/more-surgical-hubs-awarded-accreditation-for-meeting-top-clinical-and-operational-standards and estimated in August 2022 that these hubs would carry out 200,000 procedures in 2022/23 536 Department of Health and Social Care, ‘Over 50 new surgical hubs set to open across England to help bust the COVID-19 backlogs’, press release, 26 August 2022, retrieved 19 October 2023, https://www.gov.uk/government/news/over-50-new-surgical-hubs-set-to-open-across-england-to-help-bust-the-covid-backlogs – an amount that would represent 1.2% of completed elective procedures in that year.
As with CDCs, it is difficult to fully evaluate the effectiveness of elective hubs, especially as the NHS does not publish data about their activity. Interviewees told us that there is a real benefit to trusts creating elective hubs on existing sites. 537 Institute for Government interview. This is because it attracts additional investment and allows for better separation of emergency and elective activity – a step that ensures that elective activity continues even when there is a spike in demand for emergency care. However, the lack of certain staff groups in elective hubs – particularly anaesthetists and theatre nurses – which is the result of shortages across the NHS, limits their ability to provide additional activity. 538 Royal College of Surgeons of England, ‘The case for surgical hubs’, (no date), retrieved 19 October 2023, p. 2, https://www.rcseng.ac.uk/about-the-rcs/government-relations-and-consultation/position-statements-and-reports/the-case-for-surgical-hubs
Advice and guidance (A&G)
Increased used of advice and guidance (A&G) – where a GP consults with a secondary care colleague before making a referral – seems to be keeping people out of hospitals who do not need to be there (for more information on A&G, please see the GPs chapter). The NHS claims that A&G is diverting approximately 130,000 unnecessary referrals a month. However, there is little information about the outcomes for those diverted away from elective care, who would previously have attended hospital. It is certainly better for patients who do not need to go to hospital to avoid a visit, but it is still unclear if there are any people who are diverted due to A&G but who would have benefited from joining the elective waiting list.
Use of the independent sector
The NHS elective recovery plan and the subsequent elective recovery taskforce
539
Department of Health and Social Care, ‘Elective recovery taskforce: implementation plan’, 4 August 2023, retrieved 19 October 2023, https://www.gov.uk/government/publications/elective-recovery-taskforce-implementation-plan/elective-recovery-taskforce-implementation-plan
both included plans to make greater use of independent sector providers (ISPs) to increase elective activity – a policy that the NHS has been pursuing since at least the early 2000s.
540
Blythe N and Ross S, Strategies to reduce waiting times for elective care, The King’s Fund, December 2022, p. 13, https://www.kingsfund.org.uk/sites/default/files/2022-12/Strategies%20to%20reduce%20waiting%20times%202022.pdf
This has proved to be moderately effective. Compared to 2019/20, ISPs carried out 23.8% more elective procedures in 2022/23. In comparison, NHS providers conducted 2.2% fewer procedures.
While the increase of ISP activity has been large, it is from a relatively small base and the vast majority of elective activity is still carried out in NHS providers. ISPs are best suited to providing very specific types of activity, namely high-volume, low- complexity work. In 2022/23, ISPs carried out 23.8% of trauma and orthopaedic procedures and 21.5% of ophthalmology – mostly cataract removal
543
Coughlan E, Keith J, Gardner T and others, ‘Waiting for NHS hospital care: the role of the independent sector in delivering orthopaedic and ophthalmic care’, The Health Foundation, 30 April 2023, retrieved
19 October 2023, https://www.health.org.uk/publications/long-reads/waiting-for-nhs-hospital-care-the-role-of-the-independent-sector-in
– procedures, both of which fit the description of specialties with high volume, but low complexity.
544
Coughlan E, Keith J, Gardner T and others, ‘Waiting for NHS hospital care: the role of the independent sector in delivering orthopaedic and ophthalmic care’, The Health Foundation, 30 April 2023, retrieved
19 October 2023, https://www.health.org.uk/publications/long-reads/waiting-for-nhs-hospital-care-the-role-of-the-independent-sector-in
But there is a limit to the extent to which ISPs can support elective activity. The vast majority of more complex elective work will continue to be conducted within the NHS for the foreseeable future.
571
Coughlan E, Keith J, Gardner T and others, ‘Waiting for NHS hospital care: the role of the independent sector in delivering orthopaedic and ophthalmic care’, The Health Foundation, 30 April 2023, retrieved
19 October 2023, https://www.health.org.uk/publications/long-reads/waiting-for-nhs-hospital-care-the-role-of-the-independent-sector-in
For example, only 0.3% and 0.7% respectively of thoracic and neurology procedures were carried out in ISPs in 2022/23, due to their relative complexity. ISPs also compete with the NHS for staff, meaning that it is difficult to expand capacity without reducing the NHS’s ability to deliver elective activity.
572
Coughlan E, Keith J, Gardner T and others, ‘Waiting for NHS hospital care: the role of the independent sector in delivering orthopaedic and ophthalmic care’, The Health Foundation, 30 April 2023, retrieved
19 October 2023, https://www.health.org.uk/publications/long-reads/waiting-for-nhs-hospital-care-the-role-of-the-independent-sector-in
Work by The Health Foundation also shows that those living in more affluent parts of England use ISP-delivered elective care more than those in the most deprived parts of the country.
573
Coughlan E, Keith J, Gardner T and others, ‘Waiting for NHS hospital care: the role of the independent sector in delivering orthopaedic and ophthalmic care’, The Health Foundation, 30 April 2023, retrieved
19 October 2023, https://www.health.org.uk/publications/long-reads/waiting-for-nhs-hospital-care-the-role-of-the-independent-sector-in
If the expansion of ISP capacity follows existing distributions, then those in more affluent areas will benefit the most. Finally, in a report examining the efficacy of different approaches to reducing the elective waiting list, The King’s Fund concluded that there is “little empirical evidence that the additional capacity provided/activity undertaken by the private sector in England from 2003 to 2008 contributed to the rate at which waiting times were reduced”.
574
Blythe N and Ross S, Strategies to reduce waiting times for elective care, The King’s Fund, December 2022, p. 13, https://www.kingsfund.org.uk/sites/default/files/2022-12/Strategies%20to%20reduce%20waiting%20times%202022.pdf
Virtual wards require longer to reach their full potential
During the pandemic, to reduce in-person contact, the NHS greatly expanded the use of so-called ‘virtual wards’, where a hospital provides a patient with monitoring equipment so that they can stay in their own home rather than occupying a hospital bed; remaining at home is often preferable to a hospital stay. Hospitals have used this as a way of expanding capacity without investing in physical beds. The NHS has an ambition to create “40-50 virtual beds per 100,000 population”,
575
NHS England, 2022/23 priorities and operations planning guidance, 22 February 2023, p. 22, https://www.england.nhs.uk/wp-content/uploads/2022/02/20211223-B1160-2022-23-priorities-and-operational-planning-guidance-v3.2.pdf
meaning a total of approximately 22,400–28,000 virtual ward beds in England. Data from NHS England shows that the government hit its target
576
NHS England, ‘Monthly operational statistics – August 2023’, last updated 14 August, retrieved 19 October 2023, https://www.england.nhs.uk/long-read/monthly-operational-statistics-august-2023
to have 10,000 virtual ward beds operational by September 2023, with 10,421 opened.
577
NHS England, ‘Virtual wards – September 2023’, (no date), retrieved 19 October 2023, https://www.england.nhs.uk/statistics/statistical-work-areas/virtual-ward
Of those 10,421 virtual ward beds, only 65.3% were occupied in September.
578
NHS England, ‘Virtual wards – September 2023’, (no date), retrieved 19 October 2023, https://www.england.nhs.uk/statistics/statistical-work-areas/virtual-ward
Given bed occupancy levels in the rest of the health service are close to 95%, this raises questions as to why there is so little uptake of the available virtual ward capacity.
Work by The Health Foundation shows that 63% of NHS staff are ‘very’ or ‘quite’ supportive of the use of virtual wards. 579 Thornton N, Horton T and Hardie T, ‘How do the public and NHS staff feel about virtual wards?’, The Health Foundation, 29 July 2023, retrieved 19 October 2023, https://www.health.org.uk/news-and-comment/charts-and-infographics/how-do-the-public-and-nhs-staff-feel-about-virtual-wards And a report from the NHS Confederation claims that: “When done well the model is seen as a successful way to keep people out of hospital, discharge early to home, reduce clinical time and give patients autonomy and choice in their own surroundings.” 580 Hakim R, ‘Realising the potential of virtual wards’, NHS Confederation, 23 May 2023, retrieved 19 October 2023, https://www.nhsconfed.org/publications/realising-potential-virtual-wards
But there are still barriers to effective implementation. The NHS needs to upskill staff to maximise the effectiveness of virtual wards, as well as employ enough health care workers to properly staff them. The report from the NHS Confederation mentioned above also calls for flexibility in how the model is applied locally, with less prescription from the centre of government. Respondents also highlighted the importance of senior clinician buy-in for virtual wards, something that is currently frequently lacking due to concerns about the risks of managing patients remotely.
581
Hakim R, ‘Realising the potential of virtual wards’, NHS Confederation, 23 May 2023, retrieved 19 October 2023, https://www.nhsconfed.org/publications/realising-potential-virtual-wards
Some of that concern from older doctors may be due to an aversion to new methods. But some of it may be warranted. There is still little evidence about the efficacy of virtual wards or the effect on patient outcomes – work that the NHS should prioritise if it plans to continue the expanded use of virtual wards.
Government’s cuts to integrated care systems’ budgets will prevent them working effectively
One of the Johnson government’s flagship pieces of NHS reform was the creation of integrated care systems (ICSs), which were intended to improve the co-ordination and co-operation of a fragmented health and social care system. ICSs bring together representatives from acute trusts, primary care, local authorities (which are responsible for commissioning adult social care) and some social care providers. 582 Charles A, ‘Integrated care systems explained: making sense of systems, places and neighbourhoods’, The King’s Fund, 19 August 2022, retrieved 19 October 2023, https://www.kingsfund.org.uk/publications/integrated-care-systems-explained The government put ICSs on a statutory footing in July 2022, leading to the creation of 42 of them across England. 583 NHS Digital, ‘ICS implementation’, last updated 21 November 2022, retrieved 19 October 2023, https://digital.nhs.uk/services/ics-implementation
ICSs faced a difficult first year, dealing with arguably the most severe winter crisis in the health service’s history. Despite that, ICSs were beginning to embed themselves into their local health and care ecosystems and were creating initiatives to deliver more integrated care. One interviewee told us that they created teams for major conditions that worked across a range of primary care, secondary care, community care and social care. 584 Institute for Government interview. But it is difficult to give a full picture of all ICSs’ activity from a small number of interviews due to wide variation in the initiatives ICSs are implementing and the progress they have made.
In March 2022, the government told ICSs that they would need to cut 30% of their management spending in 2023/24. 585 Local Government Chronicle, ‘Integrated care boards told to cut running costs by 30%’, 3 March 2023, retrieved 19 October 2023, https://www.lgcplus.com/services/health-and-care/integrated-care-boards-told-to-cut-running-costs-by-30-03-03-2023 These cuts will require a reduction in the staffing of integrated care boards 586 Local Government Chronicle, ‘Integrated care boards told to cut running costs by 30%’, 3 March 2023, retrieved 19 October 2023, https://www.lgcplus.com/services/health-and-care/integrated-care-boards-told-to-cut-running-costs-by-30-03-03-2023 and interviews revealed that it has hurt the morale of at least some ICS staff and contributed to people leaving their roles. One interviewee told us that the funding cuts and the changes that accompanied them had taken up all the attention of leadership within their ICS, meaning that the transformation programmes they had started were either delayed or scrapped entirely. 587 Institute for Government interview.
The workforce plan is welcome but does not address key issues
The government committed to releasing a long-term workforce plan at the 2022 autumn statement. That plan was released at the end of June 2023. 588 NHS England, NHS Long Term Workforce Plan, last updated 18 August 2023, retrieved 19 October 2023, https://www.england.nhs.uk/long-read/accessible-nhs-long-term-workforce-plan The plan sets out an ambition to increase training places for doctors and nurses and outlines new routes to becoming a doctor. There is also an ambition to recruit more staff from within the UK.
It is certainly welcome that the government has supported the NHS to deliver a workforce plan, but laying out an ambition for the size of the workforce is not the same as delivering the plan and there remain risks to successful implementation.
First, the expansion of training places represents an enormous and ambitious shift in higher education. The Health Foundation estimates that if the government sticks to the plan, then clinical health professionals will account for one in six of all university enrolments by 2031/32, compared to one in nine now. 589 Shembavnekar N, Kelly E and Charlesworth A, ‘How feasible are the NHS Long Term Workforce Plan commitments on training? ‘, The Health Foundation, 13 August 2023, retrieved 19 October 2023, https://www.health.org.uk/publications/long-reads/how-feasible-are-the-nhs-long-term-workforce-plan-commitments-on-training The Health Foundation points out that supporting those students with sufficient good-quality clinical placements is crucial for effective training, but that there is currently a lack of capacity. It notes that implementing the plan “will require sustained discussion and action on the part of government, NHS England, NHS providers and universities”. 590 Shembavnekar N, Kelly E and Charlesworth A, ‘How feasible are the NHS Long Term Workforce Plan commitments on training? ‘, The Health Foundation, 13 August 2023, retrieved 19 October 2023, https://www.health.org.uk/publications/long-reads/how-feasible-are-the-nhs-long-term-workforce-plan-commitments-on-training
Second, the plan assumes that staff productivity will increase by 1.5% to 2% per year. 591 NHS England, NHS Long Term Workforce Plan, last updated 18 August 2023, retrieved 19 October 2023, https://www.england.nhs.uk/long-read/accessible-nhs-long-term-workforce-plan This is optimistic given that real-terms output per hour in the health sector* – a proxy for NHS labour productivity – was completely flat between 1997 and 2019. 592 Office for National Statistics, ‘Output per hour worked, UK’, last updated 7 July 2023, retrieved 19 October 2023, table 25, https://www.ons.gov.uk/economy/economicoutputandproductivity/productivitymeasures/datasets/outputperhourworkeduk The plan acknowledges that “boost[ing] labour productivity will require sustained investment in the NHS infrastructure, a significant increase in funding for technology and innovation”. 593 NHS England, NHS Long Term Workforce Plan, last updated 18 August 2023, retrieved 19 October 2023, https://www.england.nhs.uk/long-read/accessible-nhs-long-term-workforce-plan But as this chapter has shown, the government has historically underinvested in capital, raising doubts about the likelihood of a step change in capital investment to meet this requirement.
Third, the plan focuses predominantly on front-line staff, without any mention of administrative, management and support staff. The plan itself acknowledges that, in addition to more capital investment, achieving the plan’s productivity ambition of 1.5% to 2% would require “reducing the administrative burden on clinicians”. 594 NHS England, NHS Long Term Workforce Plan, last updated 18 August 2023, retrieved 19 October 2023, https://www.england.nhs.uk/long-read/accessible-nhs-long-term-workforce-plan That is certainly a view with which the Institute for Government agrees, but the NHS has repeatedly shifted resources away from management and administrative capacity, as this chapter has pointed out.
Fourth, the rapid expansion of the workforce implies an increase in the wage bill, and therefore spending on the health service. The IFS estimates that implementing the workforce plan would require the government to increase funding for the NHS by 3.6% per year in real terms for the duration of the plan. 595 Warner M and Zaranko B, Implications of the NHS workforce plan, Institute for Fiscal Studies, August 2023, p. 2, https://ifs.org.uk/sites/default/files/2023-08/R272-Implications-of-the-workforce-plan-IFS%20%282%29.pdf The IFS points out that this would bring annual rises in line with historic average increases, but would be well above the 2.4% average since 2009/10. 596 Warner M and Zaranko B, Implications of the NHS workforce plan, Institute for Fiscal Studies, August 2023, p. 4, https://ifs.org.uk/sites/default/files/2023-08/R272-Implications-of-the-workforce-plan-IFS%20%282%29.pdf The government currently has plans for 1% real-terms increases in day-to-day spending across all departments between 2024/25 and 2027/28. The government could certainly choose to increase spending on the health service by 3.6% per year in that time, but as we argue elsewhere in the ‘Cross-service analysis’ chapter of this report, it would require difficult choices about spending elsewhere.
Overall, the plan is a good starting point and lays out a strong aspiration for how the government would like to staff the NHS, but faces a number of risks to its successful implementation.
- Topic
- Public services
- Department
- Department of Health and Social Care
- Tracker
- Performance Tracker
- Publisher
- Institute for Government