Working to make government more effective

Performance Tracker 2023

Performance Tracker 2023: Adult social care

The government has provided more funding, but the sector may struggle to address unmet need in the face of rising costs and competing priorities.

A man being helped by a care worker.

The government has acknowledged that the availability of publicly funded adult social care* has not been sufficient to meet people’s needs for care and support. It provided a large injection of funding in the autumn statement in 2022 and subsequently. But the adult social care sector faces extensive challenges, including an ongoing workforce crisis, rising costs of providing services and pressure on local authority finances – meaning that even the new level of funding is unlikely to be enough to substantially increase service provision to address the rising levels of unmet and under-met need that have emerged since 2009/10. 

Boris Johnson promised to fix adult social care “once and for all” and announced reforms to both the charging model for adult social care and to the wider sector. But the government has abandoned the implementation of charging reforms in this parliament and substantially pared back funding for other reforms. The former decision may have been understandable in the short term, as implementing large-scale charging reforms while adult social care is in crisis would have required far more money than the government was willing to spend. But delay means that it is now more than 11 years since the government-commissioned Dilnot review first recommended a reform to how care is funded, without any meaningful progress having been made. 

The result is that many people are still exposed to “catastrophic care costs” and others are denied publicly funded care by a means test that the government has not meaningfully uprated since 2010/11. 

The market of private providers who deliver most adult social care remains unstable: despite recent funding increases, average fees simply do not meet operating costs and are below the level that would allow firms to pay social care workers enough to improve recruitment and retention. The government’s proposal that local authorities would “move towards” paying a “fair cost of care” were met with tentative hope in the provider market, only for many to be left disappointed by the government’s decision to delay that reform until October 2025. 

As with the NHS, the government is now relying on overseas workers from outside the EU to boost workforce numbers. This has been crucial in filling workforce gaps but is unlikely to be sustainable and can raise ethical concerns, such as exploitation of workers who rely on continued employment to remain in the country. Relying on international staff also does nothing to resolve the fact that social care workers are paid less than workers in comparable sectors – which makes it close to impossible to recruit and retain enough staff and results in high turnover. 

This range of problems makes it easy to forget that at its core adult social care should be about empowering people to live “gloriously ordinary lives”. The government’s failure on a range of these issues lets down those who rely on adult social care and is particularly concerning in the context of expected increases in demand. 

This chapter looks at the performance of adult social care services that are funded by the state and does not assess the services available to those who pay for their own care. 

*Adult social care services provide support to individuals who need it to live independently as well as to their families and carers. Care can be delivered at home (known as domiciliary or home care), in residential or nursing homes, in supported living, in day-care centres, or through using a personal assistant. Care is largely supplied by private or not-for-profit providers and unpaid carers, though local authorities and the NHS also provide some care directly. For those who are eligible for publicly funded care, local authorities are responsible for commissioning and paying for at least some of their care. 

A box with text of key facts from the IfG's Performance Tracker chapter on adult social care.

Spending remains well above pre-pandemic levels

In response to the Covid-19 pandemic, the government substantially increased the amount it spent on adult social care, with a 7% real-terms increase between 2019/20 and 2020/21. Since then, spending has levelled off, with only a 0.4% real-terms increase in 2021/22* and a 1.6% real-terms increase in 2022/23. 

We forecast** that spending will rise substantially in 2023/24, by 9.5% in real terms, following increased investment at the 2022 autumn statement. That increase, however, comes in a year of soaring cost pressures for the sector, raising questions about the sufficiency of the funding to meet the government’s goals, more on which below. 

Measures from the 2022 autumn statement will increase funding for the service 

The government announced an increase in spending on adult social care in the 2022 autumn statement over the last two years of this spending review period, 2023/24 and 2024/25. This funding increase came in the form of genuinely new grant funding, funding reallocated from delayed charging reforms, and a greater ability for local authorities to raise council tax. 206 Davies N, Pope T, Nye P, Hoddinott S, Fright M and Richards G, What does the autumn statement mean for public services?, Institute for Government, 24 November 2022, www.instituteforgovernment.org.uk/publication/autumn-statement-2022-public-services The split of those increases in funding is shown in Table 3.1. 

*The GDP deflator that is used throughout Performance Tracker means that the increase between 2020/21 and 2021/22 looks smaller in real terms than in other publications, but larger in 2020/21 compared to 2019/20. For more details, see Methodology. 

**For more details on how we forecast spending in 2023/24, please see Methodology. 

In total, this amounts to £7.6bn of funding across the two years, 216 HM Treasury, ‘The Autumn Statement 2022 speech’, 17 November 2022, retrieved 17 October 2023, www.gov.uk/government/speeches/the-autumn-statement-2022-speech , 217 Department of Health and Social Care, ‘Government sets out next steps to support social care’, press release, 4 April 2023, www.gov.uk/government/news/government-sets-out-next-steps-to-support-social-care  but this is slightly misleading, as more than £3bn had already been announced for the implementation of charging reforms. Some £3.2bn of this money is also being disbursed across the two years as part of the Social Care Grant – a funding pot that can be spent on either adults’ or children’s social care. 218 Local Government Association, Exploring adult social care funding and delayed discharge, research report, 20 March 2023, retrieved 17 October 2023, www.local.gov.uk/publications/exploring-adult-social-care-funding-and-delayed-discharge Councils typically spend about 40% of this funding on children’s social care, 219 Association of Directors of Adult Social Services, ADASS Spring Survey 2023, 20 June 2023, p. 13, www.adass.org.uk/media/9751/adass-spring-survey-2023-final-web-version.pdf  meaning that local authorities are likely to spend only £1.9bn of the £3.2bn on adult social care. Another £800m of the £7.6bn comes from the Discharge Grant, which is split 50/50 with the NHS, meaning that local authorities will receive only £400m. 

The decision about levels of council tax increases is within the power of local authorities and if they choose to tax less, they must also expect to be able to spend less. But it is misleading of the government to announce funding that is not within its power to deliver. The ability to raise council tax is also not equal between all local authorities. Authorities with a large council tax base will disproportionately benefit from the ability to raise council tax by a given percentage, and those councils tend to be in less deprived areas where there is less demand for publicly funded adult social care. This means that the ability to raise council tax benefits the local authorities who need it least. 220 Davies N, Pope T, Nye P, Hoddinott S, Fright M and Richards G, What does the autumn statement mean for public services?, Institute for Government, 24 November 2022, p.8, www.instituteforgovernment.org.uk/publication/autumn-statement-2022-public-services

We estimate* that spending on adult social care by local authorities and the NHS will be approximately £2.8bn more in 2023/24 than in 2022/23 in cash terms, an amount that would represent an approximate 10% real-terms spending increase from 2022/23. In comparison, real terms spending rose by 2.6% on average per year between 2014/15 and 2021/22. While this is beneficial, it is still unlikely to be sufficient to address all the problems in adult social care (discussed further below) and comes at the expense of long-awaited charging reforms. 

*For more details, see Methodology.

The government continues to rely on a model of ‘crisis-cash-repeat’ for the service

The winter crisis of 2022/23 saw the government fall back on a model of funding adult social care that it has relied on since at least 2015. In that time, the government has repeatedly topped up adult social care funding in response to short-term crises. This includes the announcement of the Improved Better Care Fund in 2015/16; the introduction of the adult social care support grant in 2016/17, which took money from some councils’ New Homes Bonus income to fund adult social care; 221 Comptroller and Auditor General, Financial sustainability of local authorities 2018, Session 2017–2019, HC 834, National Audit Office, 2018, p. 18, www.nao.org.uk/wp-content/uploads/2018/03/Financial-sustainabilty-of-local-authorites-2018.pdf and the provision of an extra £400m of resource for adult social care in December 2016. 222 Andrews E, Lilly A, Campbell L, McCrae J, Douglas R and Bijl J, Performance Tracker: Autumn 2017, Institute for Government, 16 October 2017, p. 83, www.instituteforgovernment.org.uk/publication/report/performance-tracker-autumn-2017

This behaviour was turbocharged during the pandemic, as the government poured money into adult social care to compensate for how ill-prepared adult social care was for a respiratory pandemic. 223 Davies N, Atkins G, Guerin B and Sodhi S, How fit were public services for coronavirus?, Institute for Government, August 2020, www.instituteforgovernment.org.uk/publication/report/how-fit-were-public-services-coronavirus , 224 Davies N, Atkins G, Guerin B and Sodhi S, How fit were public services for coronavirus?, Institute for Government, August 2020, www.instituteforgovernment.org.uk/publication/report/how-fit-were-public-services-coronavirus Then, in 2022/23, in response to a crisis in NHS urgent and emergency care, the government injected £700m of extra funding into the NHS and local authorities to increase adult social care capacity and improve delayed discharges out of hospitals. 

This approach of ‘crisis-cash-repeat’ is ineffective and represents poor value for money. Emergency funding in the winter of 2022/23 offers a good example of its shortcomings. First, government funding was announced and then disbursed late. The Adult Social Care Discharge Fund, worth £500m, was announced in September 2022, already well into the period when the NHS, local authorities and social care providers would have been planning their winter capacity. The £250m of emergency winter pressures funding was not announced until 9 January 2023 – far into the worst of the crisis. 247 Department of Health and Social Care, ‘Oral statement to parliament: New discharge funding and NHS winter pressures’, GOV.UK, 9 January 2023, www.gov.uk/government/speeches/oral-statement-on-new-discharge-funding-and-nhs-winter-pressures Even after announcing the Adult Social Care Discharge Fund in September, it took the government until December to disburse the first tranche – 40% of the total – to councils and the NHS, with the remaining 60% leaving central government coffers in January 2023. 248 Humphries R, ‘Hospital discharge funding: why the frosty reception to new money?’, blog, The Health Foundation, 13 January 2023, retrieved 17 October 2023, www.health.org.uk/news-and-comment/blogs/hospital-discharge-funding-why-the-frosty-reception-to-new-money

Second, the funding came with burdensome reporting requirements. The government required local authorities to detail how they planned to spend all their funding four weeks after it announced allocations. Thereafter, local authorities were expected to provide fortnightly activity reports, with a final report due in May 2023. 249 Department of Health and Social Care, ‘Adult social care discharge fund. Annex B: grant conditions’, 16 March 2023, retrieved 17 October 2023, www.gov.uk/government/publications/adult-social-care-discharge-fund/annex-b-grant-conditions For already under-resourced councils, this represented extra work with little obvious benefit to them. 

Third, it is unclear whether the money has even been effective in its stated goal. The funding allocated in 2022/23 was intended to reduce the number of people in hospital who did not need to be there. But evidence that it was effective is mixed. On one hand, in the last week of February 2023, there were on average 13,720 people in hospital per day who were eligible for discharge, compared to 13,545 in the last week of November 2022 – an increase of 1.3%. On the other in the same period in 2021/22, delayed discharges increased by approximately 13%, and in the absence of funding, the level would likely have been higher in 2022/23. However, there is also evidence that while delayed discharge was largely flat in acute hospitals throughout the winter of 2022/23 (as shown in Figure 3.2), that may have been achieved at least in part by shifting people to other parts of the health and care system. Research by Nuffield Trust shows that there was an increase in the number of people delayed in community beds throughout the winter of 2022/23. There were approximately 5,300 people delayed in that setting at the start of November 2022, rising to just over 6,000 in March 2023 – an increase of roughly 13%. 250 Dodsworth E, ‘Growing numbers of delayed discharges from community hospitals’, blog, Nuffield Trust, 10 August 2023, retrieved 17 October 2023, www.nuffieldtrust.org.uk/resource/growing-numbers-of-delayed-discharges-from-community-hospitals As Nuffield Trust says in its analysis: “It is vital that bottlenecks [in acute hospitals] are addressed rather than shifted elsewhere to the detriment of patients stuck in community beds.” 251 Dodsworth E, ‘Growing numbers of delayed discharges from community hospitals’, blog, Nuffield Trust, 10 August 2023, retrieved 17 October 2023, www.nuffieldtrust.org.uk/resource/growing-numbers-of-delayed-discharges-from-community-hospitals

It is fair to say that delayed discharges would likely have been higher in the winter of 2022/23 without the emergency funding, but that the same amount of money could have been spent more effectively to achieve better outcomes than it eventually did. 

As an example of how longer-term, more consistent funding might have had better outcomes, we should look at how local authorities and providers actually spent emergency funding. Adult social care capacity is driven predominantly by the number of staff that providers can employ. But short-term funding made it difficult for providers to quickly and sustainably expand the workforce knowing that funding for salaries would run out at the end of winter. 252 Hoddinott S and Davies N, 'Adult social care: Short-term support and long-term stability', Institute for Government, March 2023, www.instituteforgovernment.org.uk/publication/adult-social-care Even when providers were willing to take on more staff, there was a lag between creating a vacancy and employing and training an individual to do the job, meaning that the last-minute funding took a long time to filter through to increased capacity. Interviewees also reported that instead of waiting to fill vacancies, local authorities and providers spent most of the money on measures such as providing staff with one-off bonuses to discourage them from leaving, 253 Institute for Government interview.  bringing forward the scheduled national living wage increase, or using expensive agency staff who do not represent good value for money. 254 Institute for Government interview.  This may have helped in the short term but will not provide the type of increased stability that longer-term investment in measures such as improved training or career progression might have. 

Other examples of ‘crisis-cash-repeat’ also demonstrate poor value for money. The Department of Health and Social Care (DHSC) ran an evaluation of the Workforce Recruitment and Retention Fund, which allocated £462.5m of funding for growing the social care workforce during the pandemic. It found that “the number of staff recruited between the funded period and baseline period is not statistically significant”. 255 Department of Health and Social Care, ‘Workforce Recruitment and Retention Funds: outcomes and findings’, 26 January 2023, retrieved 17 October 2023, www.gov.uk/government/publications/workforce-recruitment-and-retention-funds-outcomes-and-findings/workforce-recruitment-and-retention-funds-outcomes…; Despite little impact on recruitment, there was improved retention, leading to an increase of 2.9 million staff hours compared to baseline. But that expanded capacity was expensive, costing the government £160 per additional hour, 256 Department of Health and Social Care, ‘Workforce Recruitment and Retention Funds: outcomes and findings’, 26 January 2023, retrieved 17 October 2023, www.gov.uk/government/publications/workforce-recruitment-and-retention-funds-outcomes-and-findings/workforce-recruitment-and-retention-funds-outcomes… far above the £10.11 that was the median hourly rate paid to care workers in the independent sector in March 2023. 257 Skills for Care, The state of the adult social care workforce in England, October 2023, retrieved 17 October 2023, p. 117, www.skillsforcare.org.uk/Adult-Social-Care-Workforce-Data/Workforce-intelligence/documents/State-of-the-adult-social-care-sector/The-State-of-the-Adu… The evaluation explicitly pointed to the short-term and last-minute nature of the funding as a reason for its ineffectiveness. 

Without extra funding, reforming the charging model for adult social care in 2023 would have been difficult

In 2021, the government launched plans for major reform of adult social care in its People at the Heart of Care white paper 258 Department for Health and Social Care, People at the Heart of Care: Adult social care reform white paper, Cp 560, The Stationery Office, 2021, www.gov.uk/government/publications/people-at-the-heart-of-care-adult-social-care-reform-white-paper 
 
and of the charging model for the sector in the Build Back Better white paper. 259 Department for Health and Social Care, Build Back Better: Our plan for health and social care, Cp 506, The Stationery Office, 2021, www.gov.uk/government/publications/build-back-better-our-plan-for-health-and-social-care But these plans have since been substantially pared back, with the government delaying plans for charging reform and, in April 2023, reducing funding allocated for other reforms. Those decisions break Boris Johnson’s promise to solve the social care crisis “once and for all” 260 Espadinha M, ‘Prime Minister vows to fix social care crisis’, FT Adviser, 25 July 2019, retrieved 17 October 2023, www.ftadviser.com/pensions/2019/07/25/prime-minister-vows-to-fix-social-care-crisis and push the question of reform into the next parliament, at the earliest. 

The delay in charging reforms will likely be very disappointing to both the users of social care and those who work in the sector. However, interviewees said that the combined pressures of stabilising a market in crisis and implementing a complex set of charging reforms would have been difficult for local authorities, given the resources available to them. 261 Institute for Government interviews.  Councils are under-resourced in terms of both funding – with many arguing that the money allocated for charging reforms was far below the amount needed to make them a success 262 County Councils Network, ‘New analysis warns government has ‘seriously underestimated’ the costs of adult social care charging reforms’, press release, 18 March 2022, retrieved 17 October 2023, www.countycouncilsnetwork.org.uk/new-analysis-warns-government-has-seriously-underestimated-the-costs-of-adult-social-care-charging-reforms – and staff and capacity. 263 Care England, ‘Inadequate Funding Undermines Social Care Reforms’, press release, 26 May 2022, retrieved 17 October 2023, www.careengland.org.uk/inadequate-funding-undermines-social-care-reforms A report from Newton and the County Councils Network estimated that local authorities would need to hire an additional 4,300 social workers – an increase of 39% from current numbers – and 700 more financial assessors, an increase of 25%. 264 Newton and County Councils Network, Preparing for reform, 26 May 2022, p. 32, https://futureasc.com/reform  The current backlog in care assessments would also have been exacerbated by the government’s charging reforms, which would have generated a large increase in assessments for local authorities to carry out. 265 LaingBuisson, Impact Assessment of the Implementation of Section 18(3) of The Care Act 2014 and Fair Cost of Care: A report commissioned by the County Councils Network, March 2022, p. 7, www.countycouncilsnetwork.org.uk/wp-content/uploads/LaingBuisson-Impact-Assessment-of-Section-183-FCC-FINAL-1.pdf

It is also important to emphasise that charging reforms would not have increased the amount of funding available for the sector, but rather changed the source of that funding. While the improved generosity of the means test would have helped some, reforms would not have changed many of the fundamental issues in the service, such as relatively low pay or care packages that leave many with unmet or under-met needs. 

Cost pressures mean that increased funding might not achieve all the government’s objectives

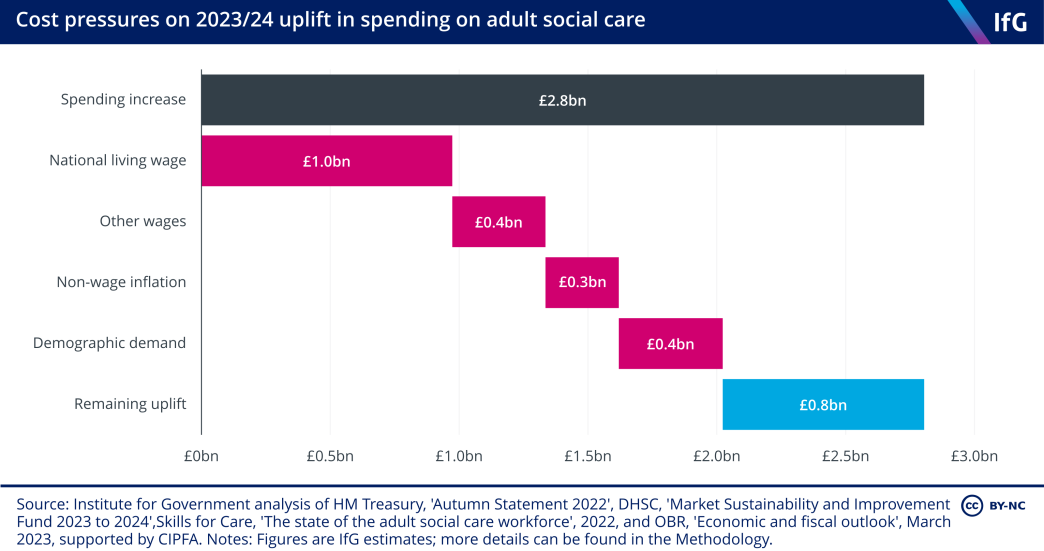
In total, spending on adult social care will rise by approximately £2.8bn between 2022/23 and 2023/24 in cash terms – the largest increase since at least 2009/10. This is a combination of new money announced in the 2022 autumn statement, previously planned changes in spending, and an additional £365m of funding through the Market Sustainability and Improvement Fund (MSIF), 266 Department of Health and Social Care, ‘Market Sustainability and Improvement Fund - Workforce Fund: policy statement', 31 August 2023, retrieved 17 October 2023, www.gov.uk/government/publications/market-sustainability-and-improvement-fund-workforce-fund/market-sustainability-and-improvement-fund-workforce-fun… which the government announced in July 2023. But providers’ cost pressures are severe, so it is unlikely that the funding will achieve its stated objectives. 

The sources of these cost pressures are multifaceted. First, a substantial proportion of the social care workforce are paid the national living wage (NLW). The government increased the NLW by 9.7% in April 2023, to compensate low-paid workers for rising inflation. 267 Low Pay Commission, ‘The National Minimum Wage in 2023’, 31 March 2023, retrieved 17 October 2023, www.gov.uk/government/publications/the-national-minimum-wage-in-2023/the-national-minimum-wage-in-2023  The Care Policy and Evaluation Centre estimates that 62.5% of the wage bill in adult social care is spent on staff who are paid the NLW, 268 Hu B, Hancock R and Wittenberg R, Projections of Adult Social Care Demand and Expenditure 2018 to 2038, Care Policy and Evaluation Centre at the London School of Economics, December 2020, p. 9, www.lse.ac.uk/cpec/assets/documents/cpec-working-paper-7.pdf meaning that any increases have a large effect on spending for adult social care. Using this proportion, the 9.7% rise in the NLW will cost providers approximately £1bn in 2023/24. 

A chart showing the cost pressures on the £2.8 billion uplift in spending on adult social care in 2023/24, displaying how much of the total will be spent on national living wage, other wages, non-wage inflation, demographic demand the remaining uplift.

The rest of the social care workforce are paid above the NLW, but providers are likely to need to raise wages for those staff as well, or risk losing them to other employers that will pay them more, and to maintain wage differentials between more and less experienced parts of the workforce. Competition for staff comes from a range of sectors, but the employer that competes most strongly for staff is the NHS. If providers were to increase social care wages in line with the public sector pay settlement of 6% (to reduce the risk of a retention crisis), the non-NLW wage bill will have to increase by approximately £0.4bn in 2023/24. 

The rising prices of other overheads – for example, fuel, food and utilities – are also increasing the cost of providing care. In the ADASS spring survey, 85% of local authorities in 2022/23 reported that overheads were driving up provider costs. This rose to 93% in 2023/24 and is considerably higher than the 16% of authorities who made the same claim in 2021/22. 274 Association of Directors of Adult Social Services, ADASS Spring Survey 2023, 20 June 2023, p. 23, www.adass.org.uk/media/9751/adass-spring-survey-2023-final-web-version.pdf  Assuming that those costs will rise in line with the consumer price index, that will add a further £0.3bn to providers’ costs. 

Finally, increasing demand from an ageing population will mean that if the government wants to provide the same level of care in 2023/24 as in 2022/23 – assuming that demand will increase in line with the over-65 population, which is likely an underestimate given increasing demand coming from the working-age population – it will cost approximately an additional £0.4bn. 

If all these cost pressures increase as assumed, there will be approximately £0.8bn of extra funding available in 2023/24 for meeting the government’s objectives. This is a substantial increase that represents just over 3% of the amount the government spent on the sector in 2021/22. But the government has earmarked this funding for a wide range of objectives. These include: stabilising the provider market, expanding provision of care, and supporting hospitals to improve discharge during the winter. It is unlikely that this amount of funding will be able to achieve all of these objectives. 275 Institute for Government interviews.

As a comparison, the government allocated only slightly less than that increase (£750m) to hospitals and the adult social care sector in 2022/23 solely to improve delayed discharge; an amount that was arguably not enough to achieve that relatively limited ambition. 

Vacancy rates are falling, but remain high

In 2021/22, 10.7% (164,000) of jobs in adult social care stood vacant – the highest annual rate on record, up from 6.7% in 2020/21. 276 Skills for Care, The state of the adult social care workforce in England, October 2022, retrieved 17 October 2023, www.skillsforcare.org.uk/Adult-Social-Care-Workforce-Data/Workforce-intelligence/documents/State-of-the-adult-social-care-sector/The-state-of-the-adu… The vacancy rate declined somewhat in 2022/23, down to 9.9% (or 152,000 posts), though this remained higher than at any point on record apart from 2021/22. 277 Skills for Care, The size and structure of the adult social care workforce in England, June 2023, retrieved 17 October 2023, p. 3, www.skillsforcare.org.uk/Adult-Social-Care-Workforce-Data/Workforce-intelligence/documents/Size-and-structure/Size-and-structure-of-the-adult-social-…; Monthly estimates of vacancy rates suggest that they have been falling since October 2022. 278 Skills for Care, ‘Vacancy information – monthly tracking’, (no date), retrieved 17 October 2023, www.skillsforcare.org.uk/Adult-Social-Care-Workforce-Data/Workforce-intelligence/publications/Topics/Monthly-tracking/Vacancy-rates.aspx

The primary reason for this reduction in vacancies is the success of international recruitment, 283 Skills for Care, The size and structure of the adult social care workforce in England, June 2023, retrieved 17 October 2023, p. 8, www.skillsforcare.org.uk/Adult-Social-Care-Workforce-Data/Workforce-intelligence/documents/Size-and-structure/Size-and-structure-of-the-adult-social-… more on which below. In addition, care workers who left the workforce in late 2021, when the government made Covid-19 vaccination a condition of employment, 284 Samuel M, ‘Mandatory vaccination enforced in care homes amid mounting staff gaps and job loss warnings’, Community Care, 11 November 2021, retrieved 17 October 2023, www.communitycare.co.uk/2021/11/11/mandatory-vaccination-rule-enforced-in-care-homes-amid-mounting-staff-shortages-and-warnings-of-more-job-losses are slowly returning to the service. Finally, some providers may have stopped recruiting for jobs due to the difficulties in filling the roles or a decision to cut back the service offering entirely. 285 Institute for Government interview.

Staff turnover is high in some key roles

Staff turnover (the proportion of staff who left their role in the previous 12 months) fell marginally from 29% in 2021/22 to 28.3% in 2022/23 – the lowest level since 2016/17. But that top line number hides substantial variation between different roles within adult social care. Turnover rates are highest for care workers and nurses – at 35.6% and 32.6% respectively in 2022/23. 286 Skills for Care, The state of the adult social care workforce in England, October 2023, retrieved 17 October 2023, p. 72, www.skillsforcare.org.uk/Adult-Social-Care-Workforce-Data/Workforce-intelligence/documents/State-of-the-adult-social-care-sector/The-State-of-the-Adu… The turnover rate among registered nurses in the service was the highest on record in 2021/22, which could be because many left the service to work in the NHS, where pay and conditions tend to be better.

The size of the workforce recovered somewhat in 2022/23

Following a year in which the number of people employed in the adult social care workforce fell for the first time on record, there was a slight improvement in 2022/23. By the end of the year, there were 1,635,000 filled posts in the service – a 1.2% increase from 2021/22. This number, however, is still lower than in either 2019/20 or 2020/21 and indicates the service’s continued difficulties with recruitment and retention. 

Even with more workers in the adult social care workforce in 2022/23 than in 2012/13, the rate of growth is arguably not keeping pace with demand for the service. The Health Foundation estimates that the number of FTE staff in the social care workforce will need to rise to 1.76 million by 2030/31 to keep pace with demand 305 Rocks S, Boccarini G, Charlesworth A and others, Health and social care funding projections 2021, The Health Foundation, October 2021, p. 70, www.health.org.uk/publications/health-and-social-care-funding-projections-2021 – an increase of 562,000 from the level of 1.20 million in 2022/23. This would require an annual growth rate of 4.9% – substantially higher than the 1.3% annual growth rate between 2012/13 and 2022/23. 

The government has now published a long-term workforce plan for the NHS, and the National Audit Office, 306 Comptroller and Auditor General, The adult social care workforce in England, Session 2017–2019, HC 714, National Audit Office, 2018, p. 44, www.nao.org.uk/wp-content/uploads/2018/02/The-adult-social-care-workforce-in-England.pdf  the House of Commons Public Accounts Committee, 307 House of Commons Committee of Public Accounts, The adult social care workforce in England: Thirty-eighth report of session 2018–19 (HC690), The Stationery Office, 2022, p. 5, https://publications.parliament.uk/pa/cm201719/cmselect/cmpubacc/690/690.pdf the Local Government Association 308 Local Government Association, ‘Our vision for a future care workforce strategy’, press release, (no date), retrieved 17 October 2023, www.local.gov.uk/our-vision-future-care-workforce-strategy  and the House of Lords adult social care committee 309 House of Lords Adult Social Care Committee, A ‘gloriously ordinary life’: spotlight on adult social care: Report of session 2022–23 (HL 99), The Stationery Office, 2022, p. 94, https://committees.parliament.uk/publications/31917/documents/193737/default have all called on the government to undertake the same exercise for the adult social care sector. The last time the government published a workforce plan for the service was under Labour in 2009. 310 Department of Health, Working to Put People First: The strategy for the adult social care workforce in England, 2009, https://data.parliament.uk/DepositedPapers/Files/DEP2009-1202/DEP2009-1202.pdf  In its response to the adult social care committee’s report, the government said that it had “set out [its] ambition for the social care workforce” in the People at the Heart of Care white paper, 311 Department of Health and Social Care, The government’s response to the Adult Social Care Committee report, CP 885, GOV.UK, updated 3 August 2023, www.gov.uk/government/publications/the-governments-response-to-the-adult-social-care-committee-report/the-governments-response-to-the-adult-social-ca…; though that document does not provide the level of detail that the NHS workforce plan does, and in March 2023 the government cut the amount of money that it plans to spend on those reforms. 312 Booth R, ‘Government ‘to cut £250m from social care workforce funding’ in England’, The Guardian, 17 March 2023, retrieved 17 October 2023, www.theguardian.com/society/2023/mar/17/government-to-cut-250m-from-social-care-workforce-funding-in-england-report-says 

International recruitment has been crucial in filling vacancies

To help address the workforce issues in the service, the government placed care workers, senior care workers and home carers on the shortage occupation list (SOL) – sectors that are eligible for special dispensation to use immigration to fill workforce gaps 313 Migration Advisory Committee, ‘A guide to the Shortage Occupation List (SOL): Companion to 2020 SOL Call for Evidence’, 27 May 2020, https://assets.publishing.service.gov.uk/government/uploads/system/uploads/attachment_data/file/887656/SOL_CfE_guide1.pdf  – in February 2022. 314 NHS Employers, ‘Social care roles added to the Shortage Occupation List’, press release, 15 February 2022, retrieved 17 October 2023, www.nhsemployers.org/news/social-care-roles-added-shortage-occupation-list  This has provided a vital source of workers for the service. In 2022/23 the government granted visas to 40,416 care workers and home carers, up from 113 in 2021/22 – a 35,666% increase. 315 Home Office, ‘Why do people come to the UK to work?’, 4 September 2023, retrieved 17 October 2023, www.gov.uk/government/statistics/immigration-system-statistics-year-ending-march-2023/why-do-people-come-to-the-uk-to-work  The number of visas granted to senior care workers – who were added to the SOL in January 2021 316 Home Office, ‘Why do people come to the UK to work?’, 4 September 2023, retrieved 17 October 2023, www.gov.uk/government/statistics/immigration-system-statistics-year-ending-march-2023/why-do-people-come-to-the-uk-to-work  – also rose in 2022/23, to 17,250 up from 6,763 in 2021/22 – a 155% increase. 317 Home Office, ‘Why do people come to the UK to work?’, 4 September 2023, retrieved 17 October 2023, www.gov.uk/government/statistics/immigration-system-statistics-year-ending-march-2023/why-do-people-come-to-the-uk-to-work  The combined total of 57,666 visas granted for the sector equates to 3.6% of the total filled roles in the service in 2022/23, almost certainly explaining some of the recent fall in the vacancy rate. One interviewee reported that the social care sector would be “in a mess” without international recruitment. 

There are, however, risks involved with this approach. First, the government set the salary threshold for eligibility for a visa at £20,960. 318 GOV.UK, ‘Health and care worker visa: If you’ll need to meet different salary requirements’, (no date), retrieved 17 October 2023, www.gov.uk/health-care-worker-visa/different-salary-requirements But variation in salaries around the country effectively creates a ‘postcode lottery’ as to whether providers will be able to recruit international staff. 319 Institute for Government interview.  For example, in March 2022 (the most recent time period for which we have data) the average salary for an FTE senior care worker was £20,800 in London and £19,500 in the West Midlands, meaning that posts in the latter were far more likely to pay less than the visa threshold, making it more difficult to hire internationally. Second, the politics of immigration creates uncertainty for providers and local authorities about whether they can rely on this as a sustainable source of workers. 320 Institute for Government interview.  Third, immigrant workers on low wages are more susceptible to exploitation by employers due to the eligibility of their visa being contingent on continuing employment. 321 Booth R, ‘UK care operators accused of ‘shocking abuse’ of migrant workers’, The Guardian, 10 July 2023, retrieved 17 October 2023, www.theguardian.com/society/2023/jul/10/uk-care-operators-accused-of-shocking-abuse-of-migrant-workers  

Brexit was expected to lead to a large exodus of EU workers from the social care workforce, 322 House of Commons Committee of Public Accounts, The adult social care workforce in England: Thirty-eighth report of session 2018–19 (HC 690), The Stationery Office, 2022, p. 11, https://publications.parliament.uk/pa/cm201719/cmselect/cmpubacc/690/690.pdf but this has not yet transpired. There has been a fall in the number of EU staff – from a peak of approximately 107,000 in 2020/21 to 93,000 in 2022/23 – but it has not been as dramatic as might have been expected. 

In contrast – and as would be expected given the large increase in visas for international recruits – the proportion of the social care workforce from outside the UK and the EU jumped to 13.5% in 2022/23 from 10.1% in 2021/22, representing a 36.8% increase in the size of that portion of the workforce in one year. In the same time, the number of British workers fell from 1.13 million to 1.11 million, a decline of 4.4%. 

Recruitment and retention are hampered by low pay…

Part of the cause of poor recruitment and retention in the service is poor pay. The Migration Advisory Council argued in its report on the sector that “higher pay is a prerequisite to attract and retain social care workers”. 339 Migration Advisory Committee, Adult Social Care and Immigration: A report from the Migration Advisory Committee, CP 665, The Stationery Office, April 2022, p. 75, https://assets.publishing.service.gov.uk/government/uploads/system/uploads/attachment_data/file/1071678/E02726219_CP_665_Adult_Social_Care_Report_Web…;

Of particular importance is the rate of pay in the service compared to other sectors. The median hourly rate for care workers was £9.50 in 2021/22 340 Skills for Care, The state of the adult social care workforce in England, October 2022, retrieved 17 October 2023, p. 15, www.skillsforcare.org.uk/Adult-Social-Care-Workforce-Data/Workforce-intelligence/documents/State-of-the-adult-social-care-sector/The-state-of-the-adu… (just 59p an hour above the NLW for adults) while sales and retail assistants were paid £9.64 an hour. 341 Skills for Care, The state of the adult social care workforce in England, October 2022, retrieved 17 October 2023, p. 15, www.skillsforcare.org.uk/Adult-Social-Care-Workforce-Data/Workforce-intelligence/documents/State-of-the-adult-social-care-sector/The-state-of-the-adu… The difference is even more stark when comparing to similar roles in the NHS. A health care assistant (HCA) who is new in the role earned £10.50 an hour in 2021/22 and an HCA with two years’ experience earned £11.30 – 18.9% more than a care worker. But this does not account for extra money that NHS employees can earn from overtime. Community Integrated Care estimates that when accounting for an HCA’s additional pay, they earn 41.1% more than an experienced social care worker. 342 Community Integrated Care, Unfair to Care 2022-23: Understanding the social care pay gap and how to close it, 19 December 2022, p. 12, www.unfairtocare.co.uk/wp-content/uploads/2022/12/Unfair-To-Care-22-23-Full-Report.pdf

Pay has risen more quickly in the service since the introduction of the national living wage (NLW), 343 Bottery S and Mallorie S, Social care 360, ‘Pay’, The King’s Fund, 2 March 2023, www.kingsfund.org.uk/publications/social-care-360/workforce-and-carers#pay  but is still below the level that would increase recruitment and improve poor retention in the sector. A solution that many have advocated is a sector-specific minimum wage to bring pay up to a sufficient level. 344 Migration Advisory Committee, Adult Social Care and Immigration: A report from the Migration Advisory Committee, CP 665, The Stationery Office, April 2022, p. 9, https://assets.publishing.service.gov.uk/government/uploads/system/uploads/attachment_data/file/1071678/E02726219_CP_665_Adult_Social_Care_Report_Web… , 345 Cominetti N, Who cares?, Resolution Foundation, January 2023, www.resolutionfoundation.org/app/uploads/2023/01/Who-cares.pdf
 
, 346 Cooper B and Harrop A, Support guaranteed: the roadmap to the National Care Service, Fabians, June 2023, p. 33, https://fabians.org.uk/wp-content/uploads/2023/06/Fabians-Support-Guaranteed-Report-WEB.pdf Providers would often like to pay their employees more but are prevented from doing so by low fees from local authorities, who are in turn restricted by the funding they receive from central government. A sector-specific minimum wage would therefore ultimately require greater funding from local authorities, funded either by increased central government grants or by more money raised locally. 

…as well as poor career progression and lack of training

It is not just pay, though, that makes working in the sector unattractive. A lack of training and progression also disincentivises care workers joining the sector and staying in post. First, the lack of formal training can mean that staff do not feel well equipped to do their jobs. Care workers often carry out skilled, complex work and yet only 46% of direct care staff have any form of qualification. 347 Skills for Care, ‘Workforce estimates – table 7.2’, (no date), retrieved 17 October 2023, www.skillsforcare.org.uk/Adult-Social-Care-Workforce-Data/Workforce-intelligence/publications/Workforce-estimates.aspx

Second, even when a carer is qualified there is little incentive for progression, with median senior care worker hourly pay only 75p higher than care worker pay. 348 Skills for Care, ‘Workforce estimates – table 6.4’, (no date), retrieved 17 October 2023, www.skillsforcare.org.uk/Adult-Social-Care-Workforce-Data/Workforce-intelligence/publications/Workforce-estimates.aspx

The benefit of training staff is well established. Work from Skills for Care shows that in 2021/22 turnover among staff with a qualification was 26.3% compared to 33.6% for those without a qualification. Older Skills for Care work surveying social care employers shows that investing in learning and development was cited as the most important intervention for improving staff retention. 349 Skills for Care, Recruitment and retention in adult social care: secrets of success, May 2017, retrieved 17 October 2023, p.35, www.skillsforcare.org.uk/resources/documents/Recruitment-support/Retaining-your-staff/Secrets-of-Success/Recruitment-and-retention-secrets-of-success…

The government was planning to address some of these issues with measures outlined in its white paper, People at the Heart of Care, which it launched in December 2021. 350 Department of Health and Social Care, People at the Heart of Care: Adult social care reform white paper, CP 560, The Stationery Office, 2021, www.gov.uk/government/publications/people-at-the-heart-of-care-adult-social-care-reform-white-paper That white paper allocated £500m to improve training and career progression for staff. 351 Department of Health and Social Care, People at the Heart of Care: Adult social care reform white paper, CP 560, The Stationery Office, 2021, p. 67, www.gov.uk/government/publications/people-at-the-heart-of-care-adult-social-care-reform-white-paper But the government announced in April 2023 that it was reallocating half of this funding to improving discharge from hospitals to social care this winter. 352 Department of Health and Social Care, Next steps to put People at the Heart of Care, 4 April 2023, retrieved 17 October 2023, https://assets.publishing.service.gov.uk/government/uploads/system/uploads/attachment_data/file/1148559/next-steps-to-put-people-at-the-heart-of-care… Some of this funding has been allocated to the sector again, in the additional funding supplied by the government to local authorities in the MSIF. 353 Department of Health and Social Care, ‘Market Sustainability and Improvement Fund - Workforce Fund: policy statement’, 31 August 2023, retrieved 17 October 2023, www.gov.uk/government/publications/market-sustainability-and-improvement-fund-workforce-fund/market-sustainability-and-improvement-fund-workforce-fun… But there are few specific requirements in the MSIF for local authorities or providers to offer training and qualification opportunities for staff, only to try to improve retention. 

Requests for support increased after a drop in the first year of the pandemic

More than 45,000 people died from Covid-19 in care homes in the first two years of the pandemic. 354 Office for National Statistics, ‘Deaths involving COVID-19 in the care sector, England and Wales: deaths registered between week ending 20 March 2020 and week ending 21 January 2022’, 28 February 2022, retrieved 17 October 2023, www.ons.gov.uk/peoplepopulationandcommunity/birthsdeathsandmarriages/deaths/articles/deathsinvolvingcovid19inthecaresectorenglandandwales/deathsregis… That well-publicised crisis contributed to 2.4% fewer people aged 65 and over requesting state-funded care in 2020/21 compared to 2019/20. That year now appears to be an anomaly and in 2022/23 more than two million people requested support for the first time, a number that is 10.6% higher than in 2015/16. 

That decline in the first year of the pandemic could have implied that there was pent- up demand for the service that might come back as the government rolled out the vaccine in late 2020 and care homes improved their infection prevention and control. 

But while the number of requests from those aged 65 and over did increase again in 2021/22 and 2022/23 – by 2.2% and 1.7% respectively – there has arguably not been a large surge in requests that might have been expected given the drop during the pandemic. It is difficult to provide definitive reasons for this relative flattening off in demand, but there are some potential causes. First, more people aged 65 and over died in 2020/21 than would have been expected to in a normal year (either due to Covid-19 or with the involvement of Covid-19) 357 Office for National Statistics, ‘Single year of age and average age of death of people whose death was due to or involved coronavirus (COVID-19)’, 23 August 2023, retrieved 17 October 2023, www.ons.gov.uk/peoplepopulationandcommunity/birthsdeathsandmarriages/deaths/datasets/singleyearofageandaverageageofdeathofpeoplewhosedeathwasduetoori…;
 
– in total, there were 91,700 excess deaths among the 65+ population in England in 2020/21 (equating to 0.9% of the 65+ population). This decline in the population will necessarily reduce the number of requests for care. 

Second, there continues to be falling rates of disability among older people; 358 Office for National Statistics, ‘Disability by age, sex and deprivation, England and Wales: Census 2021’, 8 February 2023, retrieved 17 October 2023, www.ons.gov.uk/peoplepopulationandcommunity/healthandsocialcare/disability/articles/disabilitybyagesexanddeprivationenglandandwales/census2021 the census shows that among those aged 65+, the proportion of the population that were disabled declined from 53.1% in 2011 to 35.2% in 2021, though some of this change could be because the census question changed between 2011 and 2021. This reduction in the proportion of people identifying as disabled means that even though the 65+ population grew from 8.7 million to 10.4 million (20.1%), there were actually 936,165 fewer people aged over 65 who identified as disabled in the census. 

At the same time, the number of working-age adults requesting care reached a record high in 2021/22, and remained at more or less the same level in 2022/23. By the end of that year, there were 22.2% more requests for support from the working- age population than in 2015/16. This relatively large increase (compared to the 65+ population) is likely to be due to increasing rates of disability among working-age adults. The proportion of the population aged 20–64* identifying as disabled in the 2021 census rose from 13.4% in 2011 to 15.6% in 2021. That change may not sound substantial, but it equates to more than 900,000 additional working-age adults living with a disability within one decade. Interviewees speculated that this could be due to improvements in treating conditions, though the ONS also warns that a better understanding of mental health may have led to an increase in the reporting of disability among working-age adults. 364 Office for National Statistics, ‘Disability by age, sex and deprivation, England and Wales: Census 2021’, 8 February 2023, retrieved 17 October 2023, www.ons.gov.uk/peoplepopulationandcommunity/healthandsocialcare/disability/articles/disabilitybyagesexanddeprivationenglandandwales/census2021

This increase also has implications for the sustainability of local authority finances; it is more expensive on average to provide long-term care to working-age adults. Over half of public expenditure on long-term care in 2021/22 was spent on adults aged 18–64, even though they accounted for only 35% of those accessing long-term care during the year. 365 NHS Digital, ‘Adult Social Care Activity and Finance Report, England, 2021-22‘, 20 October 2022, https://digital.nhs.uk/data-and-information/publications/statistical/adult-social-care-activity-and-finance-report It seems unlikely that this trend will reverse. The Care Policy and Evaluation Centre estimates that “29% more adults aged 18 to 64 will need care in 2038 compared with 2018”, an increase that is driven predominantly by rising numbers of people requiring learning disability support. 366 Comptroller and Auditor General, The adult social care market in England, Session 2019–2021, HC 1244, National Audit Office, 2021, p. 45, www.nao.org.uk/wp-content/uploads/2021/03/The-adult-social-care-market-in-England.pdf The same report estimates that the cost of providing publicly funded care to working-age adults will rise by 56.9% between 2023 and 2038 367 Comptroller and Auditor General, The adult social care market in England, Session 2019–2021, HC 1244, National Audit Office, 2021, p. 49, www.nao.org.uk/wp-content/uploads/2021/03/The-adult-social-care-market-in-England.pdf – an average of 3.0% per year. 

*Data is for those aged 20–64 rather than 18–64 because the ONS only provides data in five-year age bands, meaning that 18- and 19-year-olds are grouped with 15-, 16- and 17-year-olds, making it impossible to disaggregate them. 

Local authorities have not cleared the assessment backlog

ADASS surveys 368 Association of Directors of Adult Social Services, ADASS Spring Survey 2023, 20 June 2023, www.adass.org.uk/media/9751/adass-spring-survey-2023-final-web-version.pdf estimate that there was a large increase in the number of people awaiting assessments for care during the pandemic, reaching a peak of 294,449 people in April 2022. 

This number has gradually declined in the year since, falling to 224,978 in March 2023 – a 23.6% decrease. But the number still stands 10.2% above the level in November 2021, when the data was first collected. 

Notably, the number of people waiting more than six months has continued to increase, even as the overall number awaiting assessments has declined. The proportion of those waiting more than six months reached 36.5% in March 2023, up from 20.2% in November 2021. This implies that local authorities are providing assessments more quickly to those who have recently applied for an assessment than those that have been waiting longer. 

The failure to clear the backlog is caused at least in part by a lack of social workers in local authorities (see previous section): fewer social workers are trying to clear a larger number of assessments. The government has identified reducing social care waiting times as one of its targets for the Market Sustainability and Improvement Fund. 372 Department of Health and Social Care, ‘Market Sustainability and Improvement Fund - Workforce Fund: policy statement’, 31 August 2023, retrieved 17 October 2023, www.gov.uk/government/publications/market-sustainability-and-improvement-fund-workforce-fund/market-sustainability-and-improvement-fund-workforce-fun…;

More people are providing large amounts of unpaid care

Unpaid care – when individuals care for friends or family members without being compensated for their time – is difficult to observe and quantify but is nonetheless vital to the operation of the adult social care sector in England. Carers UK and the University of Sheffield used 2021 census data to estimate that unpaid carers provide over 6 billion hours of unpaid care in England per year. 373 Petrillo M and Bennett M, Valuing carers 2021: England and Wales, Carers UK and Centre for Care, 2021, p. 28, www.carersuk.org/media/2d5le03c/valuing-carers-report.pdf

Despite the importance of this provision, there is little publicly available data about the extent of unpaid care. The primary source is the census, which provides a once- a-decade snapshot of unpaid care. The results from 2021 show that the proportion of people who provided unpaid care in England fell from 10.2% in 2011 to 8.8% in 2021. 374 Office for National Statistics, ‘Disability by age, sex and deprivation, England and Wales: Census 2021’, 8 February 2023, retrieved 17 October, www.ons.gov.uk/peoplepopulationandcommunity/healthandsocialcare/healthandwellbeing/bulletins/unpaidcareenglandandwales/census2021 That fall was driven mostly by fewer people providing small numbers of hours of care (less than 19 hours per week). In contrast, the population providing 20–49 hours and 50+ hours of care per week both increased, from 1.4% and 2.4% respectively in 2011 to 1.8% and 2.6% in 2021. 

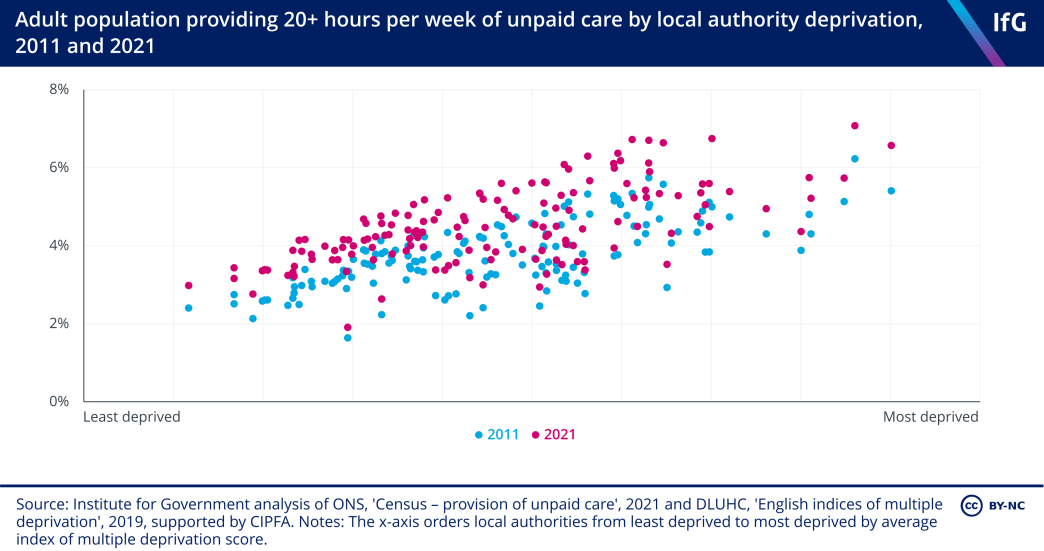
The distribution of those providing large amounts of unpaid care is not even across the country. The more deprived a local authority, the more likely it is that someone living there is providing more than 20 hours per week of unpaid care.

An Institute for Government scatter plot showing the percentage of the adult population providing 20+ hours of unpaid care per week by local authority. The chart shows an increase in the percentage from 2011 to 2021, with more deprived local authorities having a higher percentage of adults offering unpaid care

There are, however, some caveats to this data. First, the question in the census changed and gave unpaid care a narrower definition in 2021 than in 2011, potentially leading to fewer people identifying with the definition. Second, the census was also taken during the first year of the pandemic, when lockdown and other social distancing measures may have affected people’s answers. 

Whatever the reasons, there is a distinct lack of accurate information about the extent of unpaid care in the country. The government should publish a more frequent and consistent set of data to track the contribution that unpaid carers make. The government has stated its ambition to publish more data about unpaid carers in its Care Data Matters guidance, 376 Department of Health and Social Care, ‘Care data matters: a roadmap for better data for adult social care’, 4 May 2023, retrieved 17 October, www.gov.uk/government/publications/care-data-matters-a-roadmap-for-better-data-for-adult-social-care/care-data-matters-a-roadmap-for-better-data-for-… though it is not expecting to publish any new datasets until at least 2025/26. 

The number of people receiving long-term care rose in 2022/23

The number of people receiving long-term care* in 2022/23 grew for the first time since 2016/17. Despite that, there were still fewer people in long-term care at the end of the year than at the end of 2019/20, despite requests for support being 3.7% higher. The proportion of requests for support that result in long-term care has also fallen from 9.1% in 2016/17 to 8.5% in 2022/23. The reasons for the relative difficulty in accessing long-term care compared to the beginning and middle of the 2010s are multifaceted, but primarily this is due to local authorities rationing care to people who would previously have been eligible for care, as is discussed further below. 

At the end of 2022/23 there were 628,895 people receiving long-term care, compared to 613,350 at the end of 2021/22 – a rise of 2.5%. Compared to 2014/15, there were 30,090 fewer people receiving long-term care at the end of 2022/23, a fall of 4.6%. In the same time, the number of requests for support grew by 10.6%. 

*Long-term care is defined as care “provided to clients on an ongoing basis and varies from high intensity provision such as nursing care, to lower intensity support in the community such as the provision of direct payments to arrange regular home care visits”.

The fall since 2015/16 has been driven by a decline in the number of people aged 65 and over accessing care; there were 542,545 people from that age group in care at the end of 2022/23, down from 602,885 2014/15 – a 10.0% fall. In the same time, the over-65 population has increased, meaning that the per capita decline in the number of people receiving care was even greater. Despite a slight (1.0%) improvement in 2022/23 compared to 2021/22, the per capita number of people aged 65+ receiving long-term care is 20.3% lower than 2014/15. 

The proportion of working-age adults – those aged 18–64 – receiving long-term care has risen slightly since 2014/15, by 2.1%. But adjusted for the increased size of the population there are fewer working-age adults receiving care than in that earlier year. By the end of 2022/23, the per capita number of working-age adults receiving care was 0.7% lower than in 2014/15. This is despite the increasing incidence of disability among that age group 379 Office for National Statistics, ‘Disability by age, sex and deprivation, England and Wales: Census 2021’, 8 February 2023, retrieved 17 October,www.ons.gov.uk/peoplepopulationandcommunity/healthandsocialcare/disability/articles/disabilitybyagesexanddeprivationenglandandwales/census2021 – a metric that implies greater demand. 

One possible reason why the proportion of the working-age population accessing long-term care has fallen less slowly than for older adults could be because there is a bias among commissioners that younger adults have a greater requirement for socialising than older adults, meaning they are more likely to have access to care that provides that benefit. 380 Institute for Government interview.

The number of people receiving nursing and residential care fell substantially in 2020/21 due to the well-publicised prevalence of Covid-19 in nursing and residential care in that year. That trend reversed in 2021/22 and 2022/23, and 180,430 people were receiving care in those settings at the end of the year – a 5.0% increase from the 171,855 people at the end of 2020/21. This is still 4.9% less than in 2019/20. In comparison, the number of people in community settings was 1.9% higher at the end of 2022/23 than in 2019/20, though still 2.2% lower than in 2014/15.

A decline in people receiving long-term support is unlikely to be because other models are working

This long-term decline in people accessing care comes despite more people requesting long-term support in 2022/23 than any other year on record, and largely reflects a long-term trend of rationing of adult social care services. 

These services are firstly rationed by central government-set means and needs tests. The means test for social care – which tests an individual’s wealth and therefore their eligibility for publicly funded care 382 Foster D, Reform of adult social care funding: developments since July 2019 (England), House of Commons Library, 12 May 2021, retrieved 17 October 2023, p. 5, https://researchbriefings.files.parliament.uk/documents/CBP-8005/CBP-8005.pdf – has not risen in line with inflation since 2010. There has only been one increase in the lower and upper capital limits of the means test since 2009/10, which happened in 2010/11 when the lower limit rose from £14,000 to £14,250 and the upper limit rose from £23,000 to £23,250. 

Both the lower and upper capital limits are now approximately 25% lower than they would be if they had risen in line with inflation since 2009/10. The failure to uprate the thresholds has made the means test less generous over time, making it harder for individuals to access care. 

The government sets the criteria for eligibility for adult social care support, which is also known as the needs test. This was last updated in the 2014 Care Act. 387 Social Care Institute for Excellence, ‘Determination of eligibility under the Care Act’, (no date), retrieved 17 October 2023, www.scie.org.uk/care-act-2014/assessment-and-eligibility/determination-eligibility  

While the needs test has remained unchanged in recent years, local authorities are effectively using subjective judgments about need to further ration care to adults. 388 Local Government Ombudsman, ‘Complaints about English social care increasingly due to funding constraints’, press release, 12 October 2022, retrieved 17 October 2023, www.lgo.org.uk/information-centre/news/2022/oct/complaints-about-english-social-care-increasingly-due-to-funding-constraints-ombudsman That rationing is a direct result of central government’s decision to cut grant funding by more than 30% since 2010, 389 Atkins G and Hoddinott S, Local government funding in England, Institute for Government, 10 March 2020, retrieved 17 October 2023, www.instituteforgovernment.org.uk/explainer/local-government-funding- england without enough of an increase in locally raised revenue to offset those cuts. 

Few local authorities would admit publicly* that they ration long-term care and would instead claim that they are following a ‘strengths-based’ approach to care – in which people are empowered to live and contribute to their communities, rather than relying on long-term support. 390 Social Care Institute for Excellence, ‘Care Act guidance on Strengths-based approaches’, March 2015, retrieved 17 October 2023, www.scie.org.uk/strengths-based-approaches/guidance  This approach has merits in theory – the goal of social care should be to empower individuals to live independently, and better integration into the community would help that – but it is difficult to point to strong evidence that it is happening in practice. 

One indicator that authorities were pursuing this approach would be a substantial increase in the number of people receiving short-term care packages that are designed to increase individuals’ independence and reduce their reliance on long- term care. These care packages are known as ST-Max packages.**

*Local authority interviewees frequently tell us privately that they have no choice but to ration services. 

**ST-Max is defined as “episodes of support provided that are intended to be time limited, with the intention of maximising the independence of the individual and reducing/eliminating their need for ongoing support by the [council with responsibility for adult social services]”.

But this is not the case. The number of people receiving ST-Max packages fell slightly in 2022/23 compared to 2021/22 – a total of 251,260 compared to 252,145 – and is 4.0% below the record high of 261,065 in 2019/20 and 1.2% below the 254,550 provided in 2014/15, when this dataset began. It is very likely that fewer people were able to access short-term care in 2020/21 and 2021/22 due to the pandemic, but there were only 2.8% more ST-Max packages in 2019/20 than in 2014/15 – years that were unaffected by the pandemic. Over the same period, the adult population grew by 4.8%, the over-65 population by 9.8%, and requests for care by 4.6%. These are all imperfect proxies for demand for adult social care, but if local authorities were investing in short-term care to improve the likelihood of someone not having to access long-term care, it would be reasonable to expect that the number of ST-Max packages would have grown more quickly than 2.8%. 

Another indicator that local authorities were shifting to a strengths-based approach would be increasing support to carers, as this would allow those they care for to live more independently, without care from providers. But once again, there is no evidence that this is happening: while the number of requests for support for unpaid carers has fallen since 2014/15 – by 16.3% in 2022/23 – the amount of direct support provided by local authorities has declined by more, falling 30.0%. 

It has also been argued to us by the DHSC that local authorities are taking a holistic approach to meeting people’s care needs, which means focusing more on prevention and directing people towards other services for which there is little or no data. 

However, there is no indication in local authority spending data that spending is increasing on preventative services 393 Atkins G and Hoddinott S, Neighbourhood services under strain, Institute for Government, April 2022, www.instituteforgovernment.org.uk/publication/neighbourhood-services-under-strain  , 394 Finch D and Vriend M, ‘Public health grant: What it is and why greater investment is needed’, blog, The Health Foundation, 17 March 2023, retrieved 17 October 2023, www.health.org.uk/news-and-comment/charts-and-infographics/public-health-grant-what-it-is-and-why-greater-investment-is-needed (see the ‘Neighbourhood services’ chapter for further details). On the contrary, local authorities spend remarkably little on information and early prevention as part of their adult social care spending; only 1% of the amount that councils spent on adult social care in 2021/22 was directed towards this end. That amount has also largely remained flat over time, and is actually 0.5% less in real terms than the amount spent in 2015/16. 

The data also does not support the assertion that local authorities are directing people to other services. The proportion of requests for support that resulted in ‘signposting to another service’ – in other words, giving individuals information about other services that might better meet their needs – has fallen over time: in 2016/17 28.5% of requests resulted in ‘signposting’; by 2022/23 this was 27.3%. In contrast, between 2016/17* and 2022/23, the proportion of requests for support that led to no service being offered rose from 27.3% to 29.5%, surpassing ‘signposting’ as the most common outcome of a request for support in 2020/21. 

*2016/17 is the starting year here because it is the first year for which there is a time series of reasons that is then consistent through to 2021/22. 

Given all the evidence available, it is reasonable to infer that the main reason for declining rates of people accessing long-term support is the rationing of care. Indeed, the Institute for Government is not alone in its assessment that local authorities have been forced to ration care. In 2018, the Health and Social Care Committee and the Levelling Up, Housing and Communities Committee concluded that “as a result of funding pressures, local authorities are providing care and support to fewer people and concentrating it on those with the highest levels of need” 402 House of Commons Health and Social Care Committee and Levelling Up, Housing and Communities Committee, Long-term funding of adult social care: First joint report of the committees in session 2017–19 (HC 768), The Stationery Office, 2018, p. 10, https://publications.parliament.uk/pa/cm201719/cmselect/cmcomloc/768/768.pdf  – rationing by another name. The King’s Fund 403 Bottery S and Mallorie S, Social care 360, ‘Access’, The King’s Fund, 2 March 2023, www.kingsfund.org.uk/publications/social-care-360/access  and Nuffield Trust 404 Schlepper L and Dodsworth E, ‘The decline of publicly funded social care for older adults’, blog, Nuffield Trust, 13 March 2023, retrieved 17 October 2023, www.nuffieldtrust.org.uk/resource/the-decline-of-publicly-funded-social-care-for-older-adults also reached the same conclusion. 

As a result of rationing, unmet need is a major problem. In March 2023, Age UK estimated that 2.6 million people aged over 50 in England were living with some form of unmet need 405 Age UK, ‘Older people are often waiting far too long for the social care they need’, press release, 6 March 2023, retrieved 17 October 2023, www.ageuk.org.uk/latest-press/older-people-are-often-waiting-far-too-long-for-the-social-care-they-need – about one in eight people in that age group. 406 Office for National Statistics, ‘Age by single year: Census 2021’, 13 December 2022, retrieved 17 October, www.ons.gov.uk/datasets/TS007/editions/2021/versions/3 It is difficult to fully quantify the impact of unmet need, but it is likely that it increases demand for other services such as general practice and accident and emergency. 407 Charles A, ‘Unmet need for health and social care: a growing problem?’, blog, The King’s Fund, 25 November 2016, retrieved 17 October 2023, www.kingsfund.org.uk/blog/2016/11/unmet-need-health-and-social-care-growing-problem Research from the Institute for Fiscal Studies shows that the average cut of £375 in per-person spending on adult social care between 2009/10 and 2015/16 led to an additional 0.09 visits per person to A&E among those aged 65 and over, compared to the average of 0.37 visits in 2009/10 – a 24.3% increase. 408 Crawford R, Stoye G and Zaranko B, ‘Long-term care spending and hospital use among the older population in England’, Journal of Health Economics, 2021, vol. 78, no. 574, www.sciencedirect.com/science/article/pii/S016762962100062X?via%3Dihub#sec0013

Related content

14 MAR 2024 Project

Performance Tracker

Our flagship report assesses the comparative problems faced by critical public services such as the NHS, schools and the police.

03 JAN 2024 IfG in the news

BBC News: Junior doctor strikes

Senior researcher Stuart Hoddinott speaks to BBC News amid the ongoing junior doctor strike, and comments on the impact on the performance of the NHS.