Civil service staff numbers
Who exactly are civil servants and how many are there?

Who exactly are civil servants?
Civil servants are politically impartial, appointed officials of the UK Home Civil Service, which supports the work of the UK’s central government departments. This includes agencies that employ civil servants such as executive agencies, non-ministerial departments and some non-departmental public bodies.
Our analysis includes the staff of the Scottish and Welsh devolved governments, but not the staff of the Northern Ireland Civil Service, which is administratively distinct. We also include officials working in the three Whitehall-based territorial offices that manage the UK’s relationship with Scotland, Wales and Northern Ireland.
In this way, civil servants are defined much more narrowly than public sector workers: police, teachers, NHS staff, members of the armed forces and local government officers are not counted as civil servants.
The data we use for our analysis of civil service staff numbers comes from the Office for National Statistics (ONS), which provides quarterly estimates of the number of civil servants employed. Unless otherwise indicated, the figures given throughout this explainer are for whole departmental groups rather than core Whitehall departments, and refer to full-time equivalent (FTE) numbers rather than headcount. For more details on our handling of staff numbers data, including how we define departmental groups, see the methodology section from our latest Whitehall Monitor report.
How many civil servants are there?
As of March 2026 there were 523,635 (FTE) civil servants – 2,775 (0.53%) more than the previous quarter. This continues the long-running trend of growth in the size of the civil service; the civil service shrank in only two quarters since Q2 2016. The latest figure (Q1 2026) represents an increase of 7,165 (1.39%) over the past 12 months.
While the government has indicated its intention to reduce the overall size of the civil service through initiatives such as voluntary exit schemes, this has not been indicated in the aggregate figures for the most recent quarter.
The total number of civil servants has fluctuated significantly since 2010. The size of the civil service, already falling before the 2010 spending review, fell by 19% between 2010 and 2016. This meant that in June 2016, when the EU referendum took place, the civil service had a workforce of 384,230 – the smallest it had been since the Second World War, although numbers never quite reached the low of 380,000 anticipated by the 2012 Civil Service Reform Plan. 4 Civil Service, 'Civil Service reform plan', June 2012, retrieved 16 March 2023, www.gov.uk/government/publications/civil-service-reform-plan, p. 11
The civil service started growing again after the referendum (from Q3 2016) and saw increases in staff numbers for 23 consecutive quarters, surpassing its size in Q3 2010 by mid-2021. Other than slight falls in Q2 2022 and Q4 2024, it has continued growing since.
Because this growth of the civil service since 2016 was partly spurred by the preparations to leave the EU and the pandemic, there has been a notable increase in the number of policy specialists. Since March 2016, just before the EU referendum, the policy profession has grown by 19,275 staff – an increase of 116%. However, the Government Digital and Data profession has also grown significantly – by 152%, though the absolute increase in numbers is smaller than in the policy profession. The largest absolute increase in the number of civil servants since 2016 has been in the operational delivery profession, which has grown by more than 66,810 staff (31%) – reflecting pressures on frontline services.
After this significant growth in the size of the civil service, recent governments have committed to cut it. These efforts have been unsuccessful thus far, with numbers of civil servants continuing to rise, with only the two isolated exceptions of Q2 2022 and Q4 2024.
How many civil servants are employed by each department?
There is significant variation in the number of civil servants employed in different government departments.
The largest departments are often those whose work is focussed on ‘delivery’ or providing services directly to the public. The Ministry of Justice (MoJ), for example, employs tens of thousands of prison officers, and is the largest department with over 90,000 staff in total. The Department for Work and Pensions (DWP) administers universal credit, tax credits and pensions, and is the second largest department with over 87,000 staff. The third largest is HMRC, with over 70,000 staff. Around 68% of all civil servants work in the five largest departments, or their respective agencies and non-departmental bodies: the MoJ, DWP, HMRC, the Ministry of Defence (MoD) and the Home Office (HO).
The five smallest main departments (excluding the territorial offices) in terms of staff are the Department for Culture, Media and Sport (DCMS), HM Treasury, the Department for Science, Innovation and Technology (DSIT), the Department for Energy Security and Net Zero (DESNZ), and the Foreign, Commonwealth and Development Office (FCDO). These departments can be less than 2.5% of the size of the largest departments. DCMS, for example, has 2,155 staff.
Departments also differ in how their staff are organised. In the larger departments, except for the MoJ, most civil servants often work in the ‘core’ departments, rather than in executive agencies or non-ministerial departments that the core department oversees. By contrast, departments such as the Department for Transport (DfT), the Department of Health and Social Care (DHSC) and the Ministry of Housing, Communities and Local Government (MHCLG) have more of their staff in the bodies that they oversee than in the core department: there are 3,665 staff in MHCLG’s core department and 7,475 in the organisations it oversees, such as HM Land Registry. In the case of the MoJ, the vast majority of staff in the departmental group are employed by HM Prison and Probation Service rather than the core department.
How have civil service numbers changed in different departments?
The fluctuation in the overall size of the civil service since 2010 is reflected in individual departments’ staffing numbers. Most departments saw their staffing fall from 2009, before rising in later years.
All but four departments now have more civil servants than they did in 2010. DCMS is almost 280% larger, while the Cabinet Office has seen its workforce expand by almost 130%. By contrast, some ‘operational’ departments which employ large numbers of staff – DWP and HMRC – employ fewer civil servants now than they did in 2010.
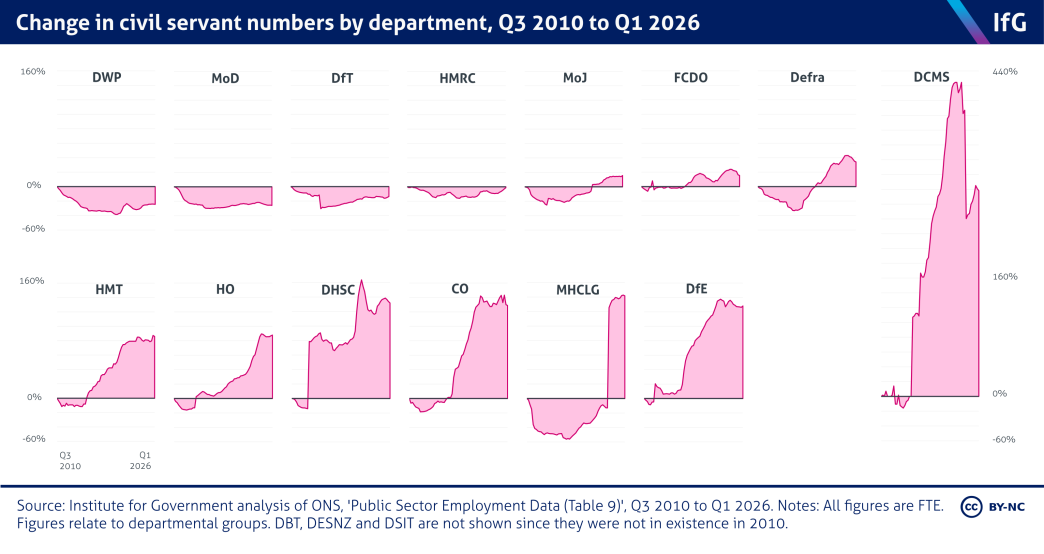
The specific drivers of some of the recent expansions in the civil service – such as the pandemic – are to some extent evident in departmental trends.
Before its merger with BEIS to form the Department for Business and Trade, for example, DIT more than tripled in size after its staff numbers were first reported in Q4 2016. Other departments which had significant responsibilities preparing for and implementing Brexit, such as DCMS, the Cabinet Office and Defra, also saw significant proportional growth after the referendum.
The pandemic also drove growth in the number of civil servants. As is evident in the chart above, between Q4 2019 and Q3 2021 DHSC saw the highest proportional growth of all departments – adding 4,220 civil servants (46%). The department then saw a trend of reducing its numbers of civil servants – perhaps due to pandemic pressures abating – though it has fluctuated in size more recently.
As noted above, the most significant driver of growth in the civil service since 2016 has been the expansion of the operational delivery profession. This has taken place in departments classed as ‘frontline’, such as MoJ and the Home Office.
What are the latest changes to civil service staff numbers?
Data from the latest quarter (Q1 2026) show reductions in staff in most of the main departments compared to the previous quarter. The largest proportional decrease was seen in the Foreign, Commonwealth and Development Office, which shrank by 1%.
The largest proportional increases this quarter were seen at DSIT (2.5%), HMRC (1.6%), the MoJ (1.4%) and DfT (1.4%). The largest absolute increases, of 1,285 and 1,140 FTE, occurred in the MoJ and HMRC respectively.
Over the past 12 months, DSIT has seen by far the highest proportional growth, of 19.8%. The highest absolute growth over this period was in HMRC (4,500 FTE).