Working to make government more effective

Explainer

Public service productivity

What is public service productivity and how is it measured?

Measured productivity fell dramatically during 2020 as the pandemic changed how public services operated and led to a reduced quantity of ‘normal’ activity. It only recovered partially in 2021, remaining 9% below 2019 levels and 5% below 1997 levels.

The government has, in recent years, focused increasingly on improving the productivity of the public sector, and specifically public services. For example, at the November 2023 autumn statement chancellor Jeremy Hunt set a target for public sector productivity to grow by 0.5% per year. 18 www.gov.uk/government/publications/autumn-statement-2023/autumn-statement-2023-html

There are two broad reasons why improving public sector productivity is important in the current context. First, the UK has experienced a productivity slowdown since the 2008 financial crisis. The public sector accounts for around 25% of GDP, 19 www.ons.gov.uk/economy/grossdomesticproductgdp/datasets/realtimedatabaseforukgdpcomponentsfortheexpenditureapproachtothemeasureofgdp  so a more productive public sector can help to contribute to stronger economy-wide productivity growth. 20 This is smaller than the ratio of government spending to GDP because transfers from the government to households (for example, through working age benefits and pensions) do not contribute to GDP.

Second, as the Institute for Government’s Performance Tracker has shown, performance across most public services is poor, and demand is continuing to grow. But spending plans going forwards are ungenerous. Improving public service productivity is one way to improve or maintain performance without spending more.

What is public services productivity?

Productivity is a measure of how efficiently the economy uses the inputs available (like workers, buildings and machinery) to create output. For public services, conceptually this means how well public services use resources to achieve relevant outputs and outcomes – for example, how effectively the health service translates its resources into improvements in the nation’s health.

In practice, measures of public service productivity focus on how public spending translates into outputs (like the amount of activity done), rather than outcomes (like healthy life expectancy). Improvements in outcomes could be achieved by changing where government spends money, for example by focusing more on preventative services – a concept known as allocative efficiency.

How does the Office for National Statistics (ONS) measure public services productivity?

Measuring productivity in the public sector is difficult. In most of the private sector, the value of output is measured by the market price. But there is no equivalent price for the output of most public services because most are provided free at the point of use, or at the very least are highly regulated.  

For this reason, the output of public services has historically been simply calculated by its input: £100bn spent on health care was deemed to be worth £100bn of health care output. When measured this way, greater efficiency in the service does not lead to higher measured productivity as the assumed input/output calculation remains the same.

However, the ONS, which is highly regarded internationally, has made advances in measuring productivity in public services. 23 www.ons.gov.uk/economy/economicoutputandproductivity/publicservicesproductivity  For services where relevant data and metrics are available, it now measures output based on the quantity of activity performed, with an adjustment made for the quality of outcomes associated with that activity. For example, productivity in the NHS is measured based on how inputs are converted into a range of different activities (for example, elective surgeries), with a quality adjustment made (for example, the survival rate after surgery). In practice, the ONS method uses outputs across hospitals, GPs, dentistry and other areas for its healthcare estimate and employs a similar broad approach in other services. 24 www.ons.gov.uk/economy/economicoutputandproductivity/publicservicesproductivity/methodologies/methodologicaldevelopmentstopublicserviceproductivityhe…

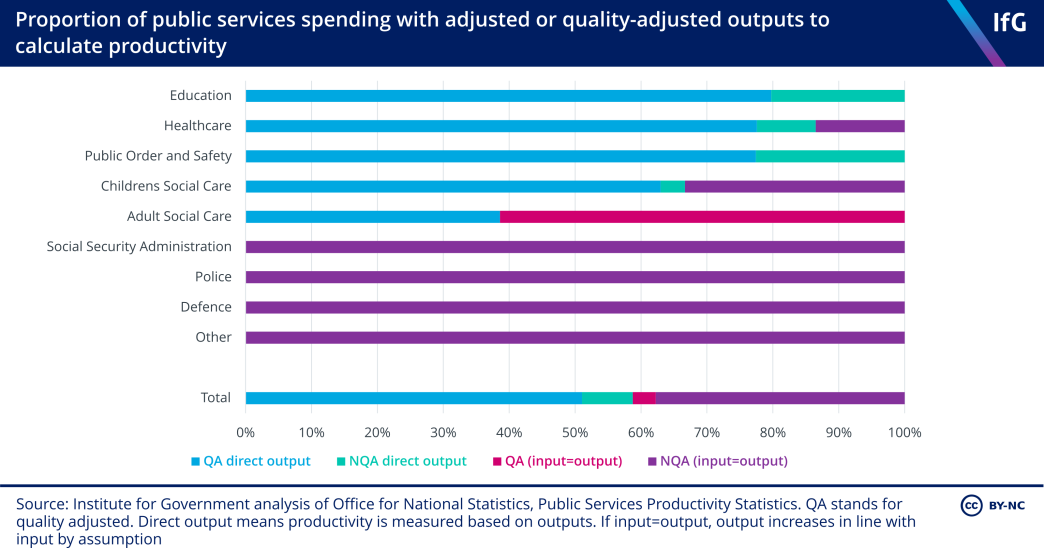
But suitable metrics to measure the relevant outputs of public services do not exist in all cases. For example, the output of defence spending is difficult to define conceptually. In these cases, the ONS retains the inputs equals output approach. In some other areas, the ONS does not have ways to adjust the quality of output and so uses unadjusted quantities. The chart shows the breakdown across services. This shows that the ONS uses outputs or quality-adjusted outputs for 60% of public services spending.

A chart from the Institute for Government showing proportion of public services spending with adjusted or quality-adjusted outputs to calculate productivity

What happened to measured public services productivity between 1997 and 2019?

Public services productivity (1997-2022)

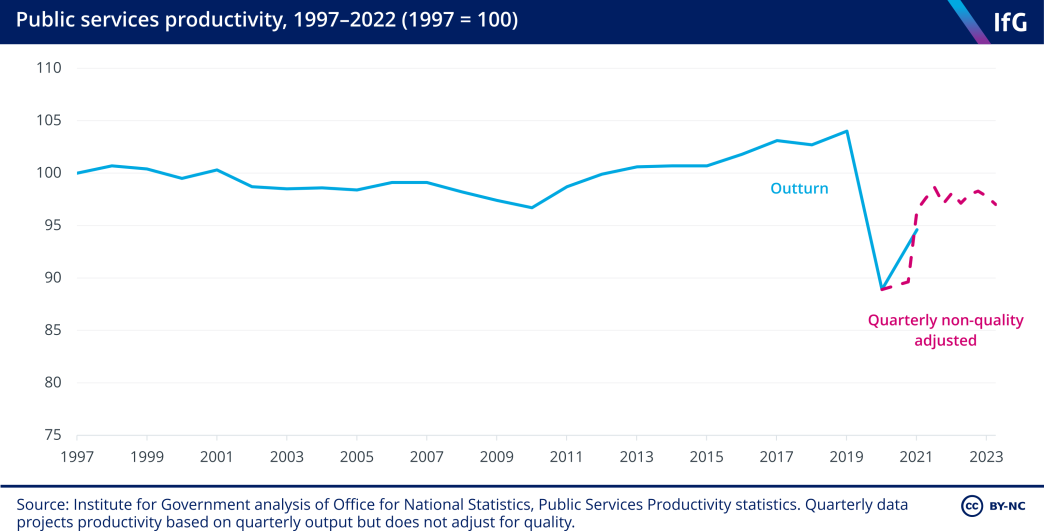
Between 1997 and 2019, measured public service productivity increased on average by 0.2% per year. In contrast, economy-wide productivity increased by 1.1% per year on average over that period. Among all the public services the ONS measures, only healthcare saw increases in productivity (of 0.9% per year on average), while all other services declined in productivity. Public order and safety (which includes prisons and courts) declined most rapidly, by 1.5% per year on average.

This period can broadly be split into two: the period between 1997 and 2009, where productivity fell by 0.2% per year on average, and the period 2009 to 2019 where productivity increased by 0.7% per year on average. However, this should be interpreted cautiously. The way productivity is measured is not perfect, and there may be other aspects of service quality not captured in these numbers. Furthermore, several of the decisions made by government during the 2010s – in particular, cuts to capital spending and wage restraint – reduced inputs in the short term but may not have led to permanent sustainable increases in productivity. For example, while low investment leads to lower quality estates further down the line this may not be captured by the ONS snapshot of productivity. This is something Performance Tracker has identified as a factor holding back public service productivity now.

What has happened to public service productivity since the onset of the pandemic?

Measured productivity fell dramatically during 2020 as the pandemic changed how public services operated and led to a reduced quantity of ‘normal’ activity. This was most clear in health care, where almost all non-emergency procedures were put on hold and the activity of the service focused on dealing with the pandemic. However, it also happened in other services (for example, fewer court cases were heard). This led to a very large fall in measured productivity. In 2020, overall public service productivity fell by over 15%. It only recovered partially in 2021, remaining 9% below 2019 levels and 5% below 1997 levels.

How public service productivity has recovered since then is still uncertain, in part because the ONS’s official statistics, incorporating a full quality adjustment, are only published with a three-year lag. Other research has shed some light on the state of public services more recently and presents a gloomy picture. Relative to 2019, the government has put a lot more money into public services, increasing inputs. However, in some services – healthcare in particular – there has not been a commensurate increase in activity. Between 2019 and 2023, staffing levels in the NHS increased by almost 20%, but key measures of activity remained broadly flat. 27 www.ifs.org.uk/articles/there-really-nhs-productivity-crisis  Performance Tracker identifies a similar, though not as stark trend, in other services like the police.

While the fully comprehensive ONS productivity measures are not yet available post-2021, the ONS has provided some less comprehensive but more up-to-date estimates. Using quarterly data on service activity (not adjusting for quality), the ONS estimates that productivity was around 6% lower in 2022 than 2019 (and around 2% lower than 1997). They have also presented an alternative ‘dynamic regression’ estimate, which attempts to capture how quality might have changed based on past annual data, and implies productivity in 2022 was similar to 2019. However, this method, which was produced before the 2021 full data was available, was overly optimistic about the recovery of productivity in that year, 28 The dynamic regression suggested productivity in 2021 would be 2% higher than 1997 levels, with a lower confidence interval of 0.4% below. The final value was over 5% below 1997 levels.  and it would be surprising if quality has improved as much as the ONS’ dynamic estimate implies. As a result, until full annual quality-adjusted data is available, the quarterly data is the best guide and suggests productivity remained much lower in 2022 than it was before the pandemic.  

How can governments improve public service productivity?

Institute for Government research has shown that there are no silver bullets to immediately increase public service productivity, but that there are several barriers to productive working that, if addressed, could lead to improved productivity in the longer-term.

  • Well-targeted capital investment in buildings and equipment can help staff operate more effectively. For example, in the NHS a shortage of scanners and outdated IT equipment has been found to prevent staff working as productively as they can.
  • Good management, and good management practices, are important to help large organisations like public service providers operate effectively. In the NHS, managerial roles have not kept pace with growing clinical staff numbers. The ONS is developing a new survey on management practices in public services. 
  • Retention of experienced staff and clear workforce planning. Experienced staff tend to do their jobs better than new hires. In prisons, a big cut in staff numbers during the 2010s led to the loss of many experienced staff. While staff numbers have now recovered, many are less experienced, and the service is not operating as effectively as a result. Long term workforce planning can ensure services avoid this mistake and retain the staff they need.

What commitments has the government made on public service productivity? 

While there was initially no fresh funding attached to the government’s target of 0.5% annual growth in public sector productivity, announced in the 2023 autumn statement, the spring budget saw the chancellor commit £3.4 billion in additional capital funding to deliver the NHS productivity plan, spread over three years from 2025/26. He also pledged a further £0.8bn over the same period to improve productivity in other public services. This includes £230 million for the police, including establishing a Centre for Police Productivity, and £170m for the justice system.

For the NHS, this is a substantial boost to capital investment. The £3.4bn allocated over the next three years equates to around 30% of this year’s £11bn Department for Health and Social Care capital spending budget. The increase for other public services is much lower, totalling around 0.8% of current annual capital spending. In both cases, however, the increases come on top of planned cuts to capital investment from 2025/26. The government has not yet said how capital spending will be allocated between departments from 2025/26 onwards, but the government plans to cut total capital spending by more than 2% a year in real terms over the following four years, even with the new funding. Total investment should also be seen in the context of large maintenance backlogs in public services, with the maintenance backlog currently £10.2bn in hospitals and £2.4bn for criminal courts and prisons. 

Alongside additional funding, the government has also commissioned the ONS to conduct a Public Services Productivity Review. This is intended to develop improved measures for public service productivity – including the new experimental measures discussed above. The new measures should reduce the lag time for productivity statistics and allow more accurate, quality-adjusted measurements of public service output as well as greater insight into time use and management practices in the public sector. The review was announced in June 2023, and is expected to run over two years. 

Related content

13 JUN 2023 Report

The NHS productivity puzzle

The NHS crisis will only be solved with capital investment, increasing management capacity and staff retention – not just more doctors and nurses.