Working to make government more effective

Comment

How the Civil Service has changed - in six charts

We look at the data.

The Office of National Statistics has published the latest Annual Civil Service Statistics data. Petr Bouchal and Gavin Freeguard look at what it tells us about the composition of the Civil Service.

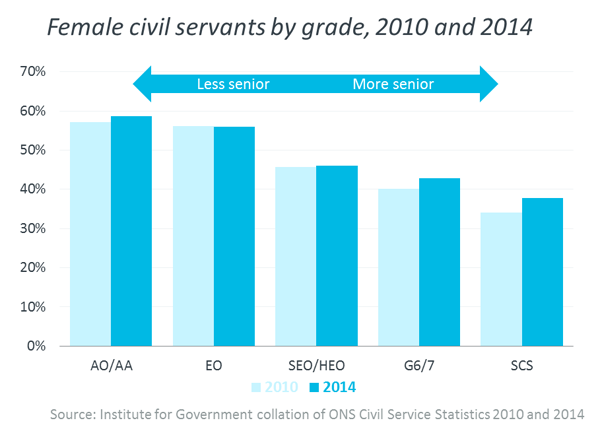
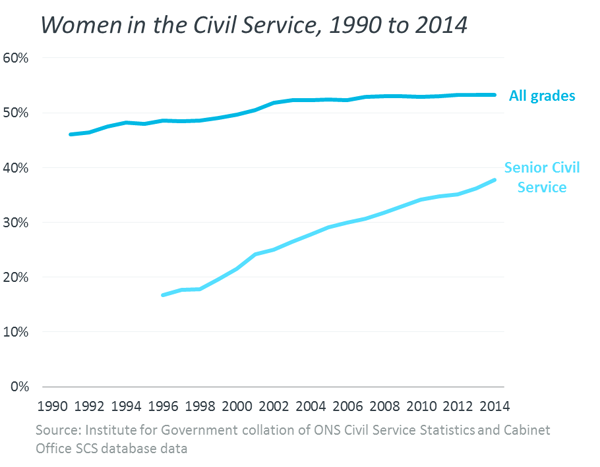
The past few weeks have seen increased attention to diversity in the Civil Service. The Cabinet Office published their Talent Action Plan and a report on talented women in Whitehall. In a speech at the Institute for Government, Michael Dugher, Labour’s Shadow Minister for the Cabinet Office, announced that the party would institute diversity targets if it is in government after next year’s general election. So what is the state of diversity in the Civil Service in 2014? Gender: the percentage of women in the Senior Civil Service has increased since 2010.

The Civil Service remains predominantly female overall (53%), but this is driven by the lower grades: 59% of civil servants in the lowest ranks are female, while in the Senior Civil Service this is only 38%.
The proportion of women in the Civil Service as a whole has been largely unchanged since 2007. The Senior Civil Service – which includes roughly 5000 senior officials – has seen a steady increase in the representation of women. In 1996, 17% of senior civil servants were women. This doubled to 34% by 2010 and has increased in every year since.
While this is still far from an equal share of women, the Senior Civil Service compares favourably to other parts of the economy, as the recent Hay Group report commissioned by Cabinet Office has shown. For example, the share of women in the Senior Civil Service is more than double that of FTSE 100 boards. Nevertheless, there are far fewer women in the very senior ranks of the Civil Service – only 22% of permanent secretaries are women. The latter is slightly lower than the share of female members of the Cabinet (24% after the last reshuffle) but is still much higher than the representation of women on the boards of FTSE 100 companies and among some senior public sector roles. Ethnic minority: the percentage of senior civil servants from an ethnic minority has increased, after a fall since 2010.
One in ten civil servants identifies as a member of an ethnic minority. This is slightly lower than the 14% of the population of the UK reported as being from an ethnic minority by the 2011 Census. But the gap is more pronounced in the Senior Civil Service, where 7% of staff come from ethnic minorities. Nonetheless, we have seen a continuing increase in the percentage of ethnic minority staff in the Civil Service as a whole and in the Senior Civil Service. There was a marked increase in the latter since last year, which more than outweighed the drop in 2013. Disability: the percentage of civil servants with a disability has increased overall, but is at a similar level to 2010 in the Senior Civil Service.
About 9% of civil servants described themselves as having a disability. In the Senior Civil Service, this was 5%. As with other diversity measures, the Civil Service as a whole has seen a sustained increase in the percentage of staff with a disability, which has continued since 2010 and last year. In the Senior Civil Service, the proportion of disabled staff has increased over the long term, but is at a similar level to 2010 (although the proportion of disabled senior staff has increased since 2013). Age: the Civil Service has been getting older, on average.
In 2014, the median age in the Civil Service is 46 years, up from 44 in 2010. 39% of civil servants are aged over 50. In the last year, the proportion of civil servants in each of the age bands below 50 dropped, while it rose in the 50+ bands. This is a continuation of a trend: while in 2010 67% of civil servants were aged under 50, in 2014 it is 61%, with the share of the 50-59 band increasing most sharply. There have clearly been conscious efforts to make the Civil Service more representative in terms of gender, ethnicity and disability. We have also seen significant change in the age composition of the Civil Service – but this is not the result of deliberate attempts to do so. In short, then, the Civil Service is continuing its long-term trend towards more diversity in terms of gender, ethnic identity, and disability, both overall and at senior levels. But it has also been getting older, and women and minority ethnic staff are still poorly represented at very senior levels. All this is happening against the backdrop of significant downsizing: the Civil Service has shrunk by some 19% since the 2010 Spending Review. We will return to this data to look at the geographical spread of the Civil Service (we previously analysed this as part of our devolution Whitehall Monitor).

Related content