Working to make government more effective

Comment

Better delivery?

Analysis of the Major Projects Authority report.

Two weeks ago the Government’s Major Projects Authority published its second assessment of the state of its project portfolio. It provides a welcome increase in transparency, and allows us to assess whether the Government can bring in projects on time and on budget.

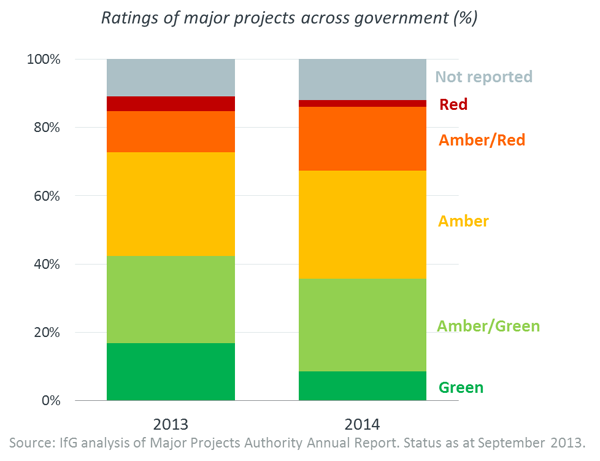
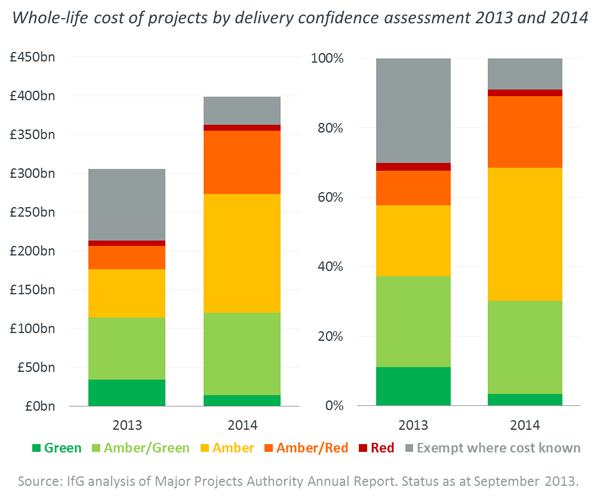
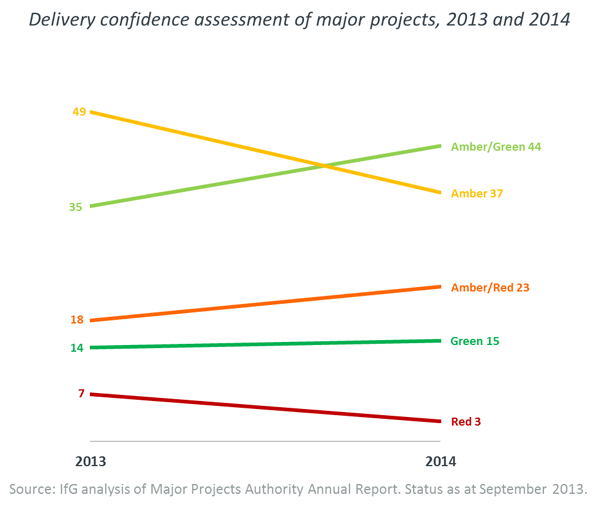
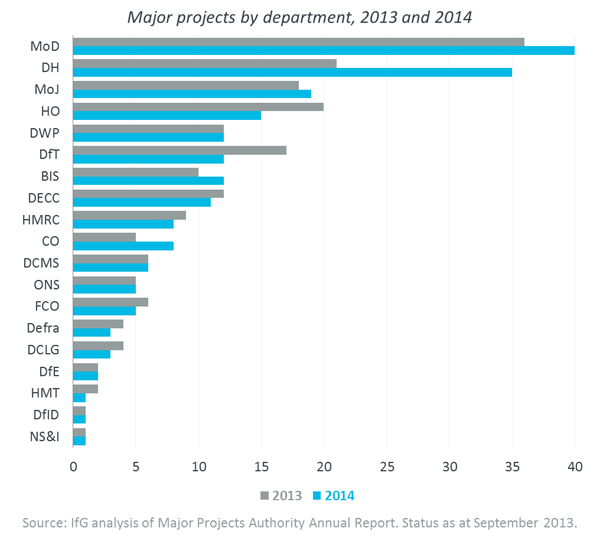
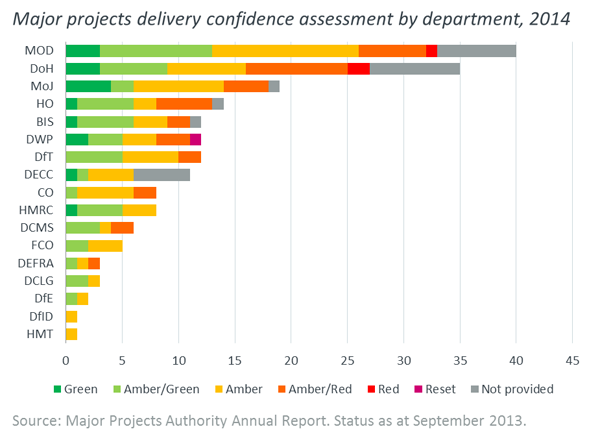
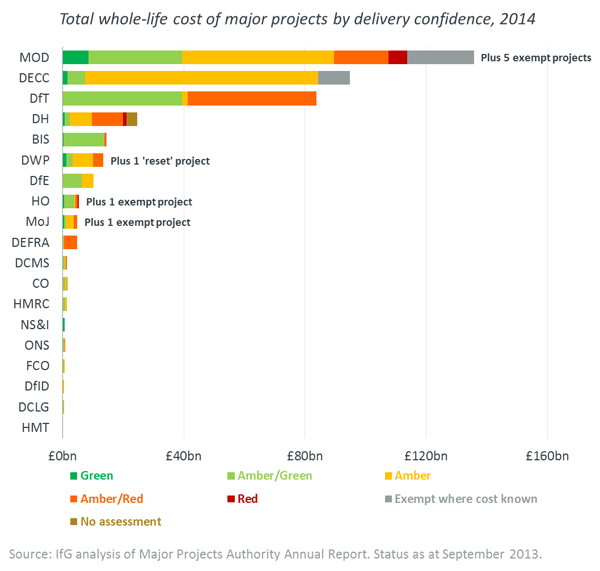
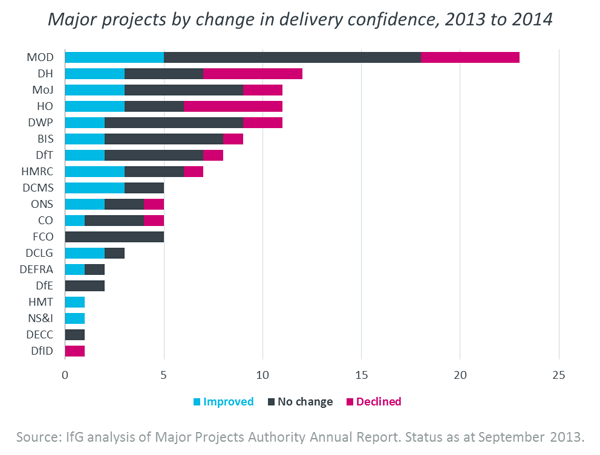
What is the Major Projects Authority? The Major Projects Authority (MPA) was established in March 2011 to improve the delivery of major government projects, ranging from reforms like automatic enrolment into workplace pensions, to internal departmental change programmes like shared service centres, and large infrastructure projects like Thameslink. The MPA provides challenge and support to the projects included in the portfolio and publishes the cost, timescales, and delivery confidence assessments of these projects in the form of a Red-Amber-Green (RAG) scheme. Its latest report assesses projects up to 30 September 2013. Below we set out the picture it offers of progress – or lack of it. A bigger portfolio The portfolio has grown somewhat in the last year: the 2013 annual report included 191 projects, while this year’s has 199. This reflects the inclusion of 47 additional projects in the portfolio and the exit of 39 projects from the portfolio. Of these 39 projects, some were completed, some moved into business-as-usual phase, some were halted, and others are now reported as parts of other projects. Those projects have a whole-life cost of £488bn. More, new projects mean less confidence Between 2013 and 2014, the portfolio has shifted toward lower confidence assessments, with an increase in the proportion of amber and amber/red projects. This is largely because of the projects newly included in the portfolio, which are further away from completion and therefore have lower rankings. Roughly 35% of all projects are rated green or amber-green, which is a decrease of 8% from the previous year.

Looking at the whole-life cost of projects in the portfolio (where known), we can similarly see both an increase in overall cost and a decrease in the proportion of green/amber-green projects and an increase in red/amber-red projects.
There is (slightly) increasing confidence in the delivery of existing projects To get a better sense of change, we looked at all projects whose rating was published in both years. More projects have improved (32) than have declined (27) but the majority of these projects (64) stayed at the same rating.
With some big exceptions, where we just don’t know We have already pointed out that the big DWP Universal Credit programme has slipped into its own special reset category, with no RAG rating and no information on whole-life costs. Additionally, some projects in the Department of Health (DH) portfolio whose ratings were published last year have not been assessed this year. The report notes that because these projects are not delivered directly by DH, the MPA does not provide assurance for them and therefore does not provide a confidence rating. Finally, a number of projects were rated but the ratings were not made public, and no information was provided on the whole-life cost of some projects, most often due to commercial prejudice concerns. But the continued withholding of some information could undermine a transparency effort designed to build public trust in the ability of government to deliver large-scale programmes. In particular, the decision not to provide meaningful information on Universal Credit and the liberal use of confidentiality exemptions could lead the public to assume that uncomfortable news is deliberately not being disclosed. Departmental portfolios vary in size While MoD currently manages 40 major projects, the majority of departments manage fewer than 10; over 60% of the projects are managed by one of the five departments with largest portfolios (MoD, DH, MoJ, HO, and DWP). This pattern has changed relatively little between 2013 and 2014. The exceptions are DH, whose portfolio grew from 21 to 35 projects, and the Department for Transport and Home Office, both of which saw their project portfolios shrink by about a third as their projects left the portfolio, mostly because they were completed.
Projects with different ratings are distributed relatively evenly across departments As for the whole-life costs of the various major projects, more than 75% of the total cost of the major projects portfolio is managed by MoD, DECC, and DfT. (This does not include projects for which information on whole-life costs is not publically available).
The majority of this projected cost comes from projects with relatively lower confidence ratings; as the MPA report notes, this is unsurprising because projects with higher total costs are more complex and face longer timescales.
Most departments have seen an overall improvement in ratings on the projects in their portfolios To assess change between the years in a meaningful way, we looked at how ratings have changed in departments, counting only projects with public ratings in both years. 10 departments saw overall improvement in their portfolio (more projects improved than declined), 6 saw no change, and 4 departments (DfID, DfT, DH, and Home Office) saw more project ratings decline than improve between 2013 and 2014.
This is based on our analysis of this year’s and last year’s data. In order to understand how ratings for individual projects have changed, we have had to make some guesses where projects changed names from one year to the next, for instance due to changes in the scope of the project. As a result, some of our figures differ slightly from those in the MPA’s report – for example, we found more projects with improved ratings than the MPA’s report states. If the MPA decides to release data with both years’ ratings for projects that have remained in the portfolio, we will be able to refine our analysis in a follow-up post here. The Major Projects Authority’s second annual report is encouraging in that it provides a comprehensive picture of the government’s work. With the exception of Universal Credit, ratings have been published even where the news is not unambiguously positive, and the report provides useful explanation and context.

Related content