Working to make government more effective

Comment

Minding their PQs

Written parliamentary questions under the Coalition Government.

If MPs don’t get the opportunity to ask questions of ministers in the House of Commons, they can write to them – and the department has to answer, in a timely fashion. Just how many of these questions do departments have to deal with and how promptly do they respond? Emily Andrews looks at the numbers.

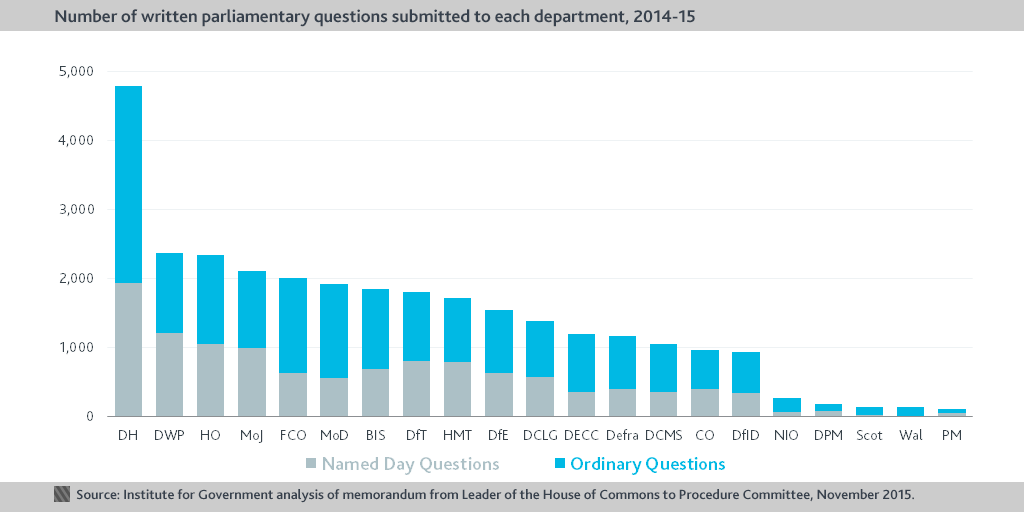
Parliament holds government to account by asking questions: in select committee rooms, in the House of Commons, or in writing. Written parliamentary questions (PQs) help MPs to understand what departments are doing, and force the minister (and the staff of the department) to defend their decisions. Members of the public can now view questions and answers online, after a new electronic system replaced ‘hard copy’ publication last year. This gives us real-time data about individual questions, but not as much detail as the Leader of the House’s annual memo to the Commons Procedure Committee, which is our source of data for these charts. PQs place a burden of work on the departments. During the 2014–15 Parliamentary session, departments received 30,172 written questions; all of which needed to be answered accurately, within a working week (ordinary questions) or according to a timeframe dictated by the MP (named day questions). The Department of Health receives by far the most parliamentary questions

In 2014–15, DH received 4,782 written questions – more than twice as many as DWP, which received the next largest number (2,359). DH consistently received more than 30 written questions per sitting day during the last Parliament. The territorial departments are at the other end of the spectrum – presumably because questions regarding particular national matters are directed towards the devolved institutions. Almost all departments received fewer PQs at the end of the Parliament than at the beginning.
Only DH and FCO received more written questions per sitting day at the end of the Parliament than they did at the beginning (36 at DH, up from 34; 15 at FCO, up from 14). These were also the only two departments who received more requests in 2014–15 than in the previous year. Most departments received consistent numbers of questions across the last Parliament. DCLG and HO both saw a big drop between 2009–10 and 2010–12 (a longer parliamentary session, due to the 2010 election), while BIS and DfE both had peaks in requests in 2010–12. Indeed, all but five departments (DWP, BIS, DfE, Defra and the Scotland Office (Scot)) saw an immediate drop in the number of Parliamentary questions they received between 2009–10 and 2010–12, when the Labour government was replaced by the Coalition. Now that we have a small Conservative majority, with more MPs in opposition, it will be interesting to see if numbers rise again. In 2014–15, the Home Office answered only half their PQs on time. Most departments do much better.
A rise in the number of questions would put pressure on the departments who have to put resources into answering them. Most departments answered at least 80% of their written questions on time in 2014–15. At DH, which has the highest number of questions to answer, 99% were answered on time. The Home Office answered only 54% of questions on time over the course of the year, although it claims to have answered at least 80% of questions on time in the last four months of the Parliamentary session. At BIS, 37 questions went unanswered (2% of their total) and seven went unanswered at DECC (1% of their total), with no explanation provided in the memo. One question was left unanswered at DWP, because it had been misallocated by the Table Office (which assists MPs in tabling parliamentary questions (PQs): presumably, Jim Murphy did not intend to ask Iain Duncan Smith about the use of ketamine in the developing world. As neither FCO nor DfID would take responsibility for the question, it remained unanswered.
Most departments improved over the Parliament, but five (Scot, MoJ, DECC, DCLG, HO) did not, answering fewer questions on time in 2014–15 than in 2010–12. MoJ answered 74% of questions on time in 2014–15: a drop from 94% in 2010–12, but an improvement on 2013–14, when they answered only 28% on time. DfT and DfE also saw dramatic improvements in that time: between 2012–13 and 2013–14, DfE’s on-time response rate leapt from 23% to 92%. You can read more about departments’ responses to different requests for information (including freedom of information (FOI) requests and parliamentary correspondence) in our Whitehall Monitor 2015.      

Abbreviations for government departments can be found here.

Related content

21 MAR 2024 Analysis paper

Hung parliaments

Rules governing unclear general election results are loosely defined in the UK.