Explainer
Hospitals - 10 Key Facts

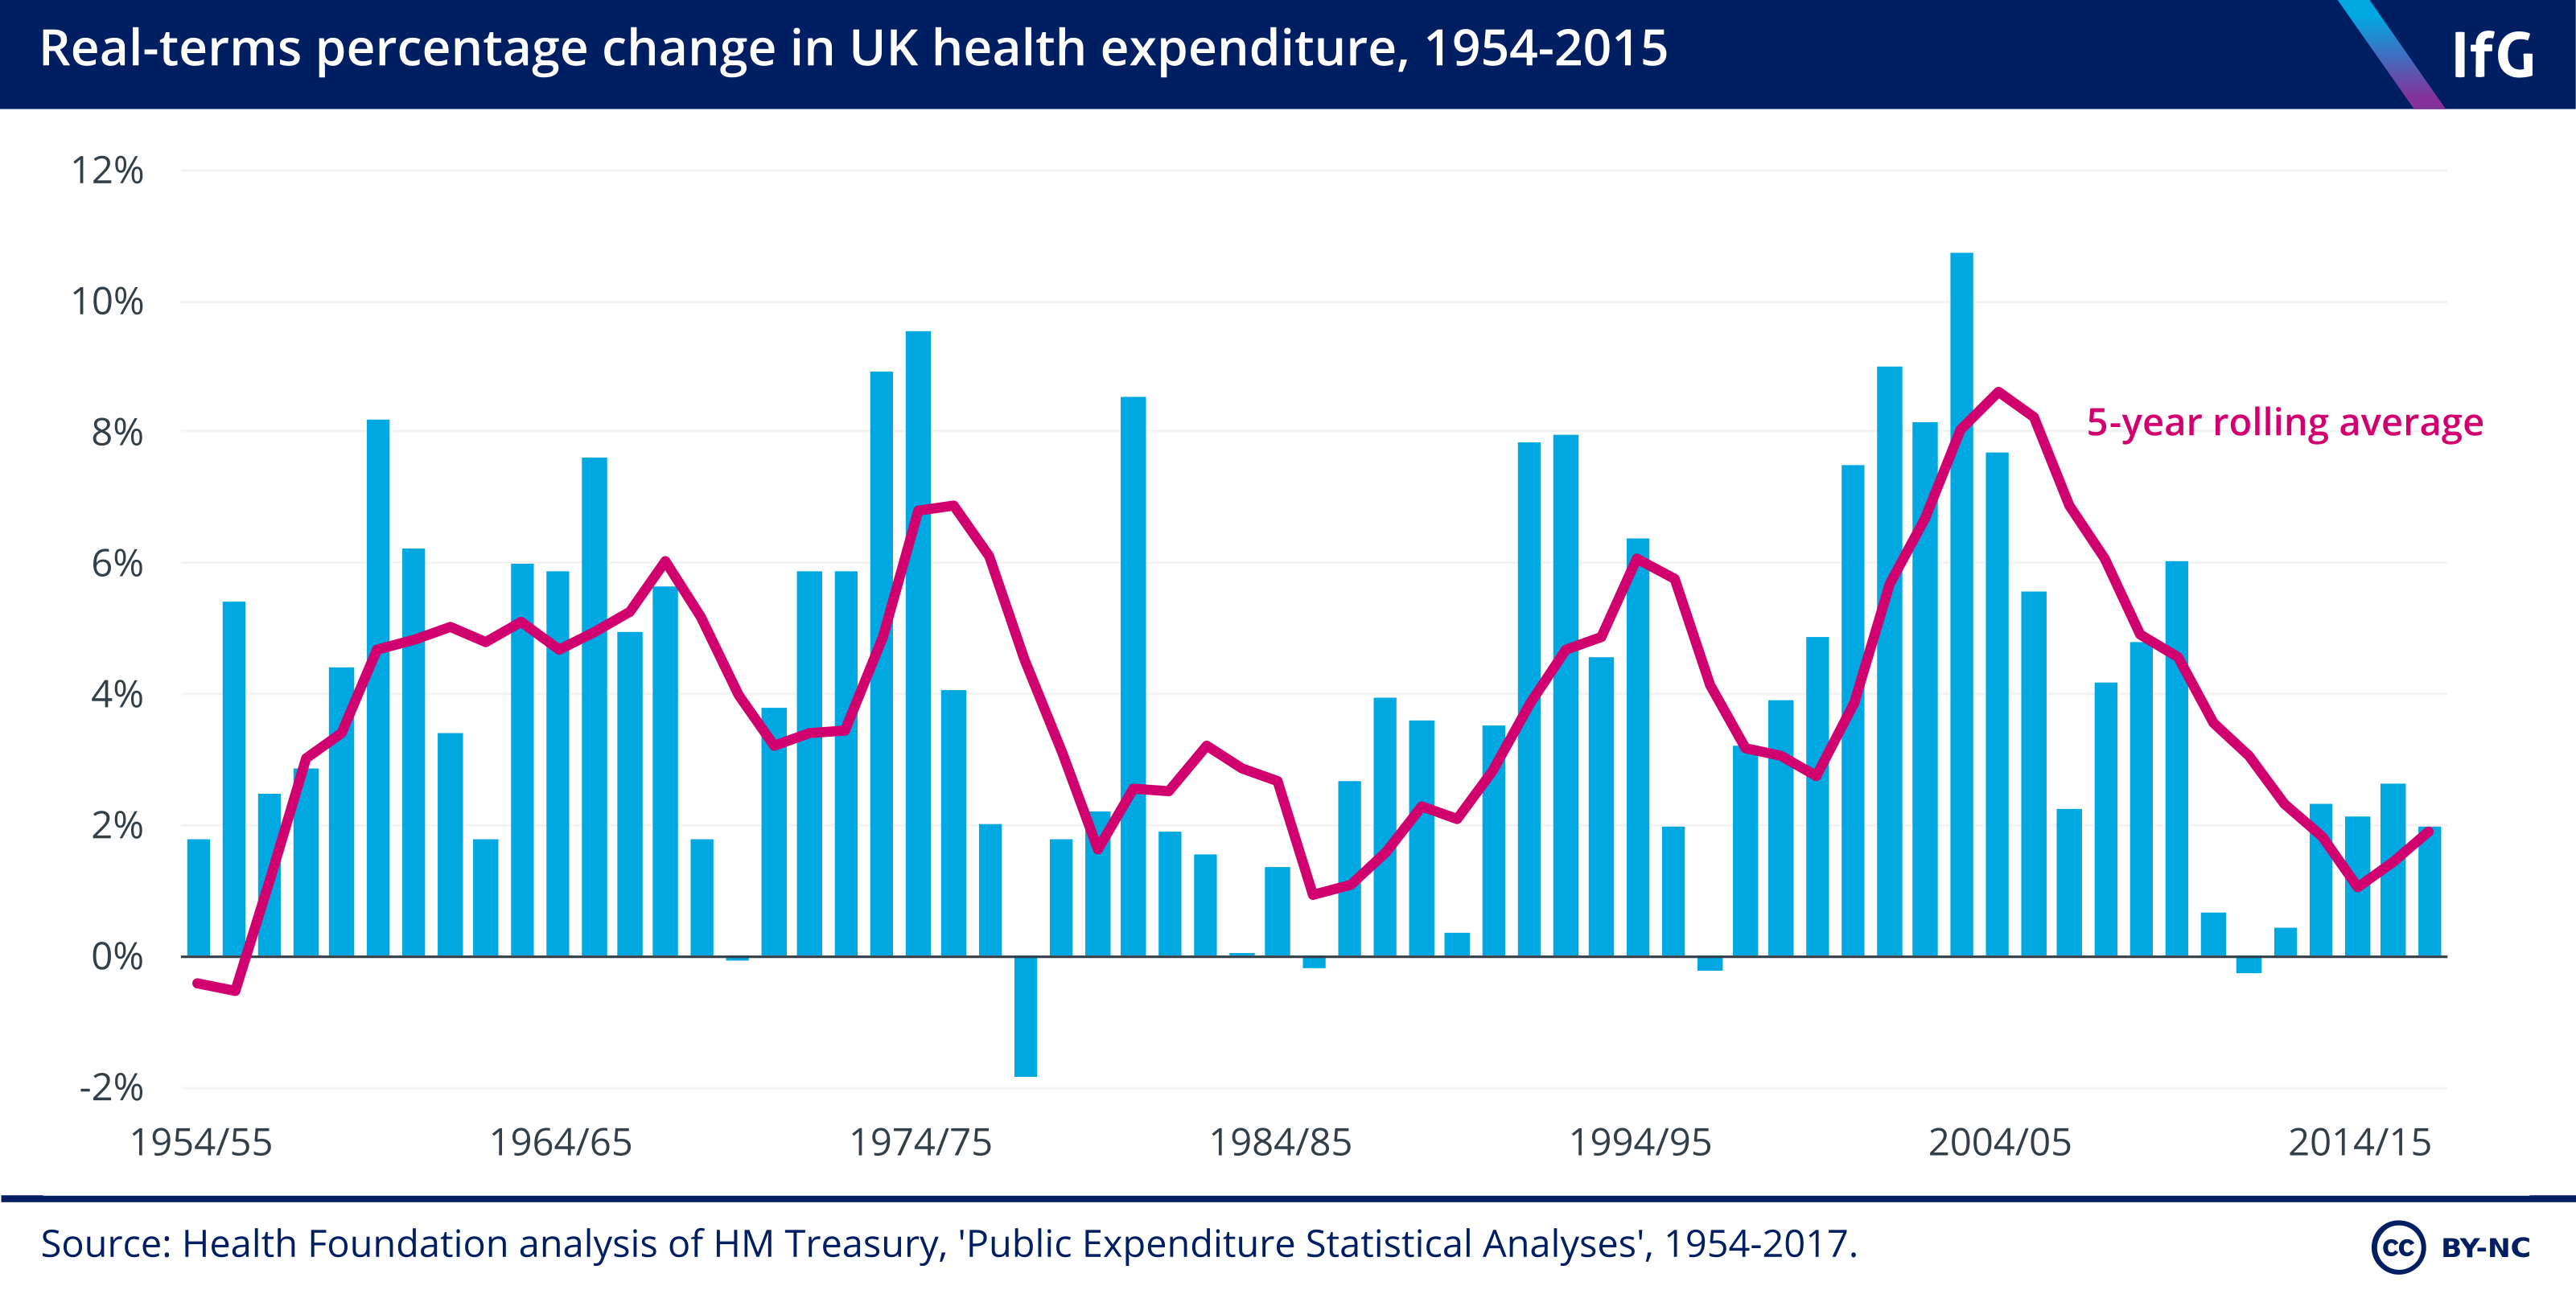
- Spending growth under the Coalition averaged 1.1%, increasing to 2.3% between 2014/15 and 2017/18. The average annual increase in NHS spending since 1948 has been 3.7%.
- The new funding settlement means spending start to rise faster, but still slower than the previous average annual increase. The extra money announced in 2018 represents a 3.4% annual spending increase 2023/24.
2. Spending on hospitals has risen by around 15% since 2009/10.

- Spending on NHS providers (which include hospitals, mental health trusts and community trusts) has increased by around 15% since 2009/10, although this spending growth has slowed recently.
- Staff costs make up the majority of NHS providers’ expenditure. In 2018, £52.0bn of the total £82.4bn (63.1%) of their spending was on staff.
3. Hospitals routinely overspend their budgets.

- NHS providers have been in deficit since 2013/14. The £1.8bn ‘Sustainable Transformation Fund’ introduced in 2016/17 – which plugged gaps in hospital finances rather than supporting the transformation of services – reduced the deficit to £0.79bn that year, but it increased again to £0.96bn in 2017/18.
4. Staff numbers in hospitals are actually rising.
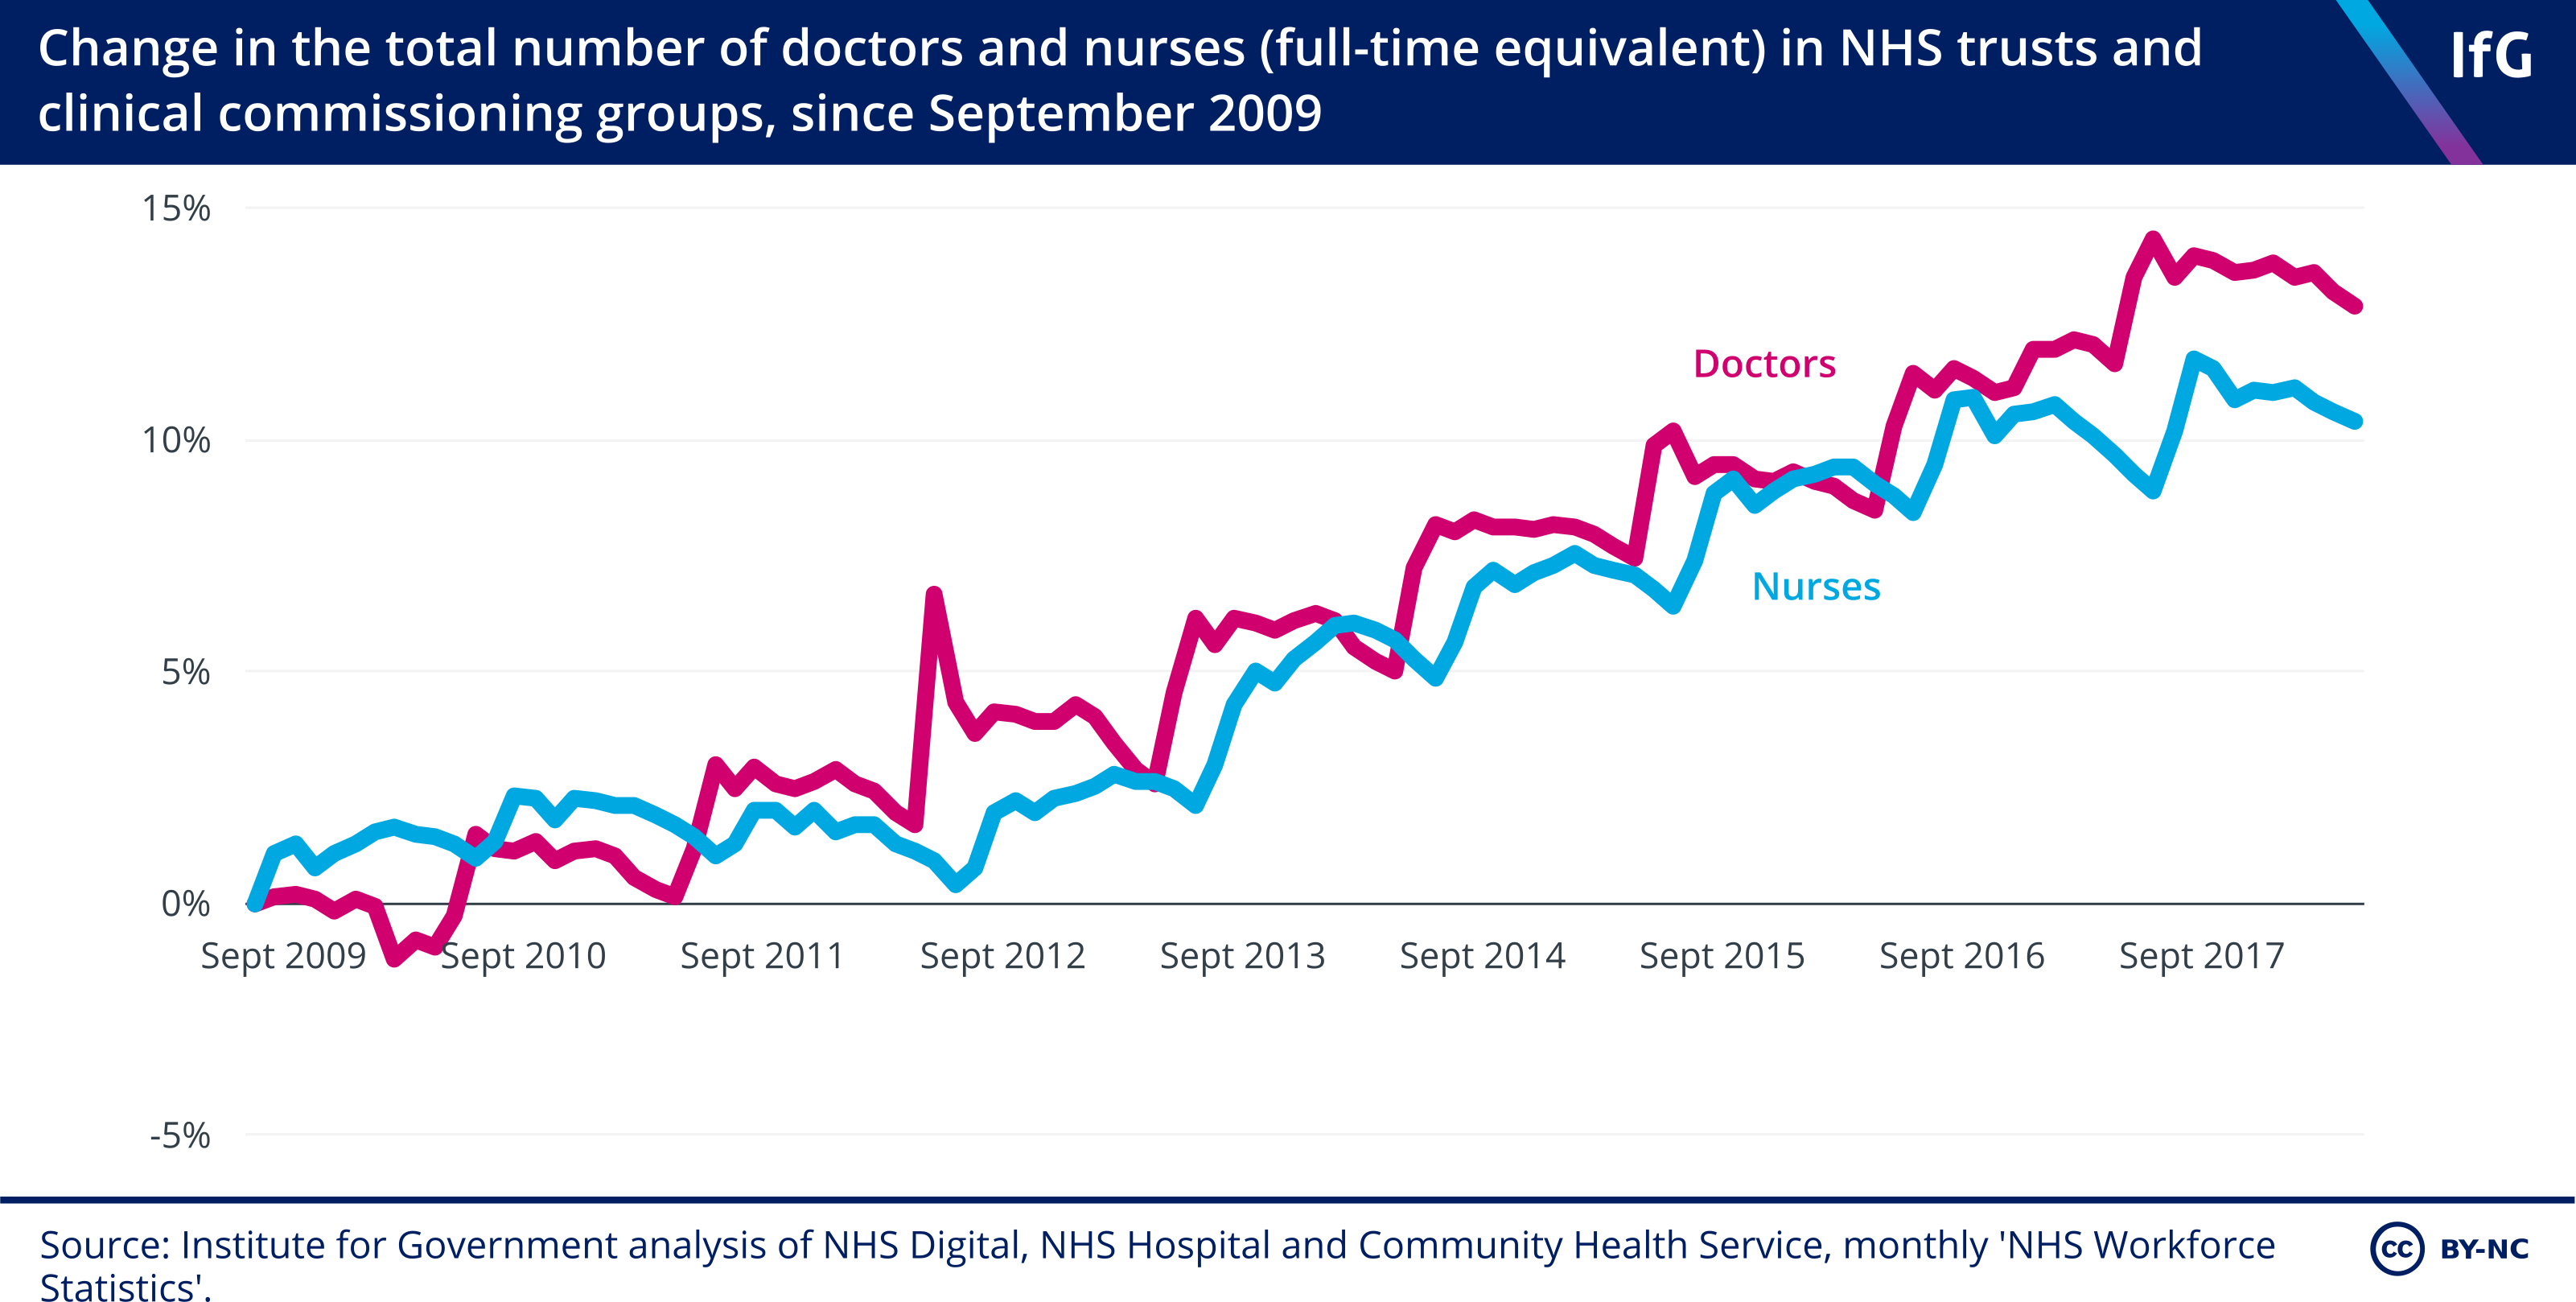
- There was a 6% increase in the hospital and community health services workforce between 2009 and 2018.
- The number of doctors and nurses are rising faster than the overall hospital workforce. The number of doctors and nurses increased by 13.2% and 10.6% respectively, faster than the increase in non-clinical staff.
5. But there still aren't enough staff.
- Alongside the rise in the number of staff, vacancies are also rising. Full-time equivalent vacancies within acute trusts increased by 12% between 2015 and 2017 (from 53,236 between July and September 2015 to 59,609 between July and September 2017).
6. Staff are increasingly leaving the NHS because of their workload.
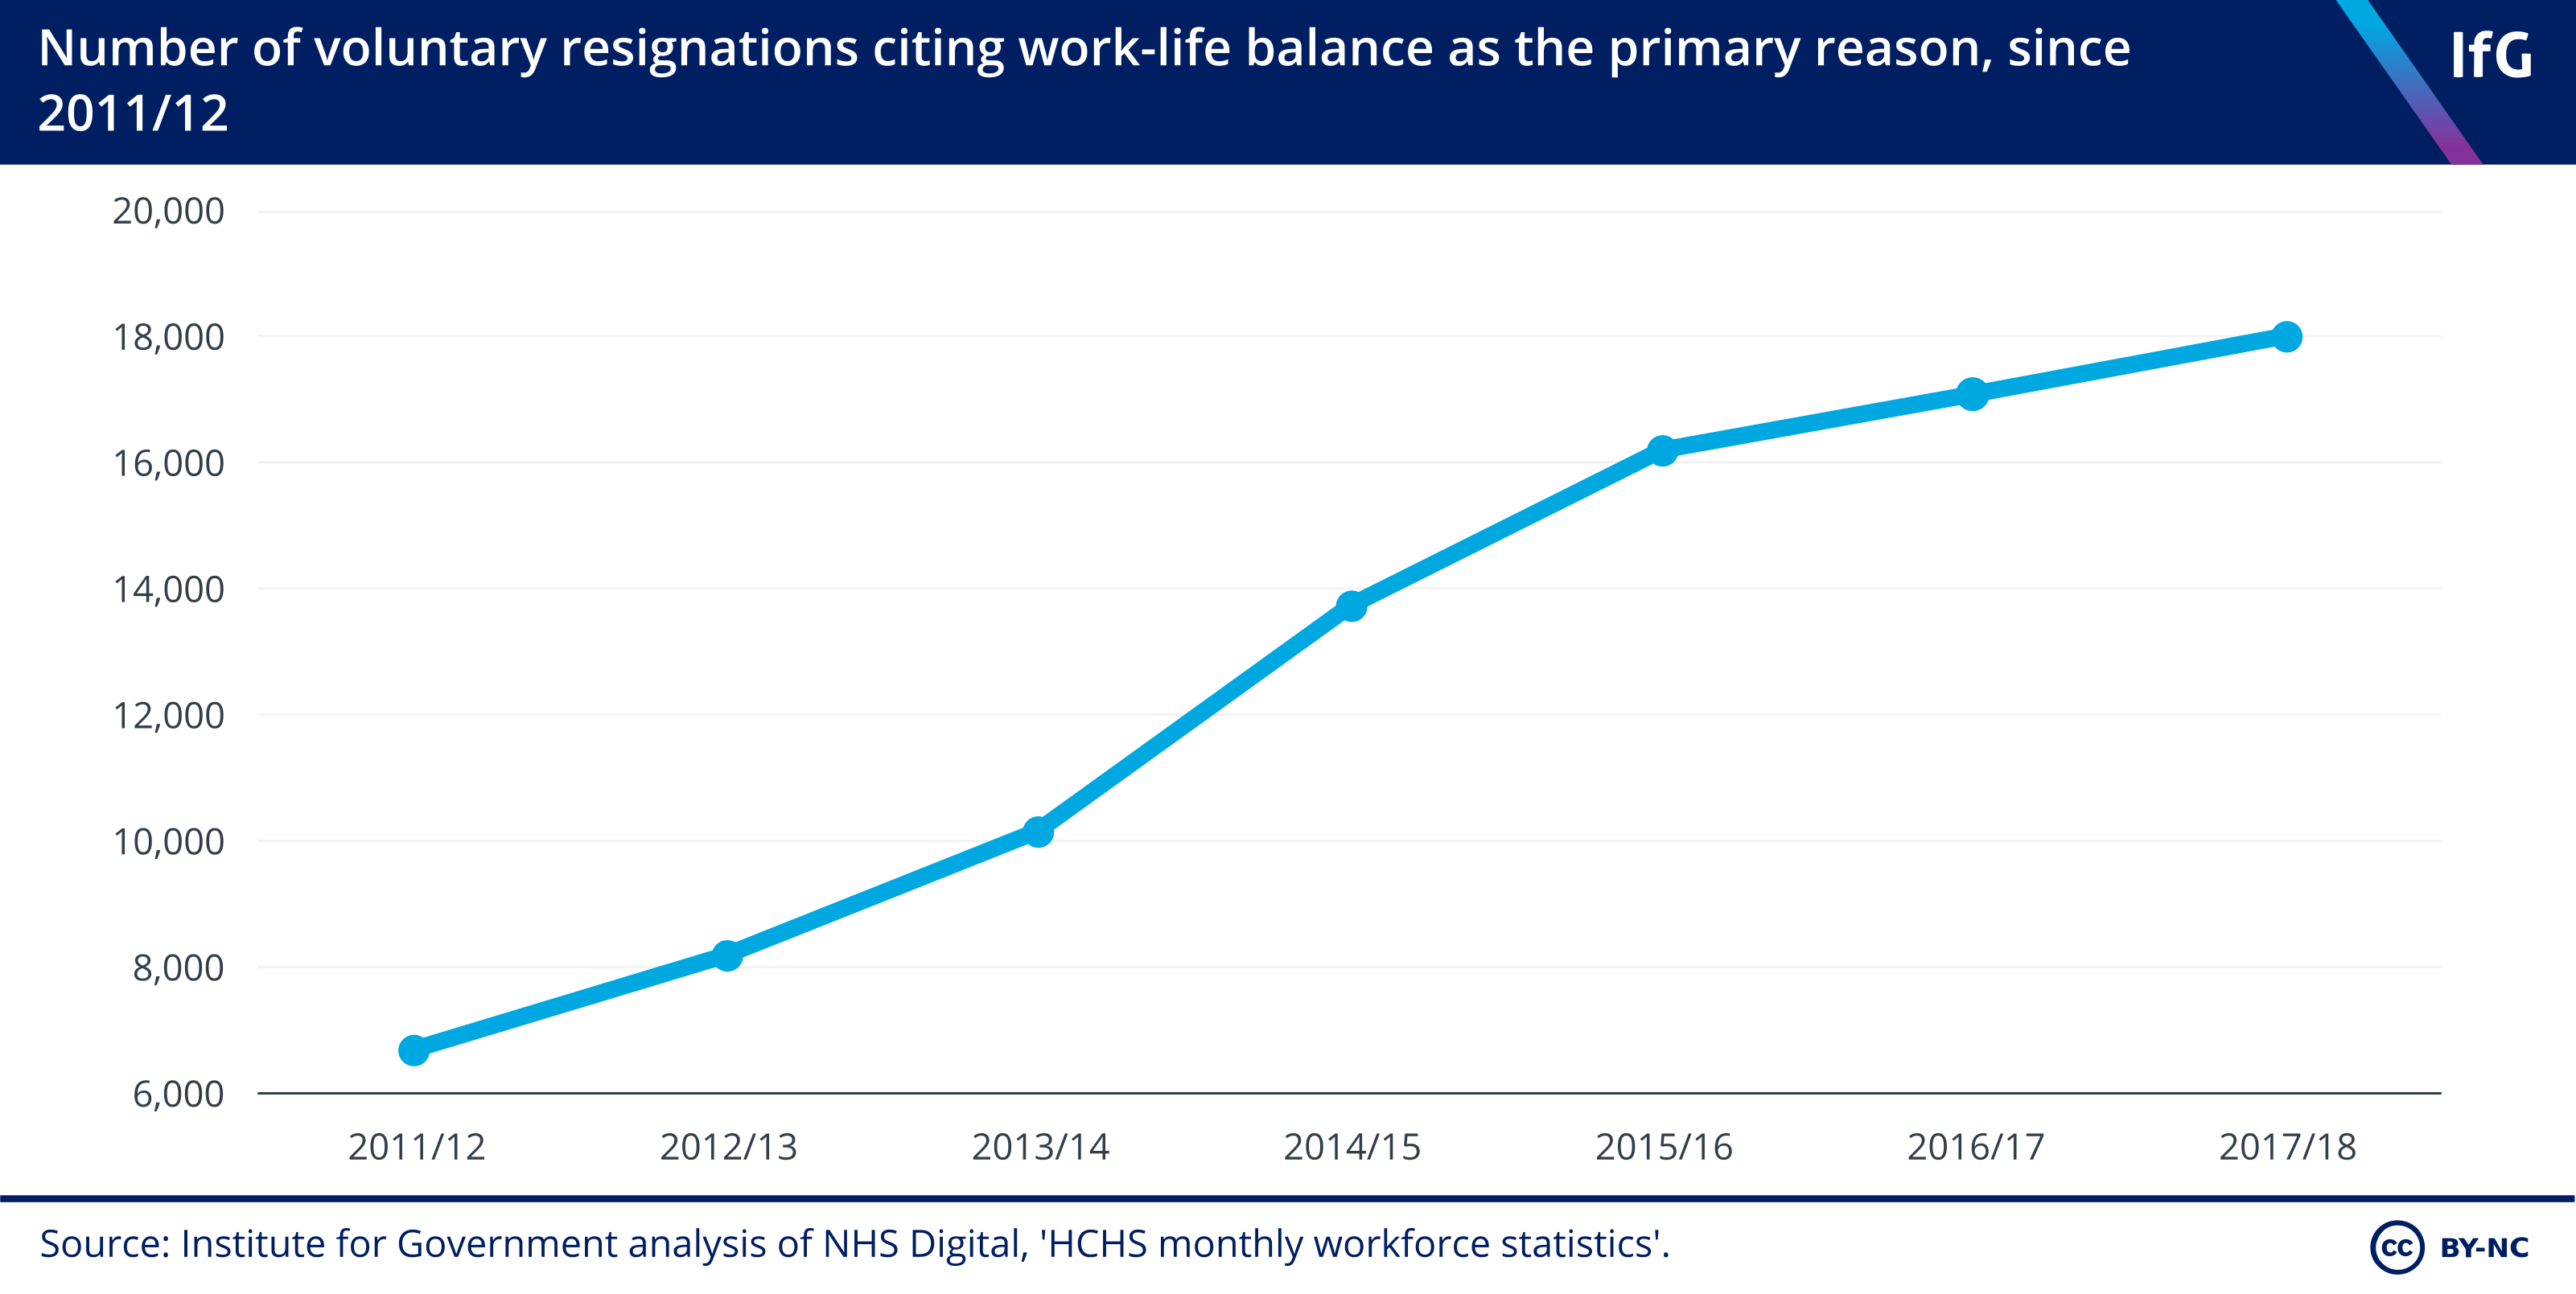
- Between 2011/12 and 2017/18, voluntary resignations from the NHS rose from 74,285 to 114,870, and those citing work-life balance as the primary reason for leaving almost tripled.
7. More people are being admitted to hospitals, with both elective and non-elective admissions increasing by 20% since 2009/10.
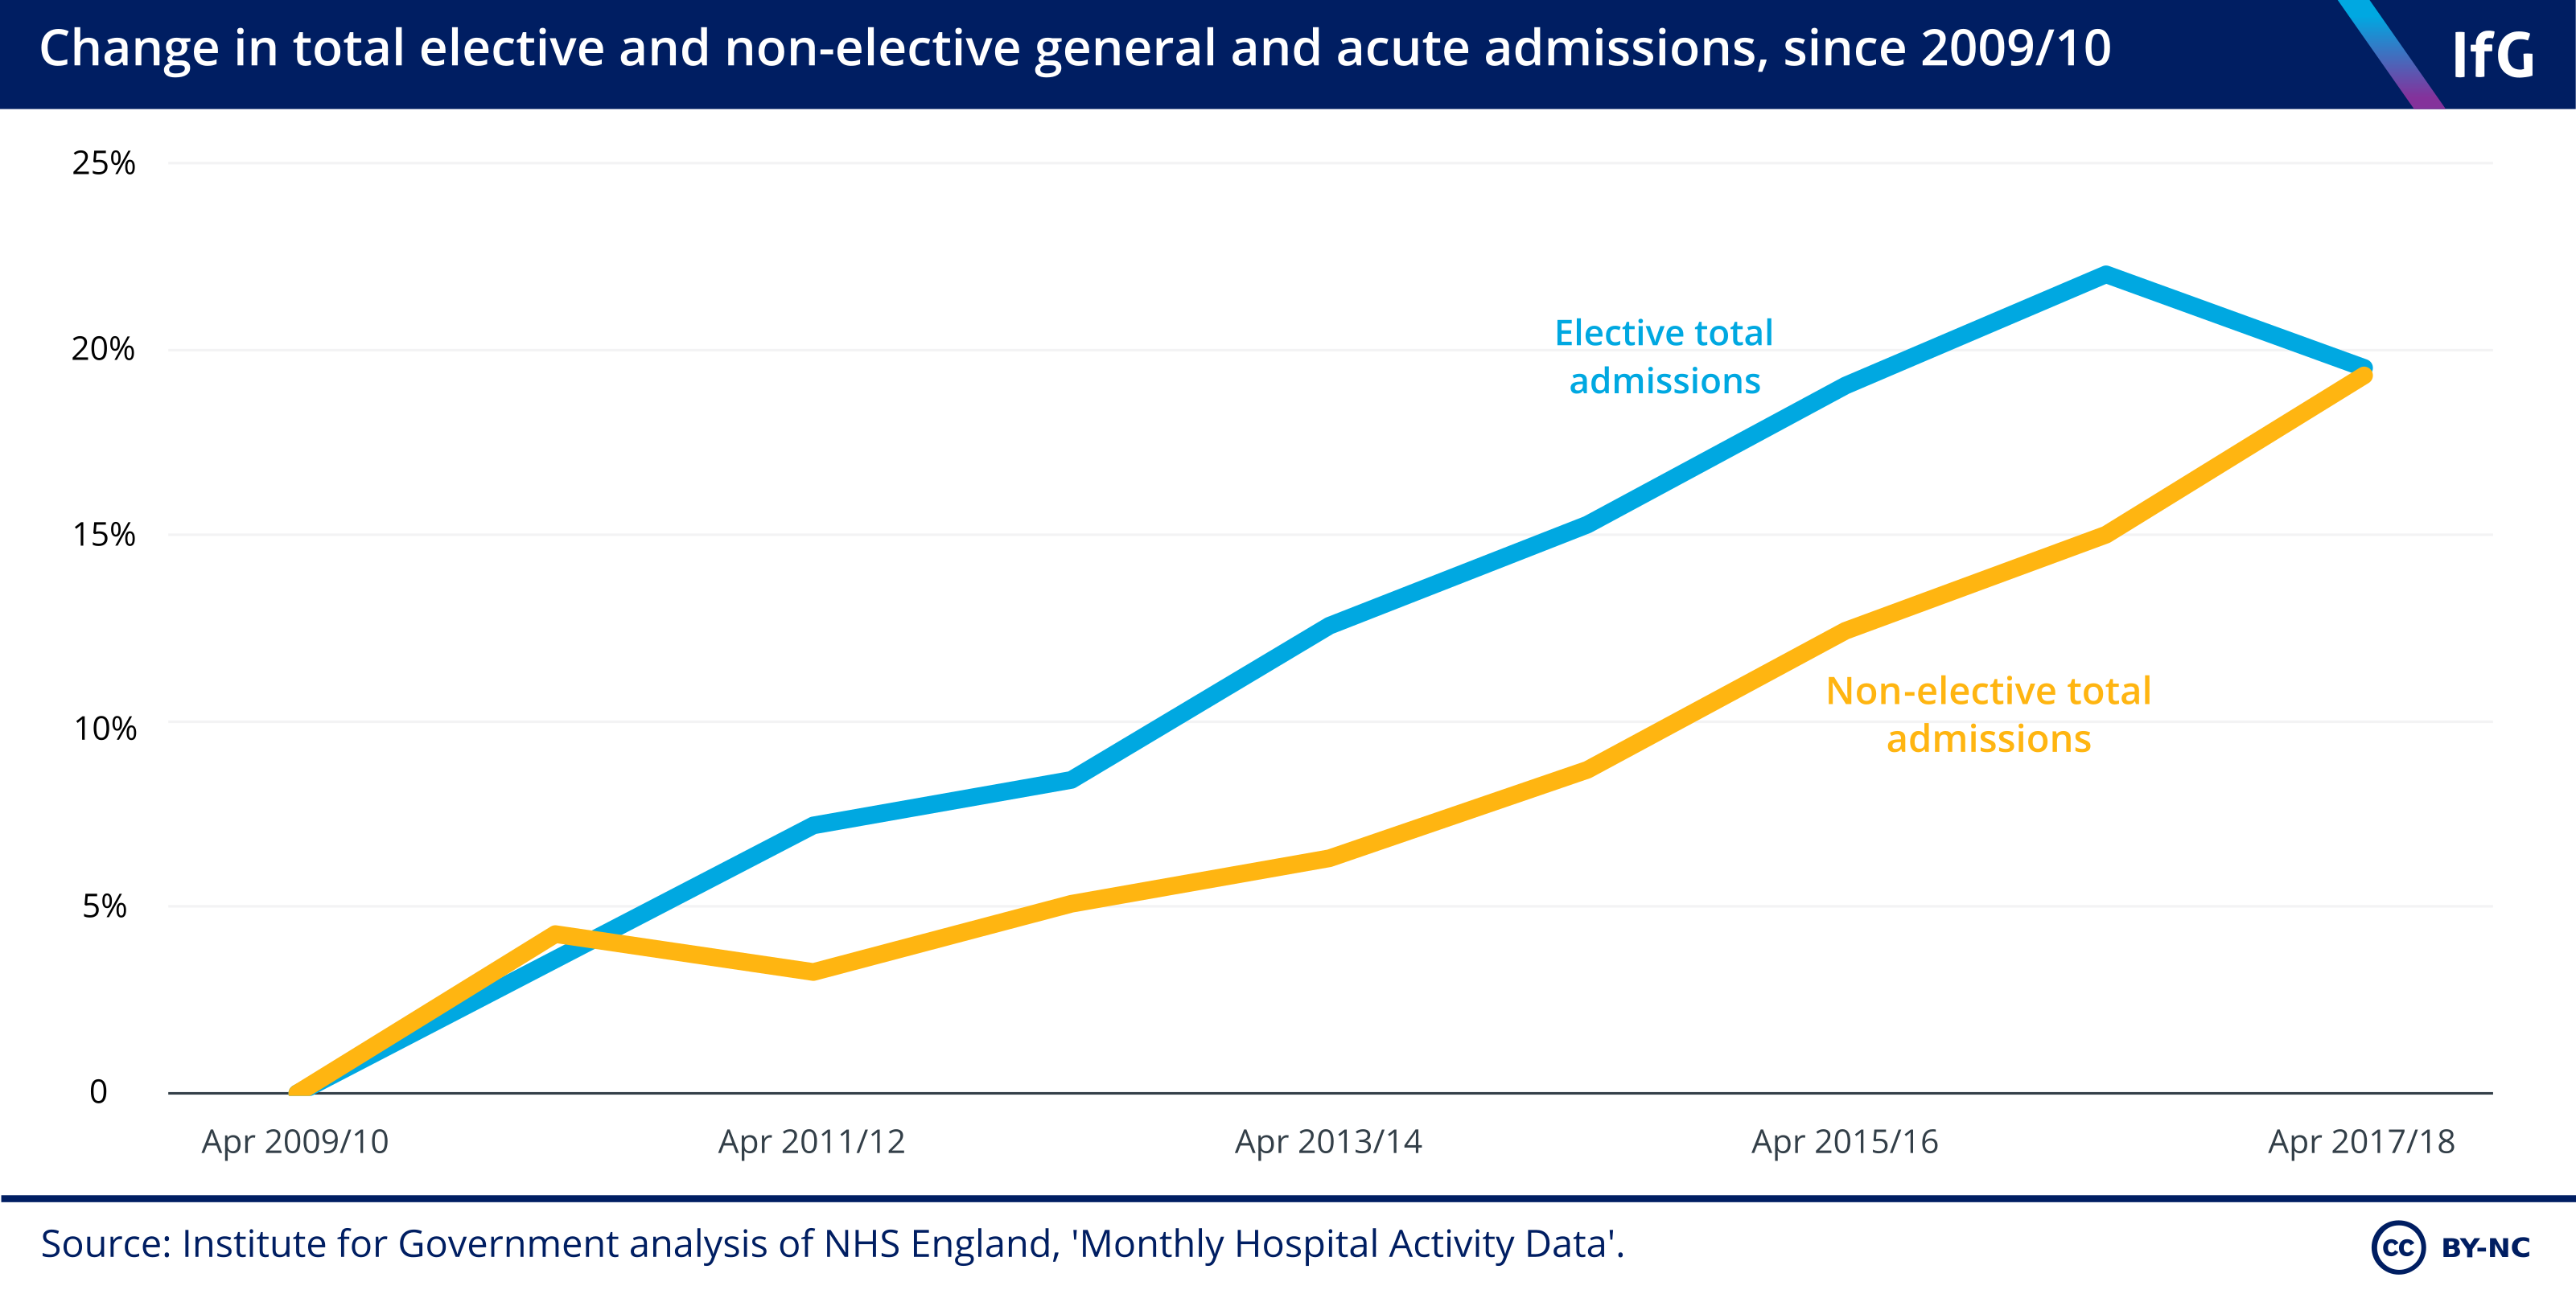
- Hospital admissions have increased sharply. Since 2009/10, elective admissions (where patients are admitted for a planned procedure on a specific date) have increased to just over 8.2m a year, and non-elective admissions (usually emergency admissions, but also includes maternity admissions) have increased to just over 6.2m a year.
- The number of emergency admissions has risen rapidly. The number of people admitted to hospital via A&E for type 1 emergency admissions rose from 3.36m in 2009/10 to 4.4m in 2017/18.
- Hospitals are carrying out more appointments and tests. In the same period, the number of outpatient appointments rose by 41.8% and the number of diagnostic tests rose by over 50%.
8. Even under pressure, the number of hospital infections fell by around 50% between 2009/10 and 2017/18.
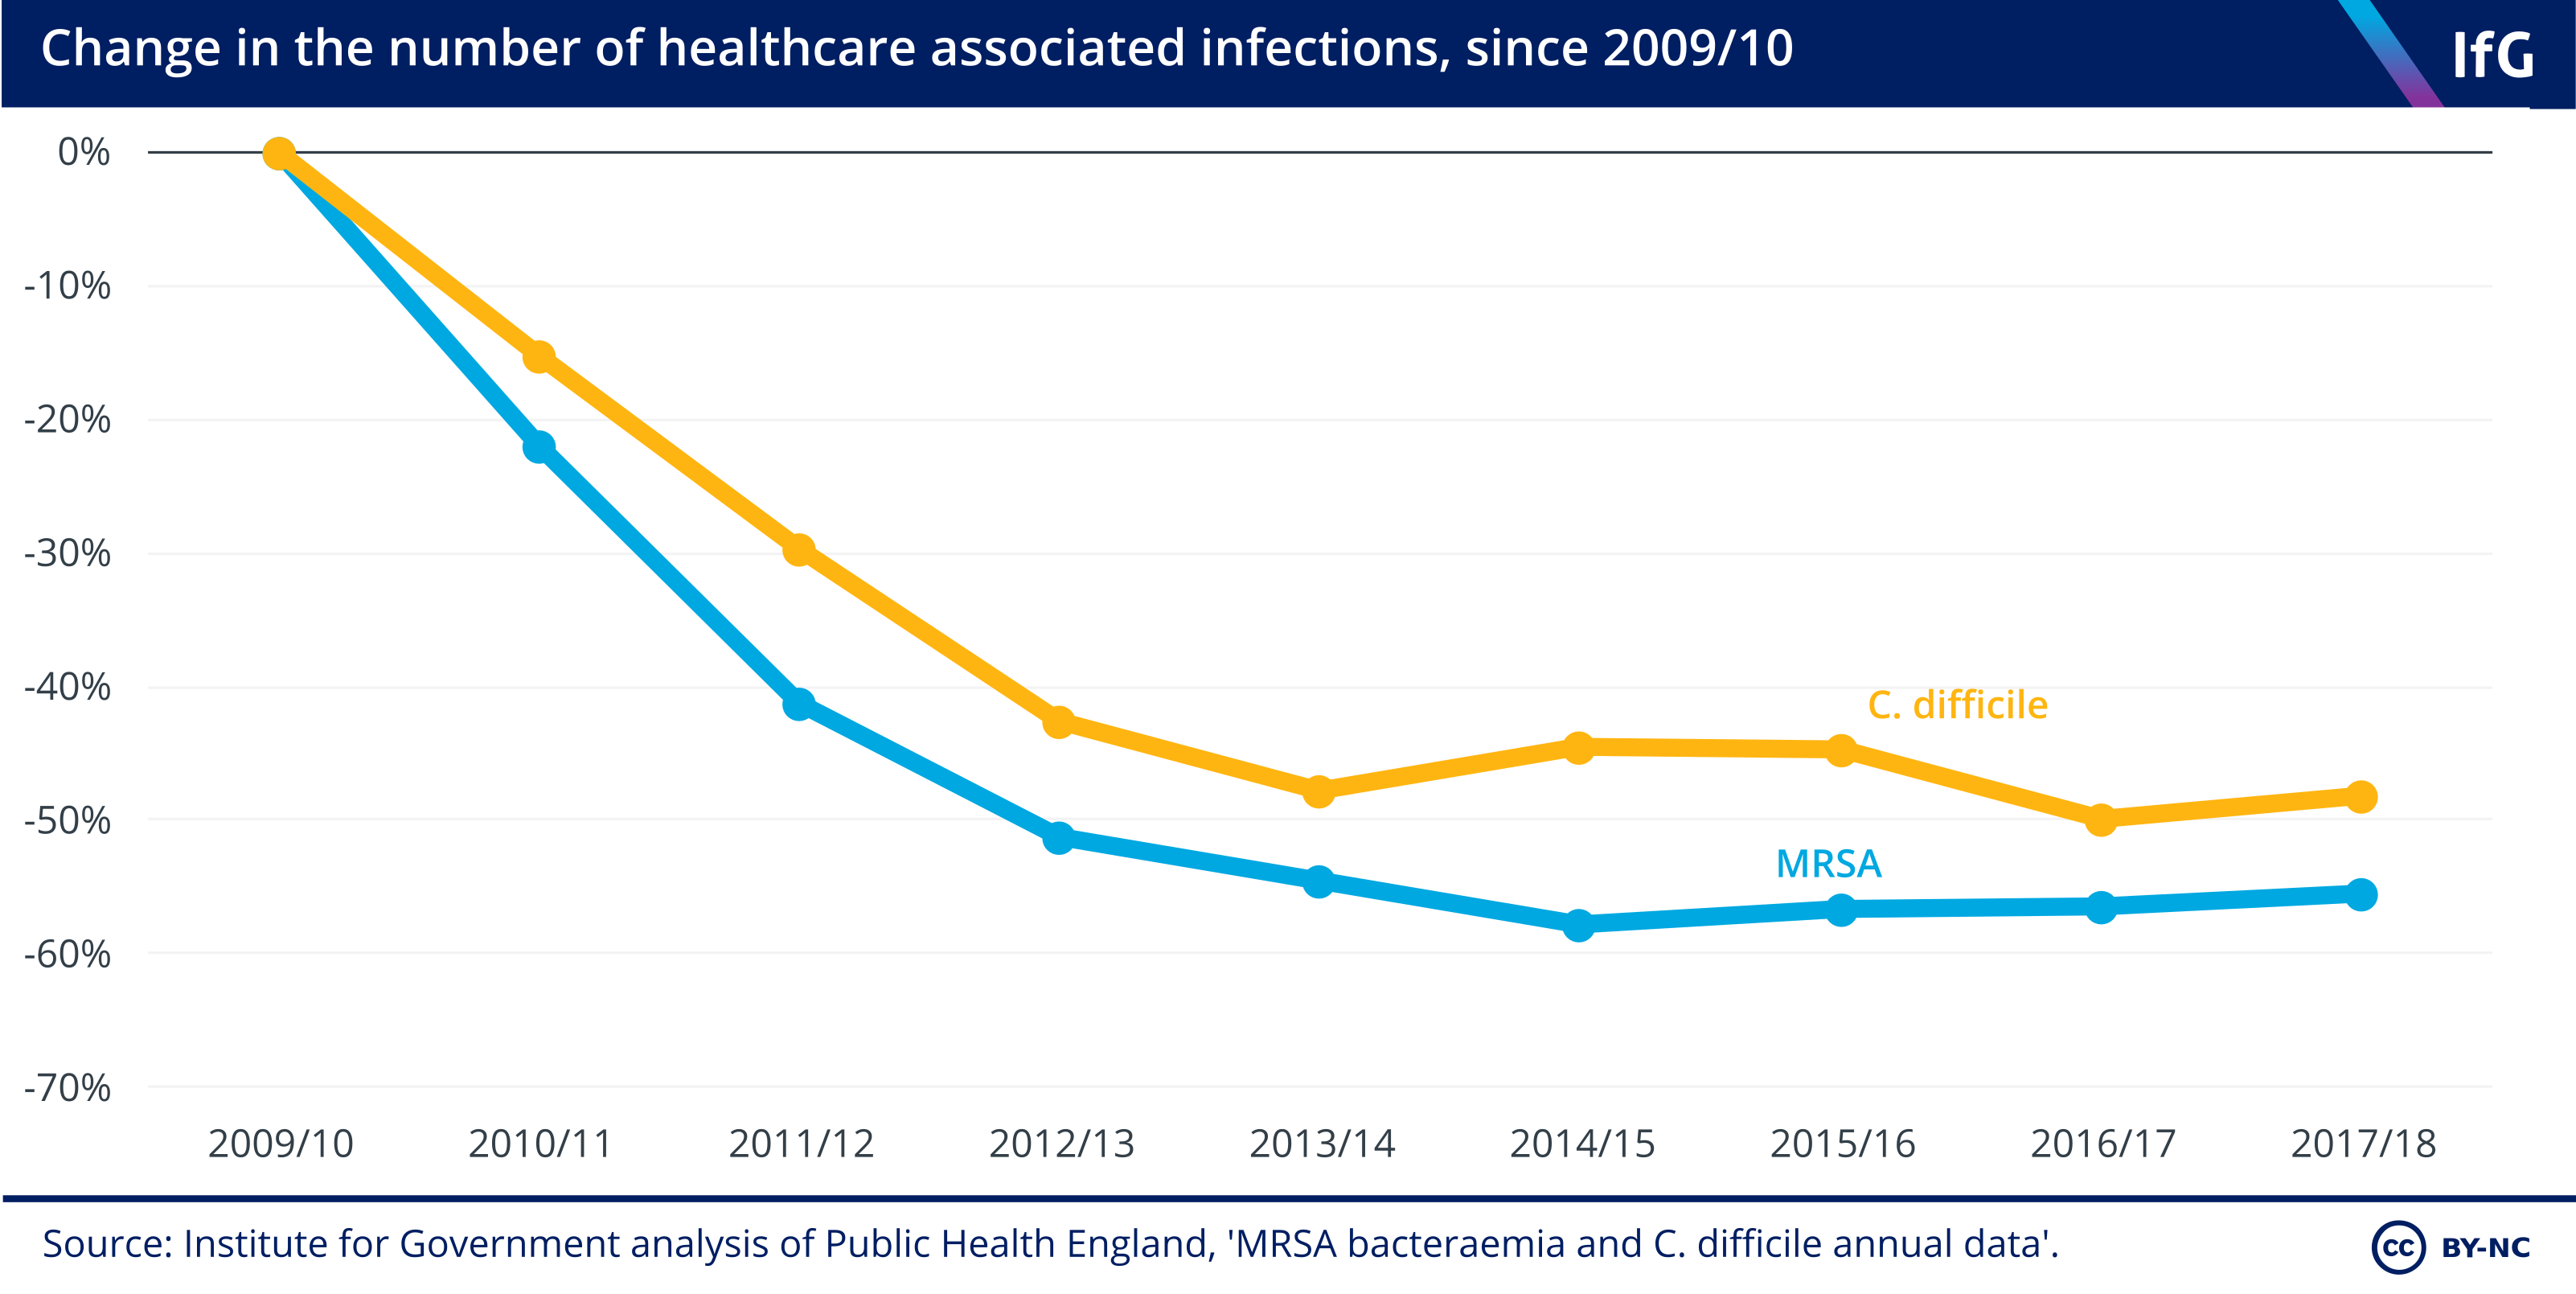
- The number of incidents of MRSA and C. difficile (both types of infections) on hospital wards fell from 1,898 to 846 and from 25,604 to 13,286 respectively.
- Other indicators of patient safety have also improved. Between August 2012 and June 2018, the proportion of patients deemed ‘harm free’ in acute hospital point-of-care surveys increased from 91.6% to 94.2%; there have also been declines in rates of new pressure ulcers, new venous thromboembolism and patient falls.
9. Over 75% of hospital patients are satisfied with the care they receive.
- Patient satisfaction has fluctuated between 75.6% and 77.3% between 2009/10 and 2016/17. In 2017/18, when a new methodology was introduced, patient satisfaction came out at 78%.
- Overall public satisfaction with the NHS (including people who have not necessarily interacted with the NHS recently) has also remained high, although it dipped recently. Satisfaction with the NHS was at 57% in 2017 (compared with 64% in 2009), with satisfaction for inpatient appointments at 55% (from 59%), outpatient appointments at 65% (from 67%) and A&E attendances at 52% (from 59%).
10. The national A&E 4-hour wait target has not been met since July 2013.
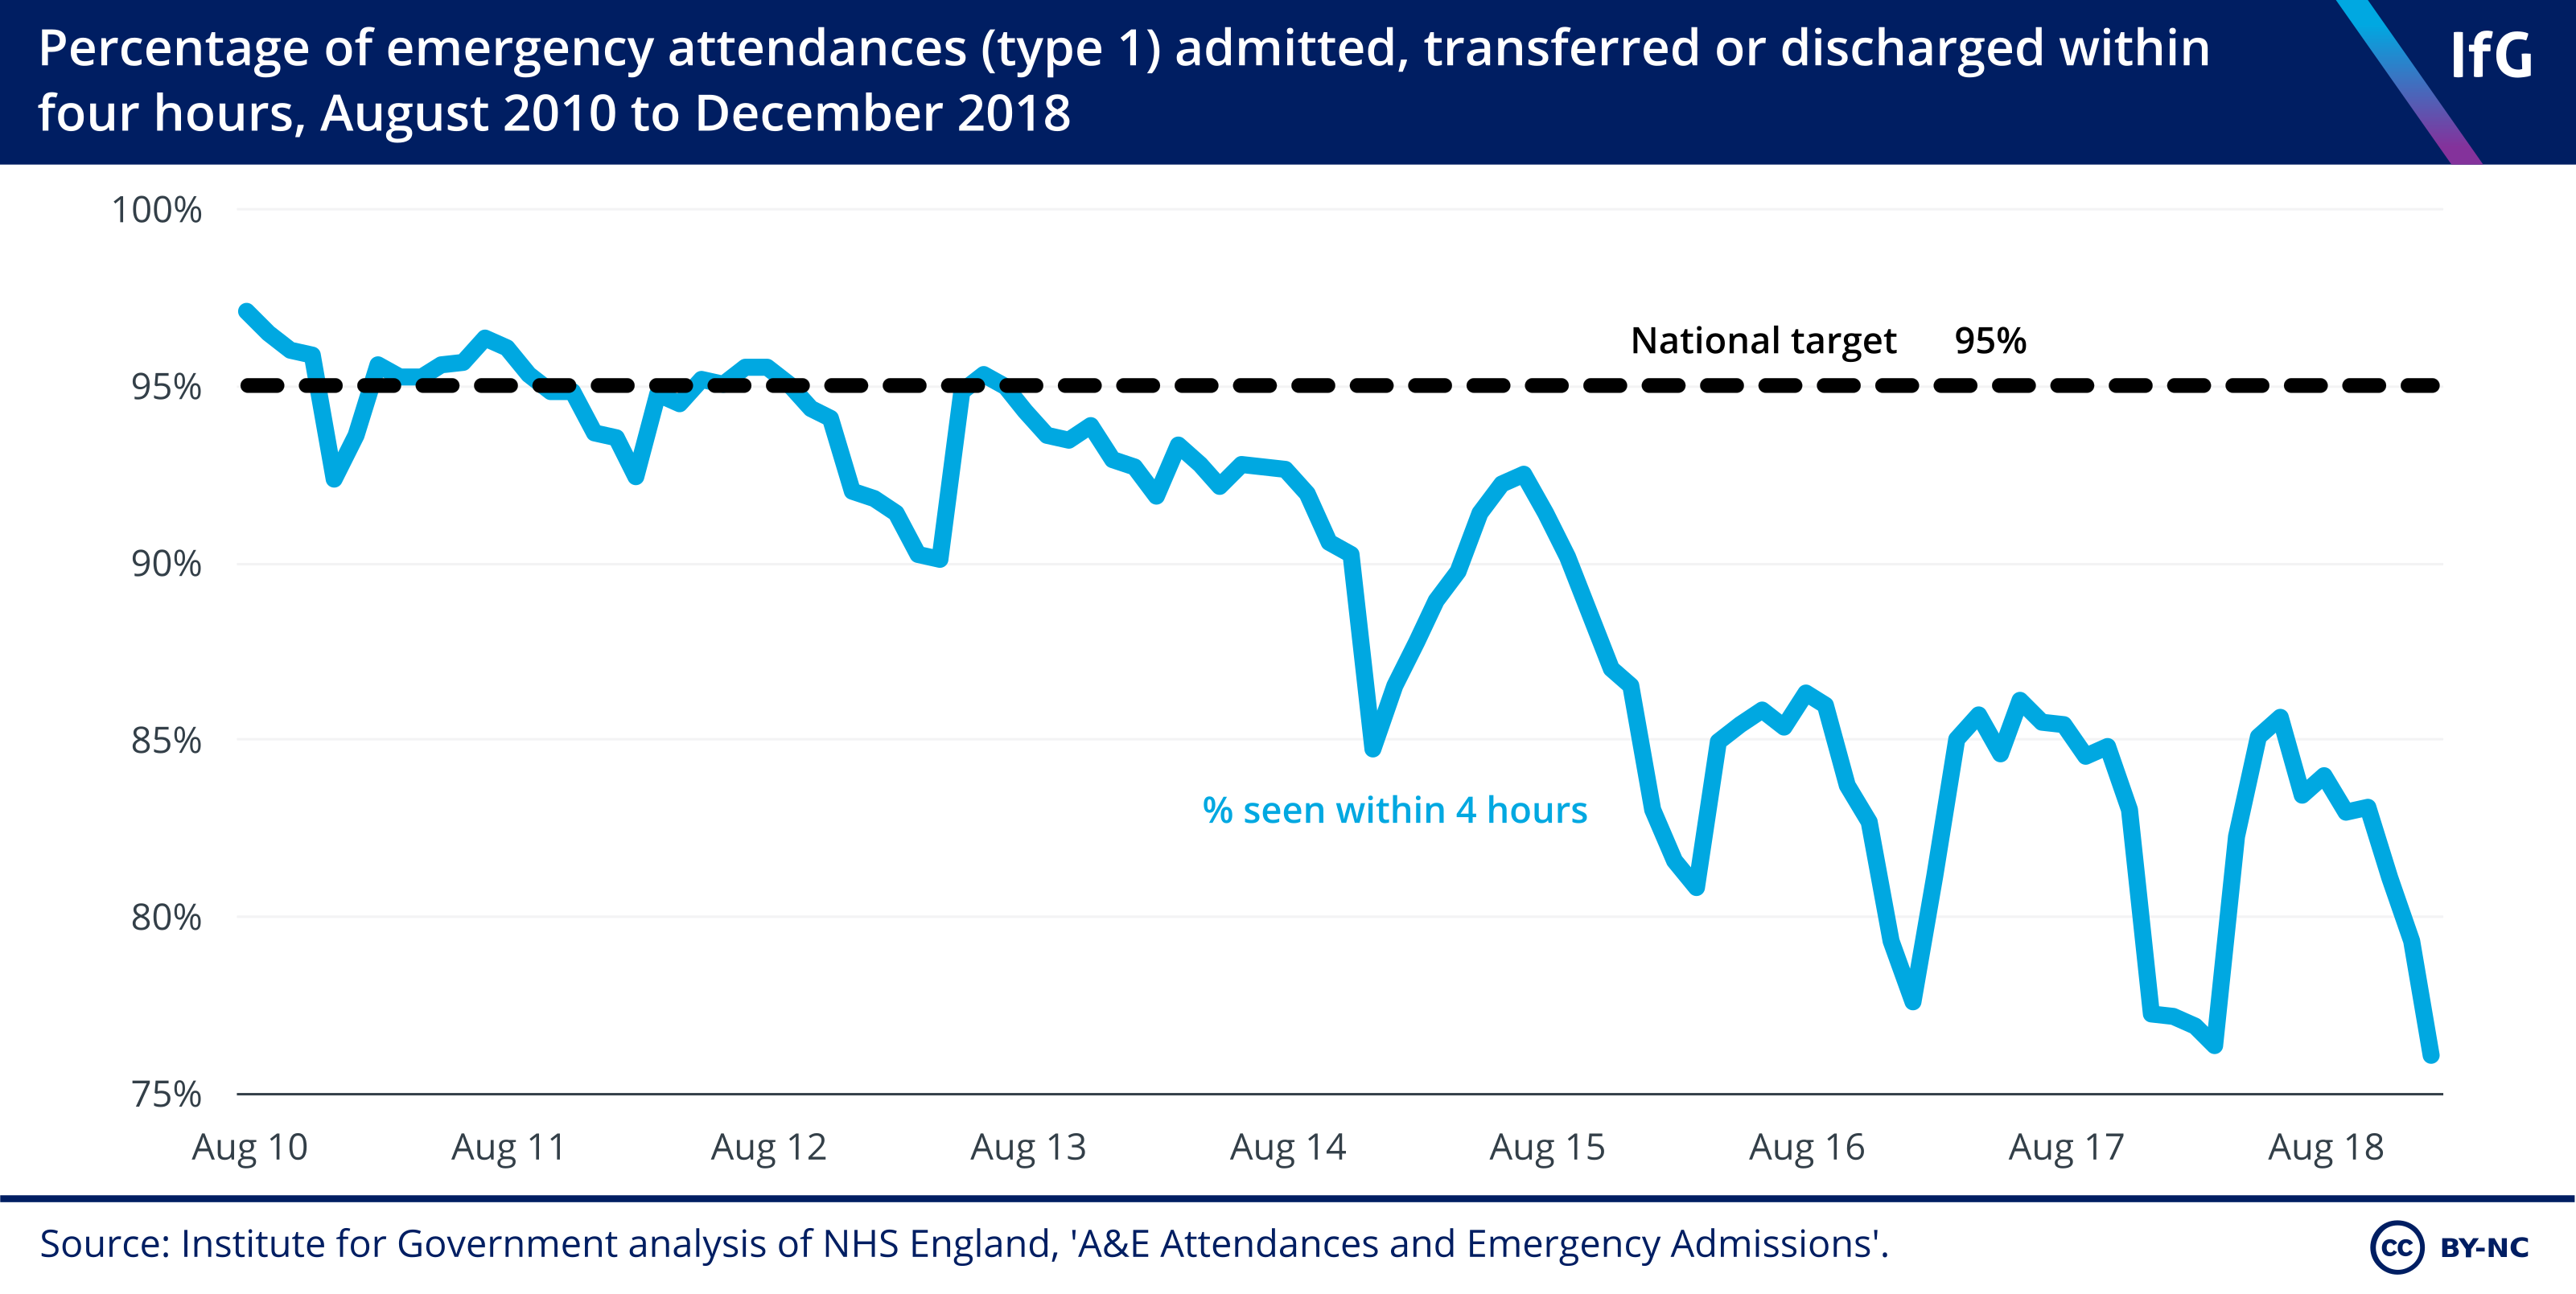
- Hospitals are not meeting the national A&E 95% 4-hour wait target. In August 2018, only 83.9% of attendances met the target, following a record low of 76.4% in March 2018.
- A&E waiting times are not the only targets being missed. In June 2018, only 87.8% of people began treatment for non-urgent conditions within 18 weeks of referral, against the 92% target.
- Performance against cancer targets is mixed. The target that 96% of first treatments should begin within one month from the decision to treat is routinely upheld, but the target that 85% of people should begin treatment for cancer within 62 days of an urgent GP referral has not been met for several years; in 2017/18 it was 82.2%.