Local government funding in England
How local government is funded in England and how it has changed since 2010.

What do local authorities in England do?
Local authorities in England deliver social care for children and adults, ‘neighbourhood services’ such as libraries and waste collection, and some aspects of transport, housing and education.
How is local government funded in England?
Local authorities have three main sources of revenue:
- government grants – money from central government for local services
- council tax – a property tax levied on residential properties
- business rates – a property tax levied on business premises.
In 2019/20 (the last year before emergency Covid funding), local authorities in England received 22% of their funding from government grants, 52% from council tax, and 27% from retained business rates.
Unlike central government, local authorities cannot borrow to finance day-to-day spending, and so they must either run balanced budgets or draw down reserves – money built up by underspending in earlier years – so as not to exceed their annual revenue.
Local government in England has limited revenue-raising powers compared to other wealthy countries. In 2018, every other G7 nation collected more taxes at either a local or regional level. undefined OECD, OECD Fiscal Decentralisation Database, www.oecd.org/tax/federalism/fiscal-decentralisation-database/ 7% of the UK's taxes were collected, or intended to be collected, locally in 2014, compared to 12% collected locally or federally in Italy, 32% in Germany, and almost 50% in Canada.
How has local government funding changed since 2010?
Local authority ‘spending power’ – the amount of money authorities have to spend from government grants, council tax and business rates – fell by 17.5% between 2009/10 and 2019/20, before partially recovering. However, in 2021/22 it was still 10.2% below 2009/10 levels.
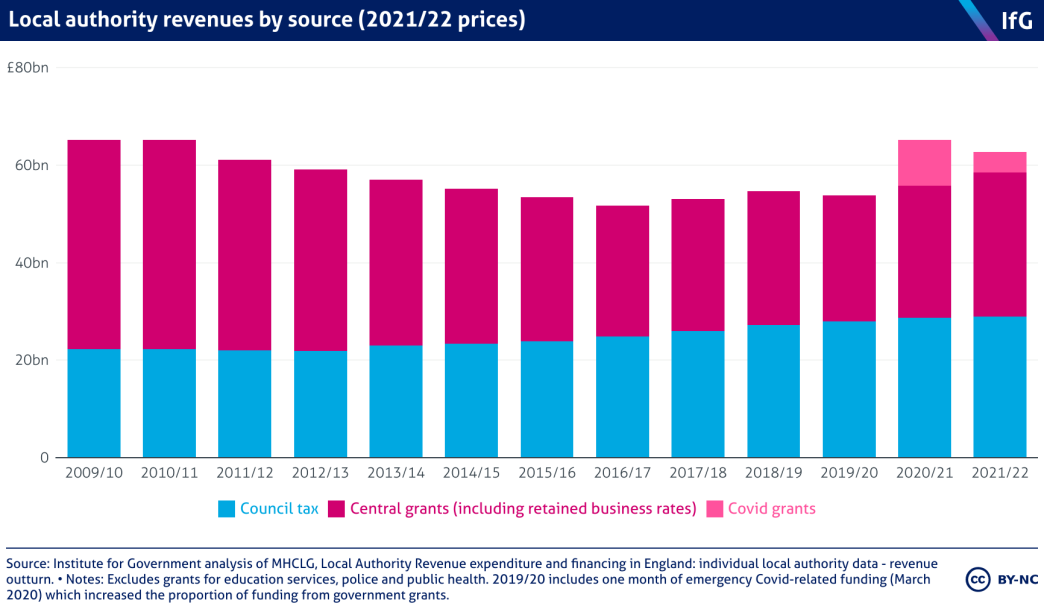
The fall in spending power is largely because of reductions in central government grants. These grants were cut by 40% in real terms between 2009/10 and 2019/20, from £46.5bn to £28.0bn (2023/24 prices). This downward trend was reversed in 2020/21 and 2021/22 as central government made more grant funding available to local government in response to the pressures of the pandemic. Though even including Covid grants, the fall in grant income was still 21% in real terms between 2009/10 and 2021/22; without, the fall was 31%.
While grants from central government were cut, rates of council tax, set by individual councils, were allowed to increased. Local authorities raised 30% more council tax, in real terms, in 2021/22 compared to 2009/10.
The Localism Act 2011 – which came into effect in 2012/13 – included a clause that prevented local authorities from raising council tax rates by more than 2% annually without holding a referendum. undefined OECD, OECD Fiscal Decentralisation Database, www.oecd.org/tax/federalism/fiscal-decentralisation-database/ Theresa May’s government increased this to 3% for 2018/19 and 2019/20. Most recently, the government allowed local authorities to raise this again, to 5%, for authorities with social care responsibilities undefined OECD, OECD Fiscal Decentralisation Database, www.oecd.org/tax/federalism/fiscal-decentralisation-database/ – with 2% from the social care precept and the remaining 3% for discretionary spending.
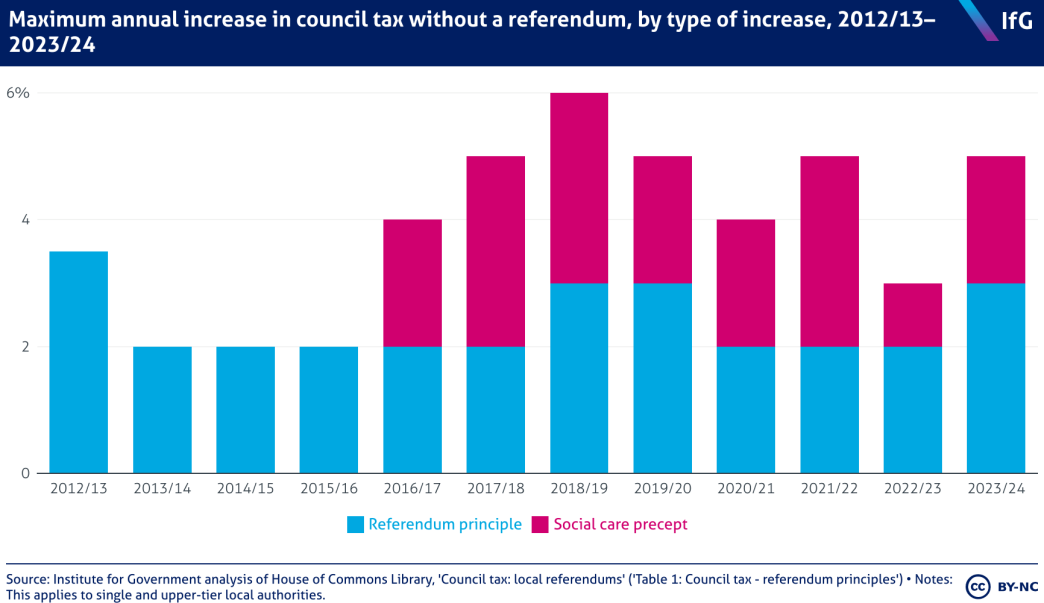
Between 2010 and 2015, the coalition government encouraged councils to freeze council tax rates by offering them higher grants. In effect, councils who froze council taxes did not lose revenues. In some years, these grants were a ‘one-off’ – local authorities were given additional money for a single year – whereas in others they were permanently ‘rolled in’ to central government grants to local authorities.
How have changes affected different types of local authority?
All local authorities have had to find ways to do more with less in the face of cuts to their spending power. But the size of the cuts since 2010 have varied across different types of local authorities.
The deepest cuts have been to shire districts. In part this is because they did not benefit from the 2019/20 and 2020/21 social care uplifts for upper and single-tier authorities – which include all metropolitan, county, unitary and London authorities.
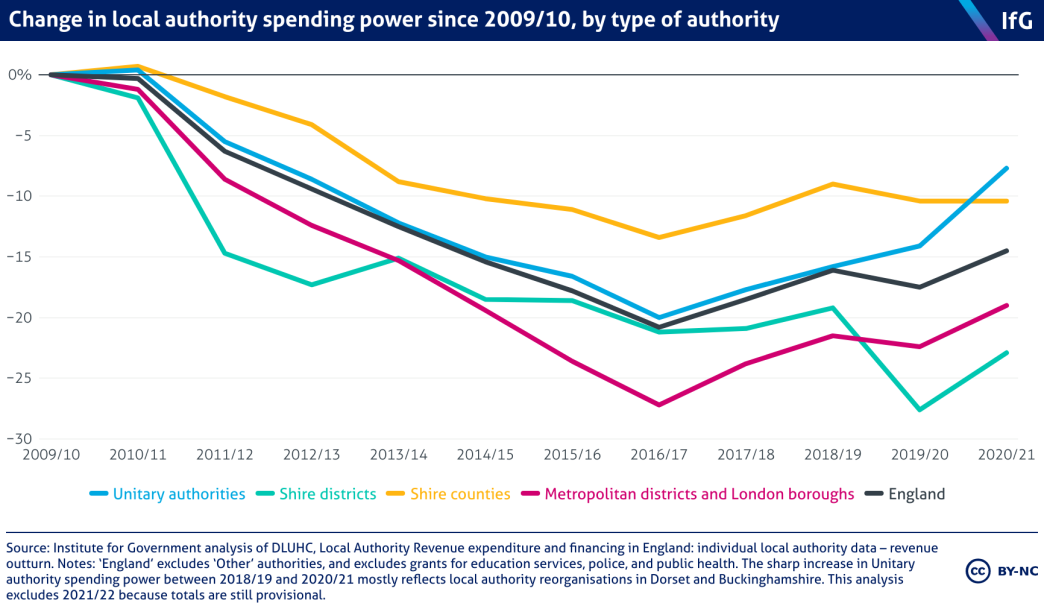
Upper and single tier authorities have faced particular difficulties because of rising demand for social care, even though since 2016/17 they have been allowed to increase council tax rates more quickly. Social care is a statutory responsibility – that is, local authorities are legally obliged to provide it – and so they have protected spending on social care for children and adults, often at the expense of other services, such as libraries and road maintenance.
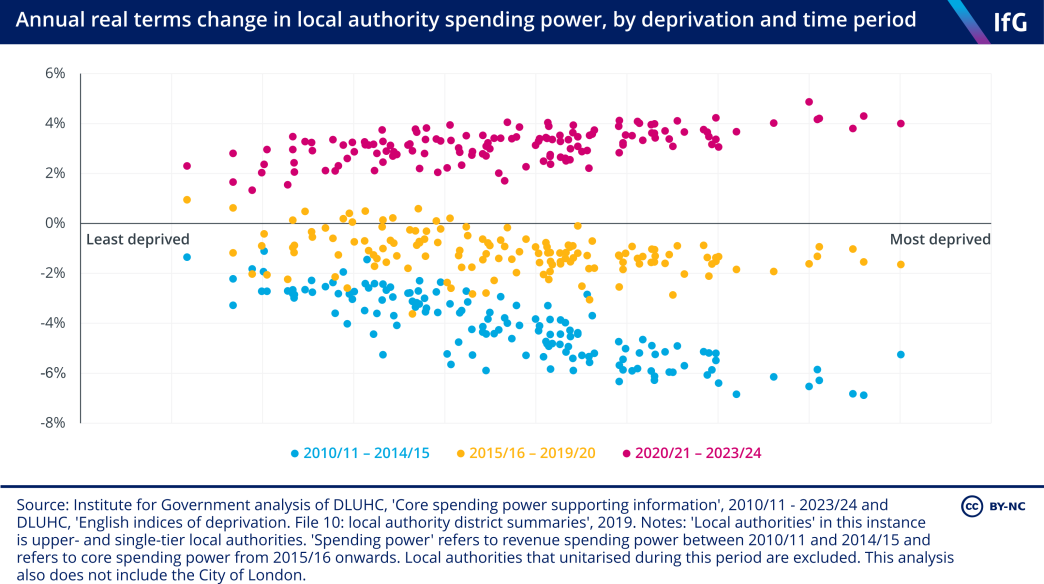
Cuts also fell more heavily on more disadvantaged local authorities. The most deprived local authorities experienced the largest falls in spending power between 2010/11 and 2019/20. This is because of the way that central government allocated funding cuts. Grant funding was cut by a uniform percentage across all local authorities in the first half of the 2010s, but because grant funding made up a greater proportion of more deprived local authorities’ funding, this approach meant that their spending power fell by more. This has changed in recent years as central government has directed more funding towards less deprived authorities, more on which below.
How has business rates policy changed?
Before 2013, business rates revenues were collected locally and then sent to the Treasury, which redistributed the revenues to local authorities through central government grant funding. Since reforms in 2013/14, local authorities have kept 50% of the business rates revenues raised locally, while the grant they receive from central government has been adjusted to compensate those who generate less locally-raised revenue. To calculate the amount returned to authorities, the government applies either a ‘tariff’ or ‘top-up’ when providing funding. A tariff is placed on any authorities it deems need less than the 50% of business rates sent to the Treasury, whereas for authorities judged to be struggling a ‘top up’ will be added to that 50%.
In the first year that this system was in place, these tariffs and top-ups were set such that each local authority received broadly the same amount as they would have received under the old system. However, tariffs and top-ups are not reset each year, and the outcomes for councils may have differed in later years (more on which below).
The government originally intended to increase the proportion of business rates that local authorities retain to 100%. That ambition was revised down to 75% in 2017, 17 Local authority financial sustainability and the section 114 regime, 2021, https://publications.parliament.uk/pa/cm5802/cmselect/cmcomloc/33/3306.htm with roll out due to occur in April 2021. That date was then pushed back to April 2023 due to the pandemic, and in late 2021 the government signalled that it was delaying implementation indefinitely. 18 Hill J, Gove signals ‘redistribution’ of funding to support poorer councils, Local Government Chronicle, 9 November 2021, www.lgcplus.com/finance/gove-signals-redistribution-of-funding-to-support-poorer-councils-09-11-2021/
How did Covid affect local authority finances?
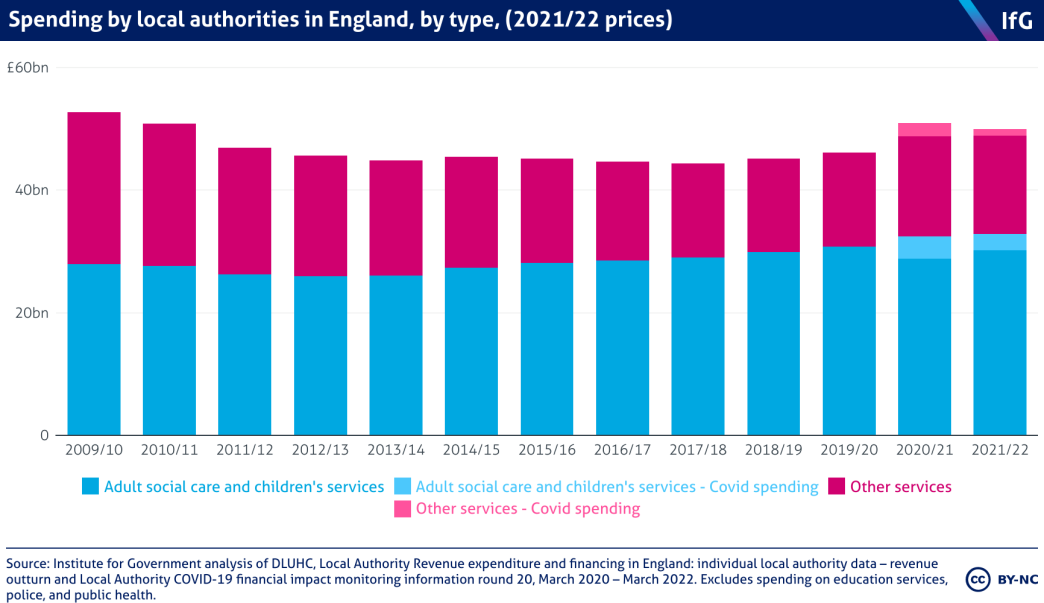
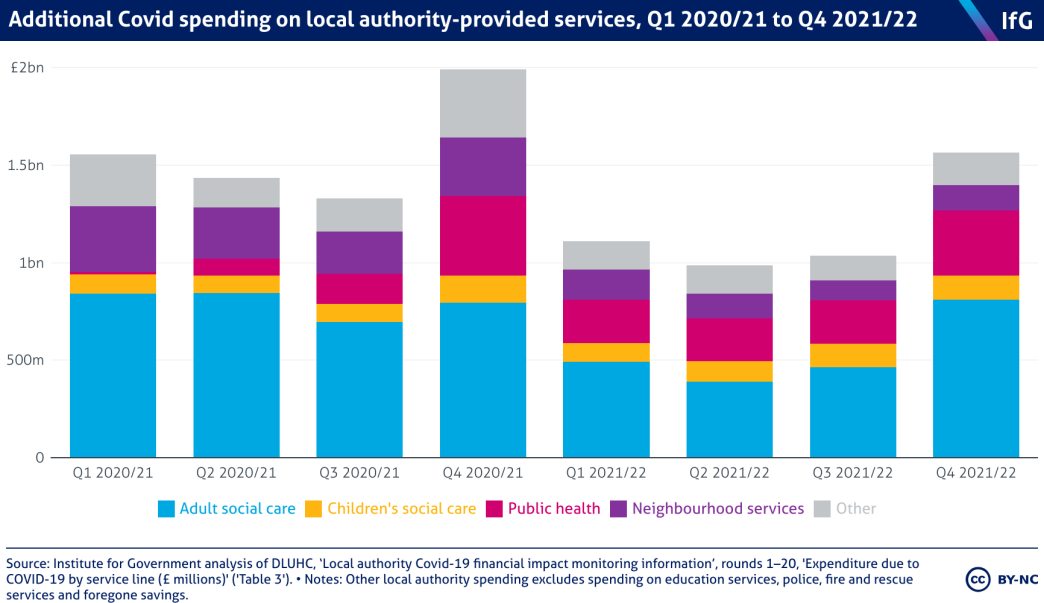
Local authorities lost income and spent more as a result of higher costs and increased demand for services during the pandemic. Throughout the two years between March 2020 and March 2022 (the only period for which DLUHC published data), local authorities spent £11bn on Covid-related measures. The service that required the most spending was adult social care, on which local authorities spent £5.3bn, or 48.4% of the total.
The effects of Covid have not been experienced equally by all local authorities. While in aggregate local authorities have received more than enough central government money to cover all lost income and higher costs due to Covid, there is large variation between councils. Some authorities have been ‘over-compensated’ and others have been ‘under-compensated’. Some ‘under-compensated’ authorities drew down their reserves to cover additional costs. 73% of district councils and 46% of single-tier and county councils reported either having already used reserves, or planning to use reserves at the end of 2020.
How will local government funding change over the rest of the parliament?
Spending review and autumn statement
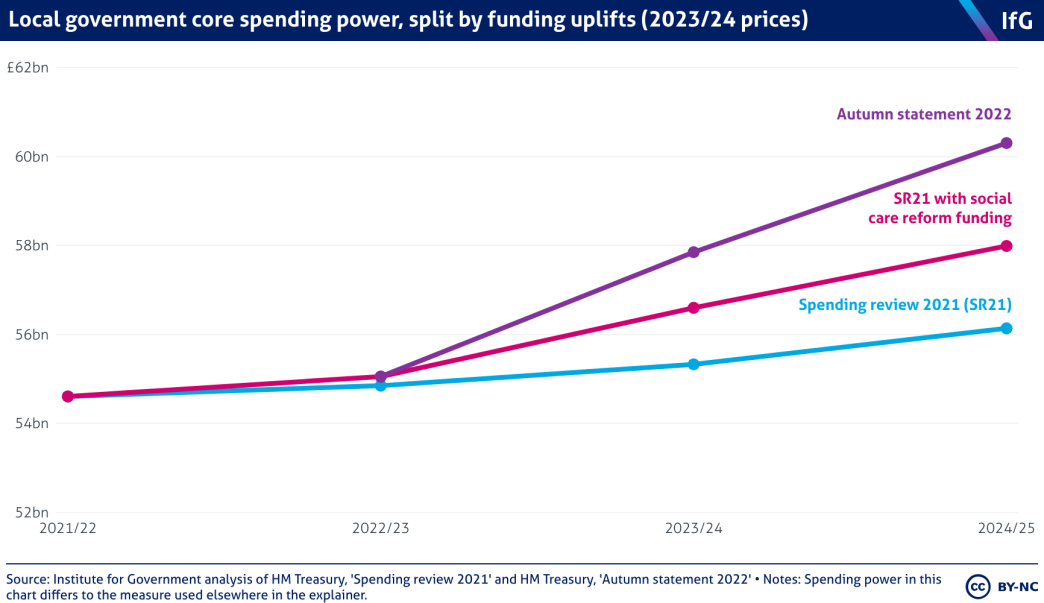
The 2021 ‘comprehensive spending review’ was the first multi-year spending review since 2015 and set resource and capital budgets for the years 2022/23 to 2024/25. It laid out 3% per-year real-terms increases in local authority spending power over the period, including £3.6bn for social care reform.
The 2022 autumn statement further increased local authorities’ core spending power. This increase all came in the form of additional funding for adult social care, though some of that “additional funding” was the result of the government delaying implementation of adult social care charging reforms until at least October 2025. There was, however, genuine new funding too. This came via a mixture of additional grant funding and an increased ability for local authorities to raise council tax. In total, this means that local authority spending power is now due to rise by 3.4% in real terms per year in 2023/24 and 2024/25. 24 It should be noted that this is the government’s definition of spending power, which differs slightly from the measure that we use further up the explainer.
Local government finance settlements for 2022/23 and 2023/24-2024/25
The government allocates grant funding to local authorities in a process called the ‘local government finance settlement’. These can be multi-year or single-year settlements, but have recently tended more towards the latter.
Since the 2021 spending review, the government has released two local government finance settlements. The first of these – released provisionally in December 2021 – covered only the financial year 2022/23. The second, released one year later, covered 2023/24 in full and provided an indication of funding for 2024/25.
These settlements marked a change in government approach to allocating funding. Since 2020/21, and in contrast to the first half of the 2010s, the most deprived local authorities have experienced the largest uplifts (see above). There have also been increases in core spending power for all local authorities – driven in part by increased Covid funding and in part by more post-pandemic funding for adult social care, although neither returns them to levels seen at the beginning of last decade.
The government chose to allocate these uplifts predominantly through one-off grants: the Services Grant allocated £822m of funding in 2022/23 and increased grant funding for adult social care in 2023/24. Neither settlement, however, included any longer term changes for allocating funding, reducing the likelihood of more equitable grant distribution across local authorities in future finance settlements. The government’s response to the Fair Funding Review and business rates retention have the potential to redress that longer standing issue.
Fair Funding Review and business rates retention
This review – formally, the Review of Local Authorities’ Relative Needs and Resources 25 Department for Levelling Up, Housing and Communities and Ministry of Housing, Communities and Local Government, Review of local authorities’ relative needs and resources, 13 December 2018, www.gov.uk/government/consultations/review-of-local-authorities-relative-needs-and-resources – started in 2016 26 Sandford M, Reviewing and reforming local government finance, House of Commons Library, 4 August 2020, https://commonslibrary.parliament.uk/research-briefings/cbp-7538/ and explored changing how central grants are distributed between local authorities and with the potential for resetting the baselines for determining each local authority’s need. The last time the baseline was reset was in 2013/14 and since then shifting demographics have affected local authorities in different ways and justified a re-evaluation of the method by which central grants are allocated.
The government delayed implementation of the review multiple times during Covid. Most recently, the Sunak government used the 2023/24 finance settlement to claim that while it “remains committed to improving the local government finance landscape”, it would not implement the findings of the Fair Funding Review in this spending review period, meaning that there will be no change until April 2025 at the earliest. 27 Local authority financial sustainability and the section 114 regime, 3. Funding, 2021, https://publications.parliament.uk/pa/cm5802/cmselect/cmcomloc/33/3306.htm
The other method that central government could use to shift the source of funding from central government to local areas – increased business rate retention – has also been delayed indefinitely, as discussed above.
In its decisions on the Fair Funding Review and business rates retention, the government will have to choose between two alternative models: on the one hand, more central grants and national standards for services; on the other, more devolved tax-raising powers and variation in local services.
28
Johnson P, The present model of funding for local government is unsustainable, Institute for Fiscal Studies, 18 February 2019, https://ifs.org.uk/articles/present-model-funding-local-government-unsustainable