The grade structure of the civil service in 2016
Our recent Whitehall Monitor 2017 included a quick look at the grade structure of various departments. Alice Lilly finds the most junior grades have had the deepest reductions – but still account for more civil servants than any other grade.
See our explainer for our more recent analysis of the grade structure of the civil service.
Staff reductions have been deepest at more junior levels…
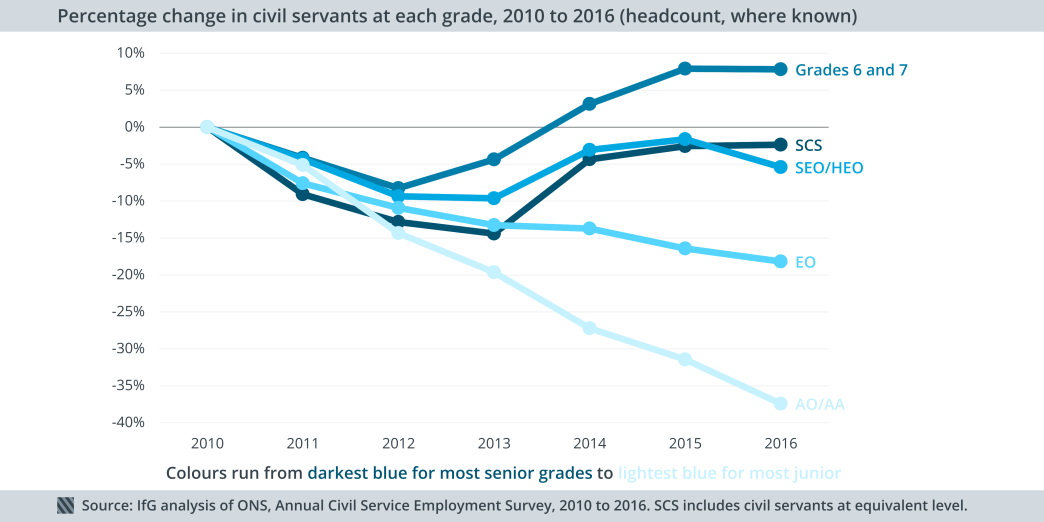
Since 2010, all civil service grades – except Grades 6 and 7 – have experienced a net reduction. Falls have been the greatest, and the most consistent, at the two most junior levels: Administrative Assistant/Administrative Officer (AA/AO) and Executive Officer (EO).
Middle and higher level grades – SEO/HEO (Senior Executive Officers/Higher Executive Officers), Grades 6 and 7 and the SCS (Senior Civil Service) – all experienced reductions up to 2012, but then followed different paths:
- SEO/HEO staff numbers increased between 2013 and 2015, then fell by 4,000 between 2015 and 2016
- Grades 6 and 7 increased from 2012 to 2015 before a very slight fall in 2016, when the grade was still 8% above 2010 levels (2,870 more staff)
- SCS has grown every year since 2013, though it remains 2% below 2010 numbers.
…but the civil service is still largely comprised of people at junior grades.
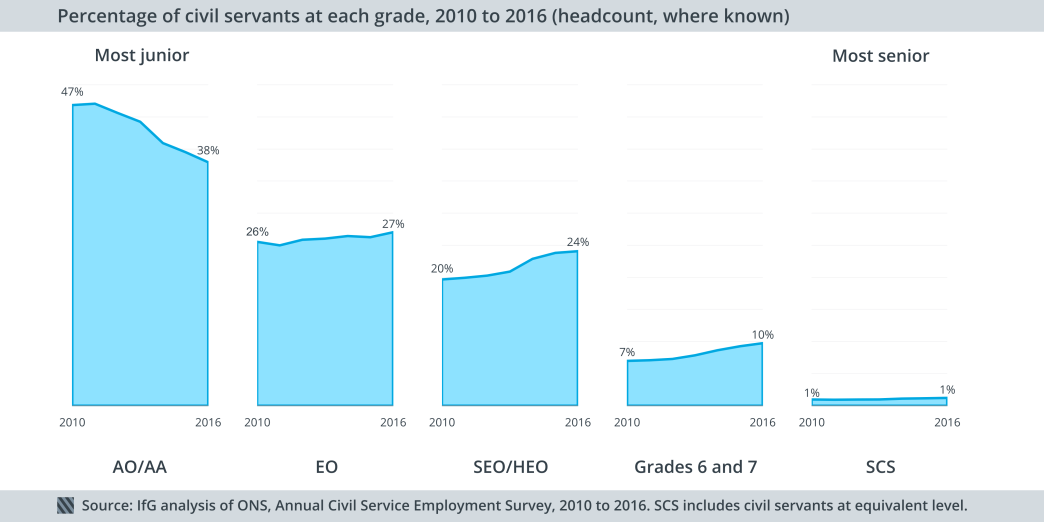
Despite large falls in the numbers of AO/AAs and EOs, the two grades combined still make up just below two thirds of the whole civil service. EOs constitute over a quarter of the civil service, and while the share of AO/AAs has fallen from 47% in 2010, it remains at 38%.
SEO/HEOs and Grades 6 and 7 now make up more of the civil service than in 2010, but the most senior grade, SCS, remains at around 1% of the whole civil service since 2010.
In most departments, staff have become more concentrated in more senior grades.
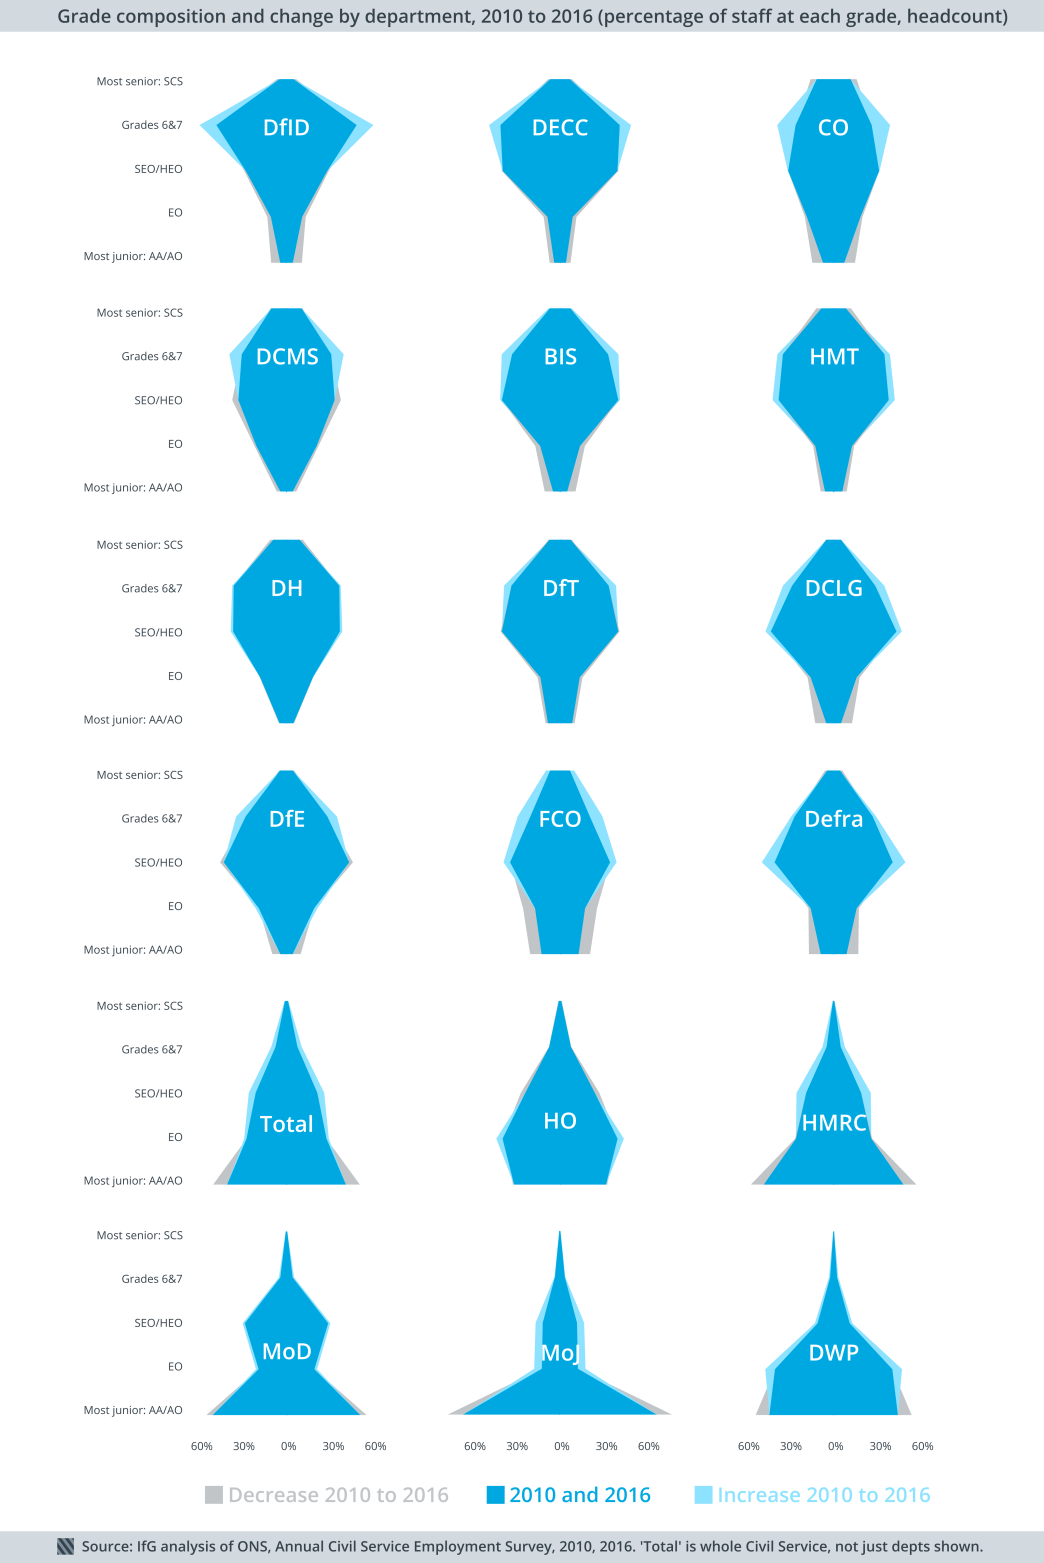
Almost all departments have seen reductions in their share of AO/AAs and a higher percentage in the next few levels up. In other words, the civil service is more concentrated in more senior grades in most departments than in 2010.
AO/AAs are still the largest grade in the big delivery departments: 63% of MoJ staff (which include prison officers) are AO/AAs, down from 73% in 2010. HMRC (tax), MoD, and DWP (benefits, job centres) remain bottom-heavy. These departments are ‘pyramid-shaped’.
Departments with the bulk of their staff at the middle SEO/HEO grade are ‘diamond-shaped’ – this includes DfT, DCLG, DfE, Defra) As in 2015, Defra has the highest proportion of staff at this level (46%), closely followed by DCLG (44%).
By contrast, DfID, DECC, BIS, Cabinet Office, DCMS are ‘kite-shaped’. This means staff are concentrated at the second-highest Grade 6 and 7 level. DfID continues to have the greatest proportion of staff (56%) at this level, a slight increase on 2015. Since 2010, there have been big increases in the proportion of Grades 6 and 7 at the Cabinet Office (up 12 percentage points) and DCMS (up 8).
Despite movement up through the grades, most departments have experienced declines in the proportion of staff in the most senior grade – the SCS – since 2010. Six departments (BIS, FCO, DWP, HMRC, MoD, MoJ) have seen an increase in the share of SCS staff since 2010 – but in only one case, the FCO, has the rise been above 1%. This is the only department where there has also been an absolute increase in SCS numbers, from 380 in 2010 to 390 in 2016; each of the other five departments have actually seen absolute numbers of senior civil servants fall.