Major Projects Authority Annual Report, 2015
The picture across government.
Thanks to the transparency of the Major Projects Authority, we know more about government’s major projects than ever before. But what does the MPA’s third annual report, published in late June, tell us? Emily Andrews and Gavin Freeguard have the answers. We are very grateful to the data team at the MPA for their help with the numbers.
The Major Projects Authority aims to improve how government manages major projects. The Major Projects Authority (MPA) was established in 2011 to improve the government’s delivery of major projects – or ‘get firmer control’ of them, according to the MPA’s mandate from the Prime Minister. The projects in the MPA portfolio are developed and implemented by individual government departments, but the MPA provides support and challenge and reviews their performance. It also leads the Civil Service’s training and development in project delivery through the Major Projects Leadership Academy. According to the MPA, these ‘major projects’ include those changing the way government works and delivers services (e.g. opening rehabilitation up to the market at MoJ), big infrastructure and construction projects (like Thameslink or Crossrail at DfT), defence projects and ICT projects. Some projects – such as DWP’s Universal Credit – might fall under a number of categories. The MPA’s third annual report gives us a wealth of data on these projects as of September 2014, including a delivery confidence assessment or RAG (Red Amber Green) rating for each. There are now 188 projects in the Government Major Projects Portfolio (GMPP), down from 199 in 2014 and 191 in 2013. 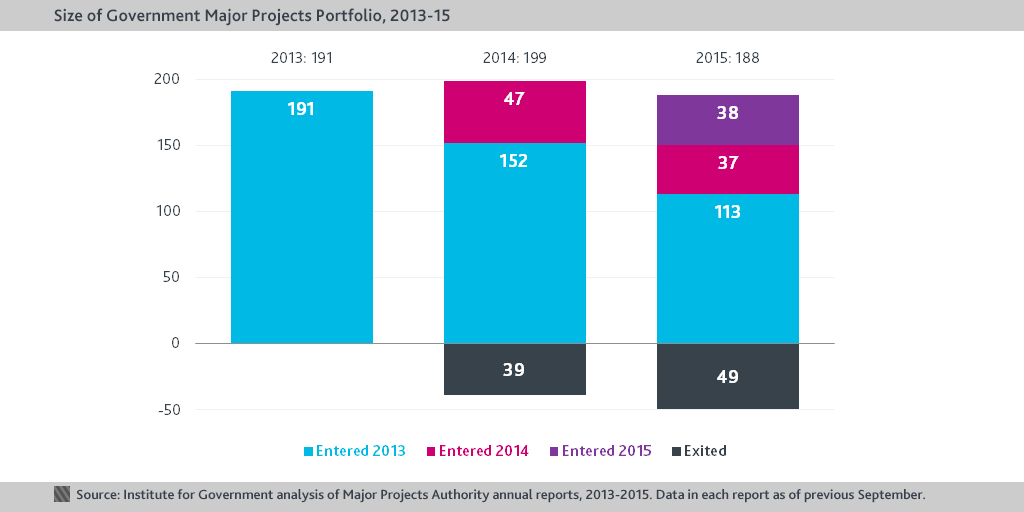

- the two red-rated projects in 2015 (the National Offender Management Service ICT project at MoJ and the Future Reserves Project at MoD) have declined from amber/red and amber since 2014
- the two rated red in 2014 – Aircraft Carrier procurement (MoD) and ICT modernisation at the National Crime Agency (HO) – are now both rated amber/red.
Most of the projects rated red or amber/red in 2013 have improved – but 9 remain amber/red. 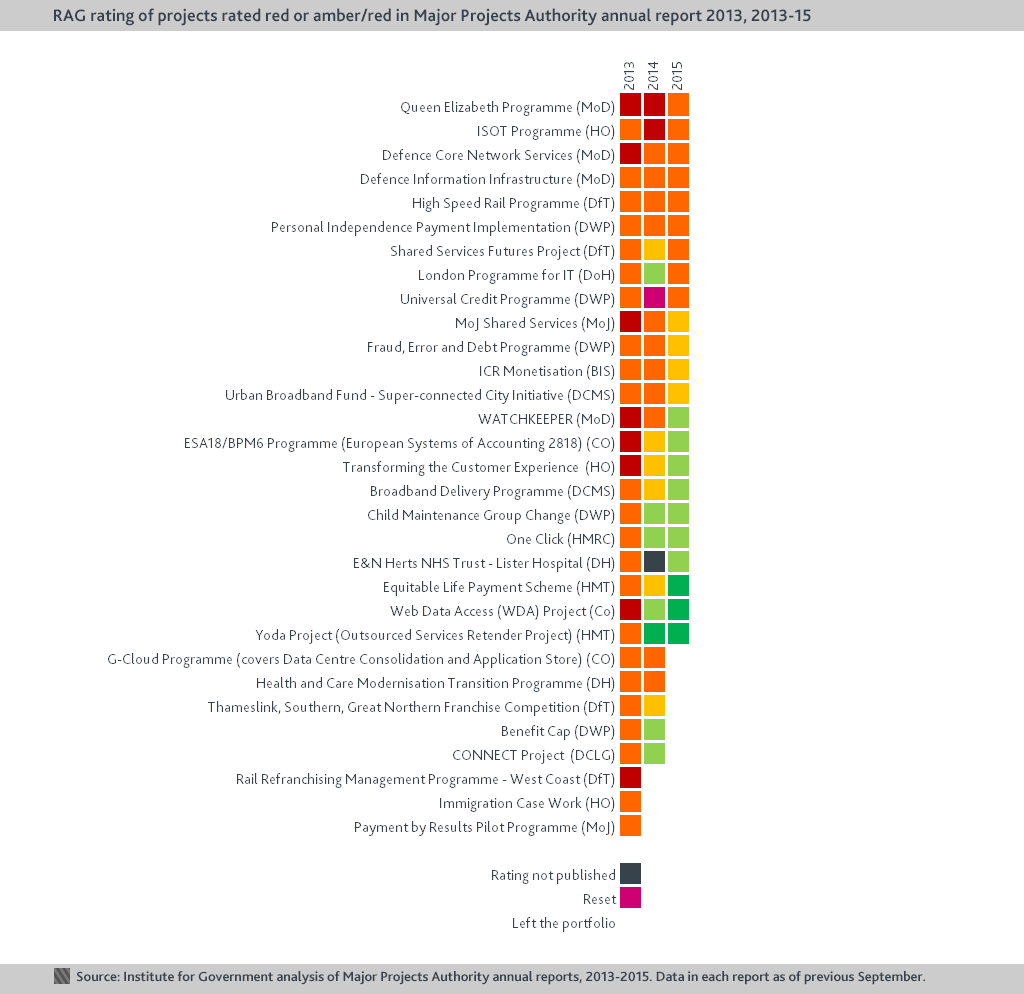

- Freedom of Information exemptions apply to nine projects
- Departments have not provided data in six cases for various reason (for example, DfE’s Priority School Building Programme is a ‘Private Finance project’).
In 2013 and 2014, the MPA published a headline figure showing the whole-life cost of the entire portfolio, which included (at least some of) those unreported costs. But this year, the headline figure does not include these exempted projects: £489bn is the sum of all of the whole-life costs published in the report. Almost half of the known total life cost of major projects is being spent on projects rated amber. 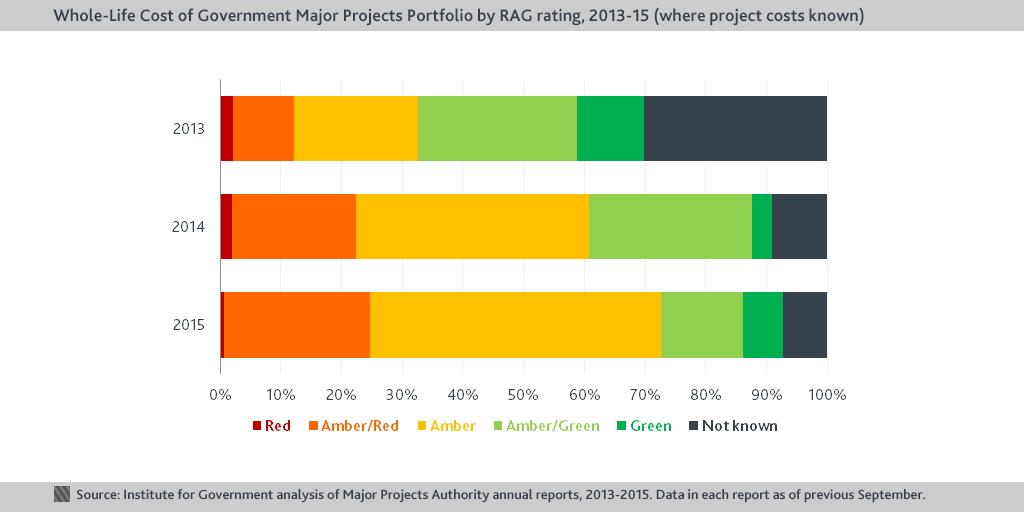
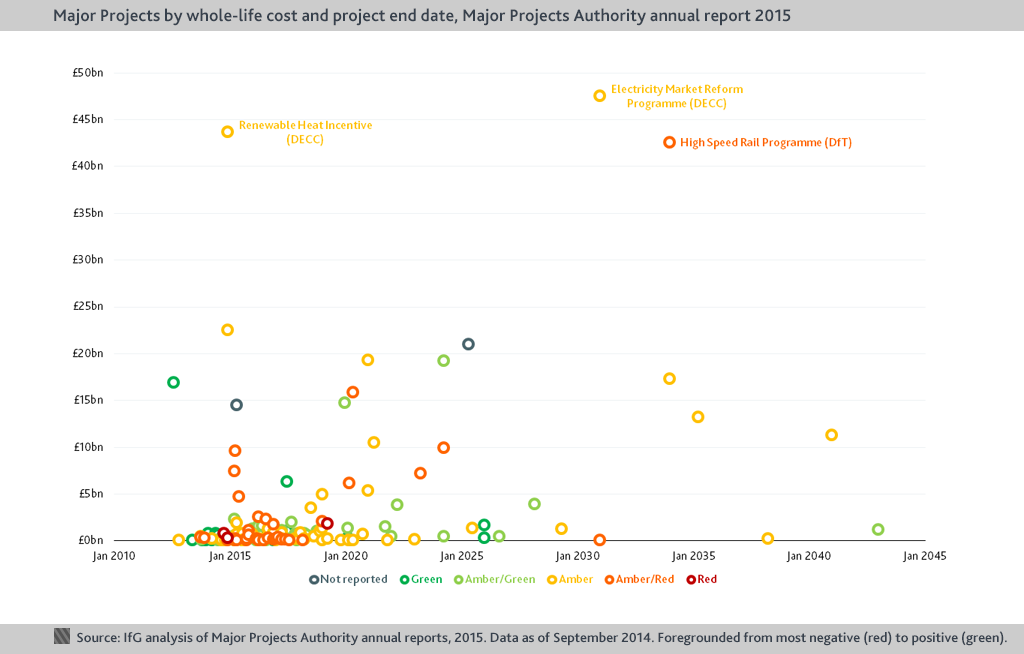
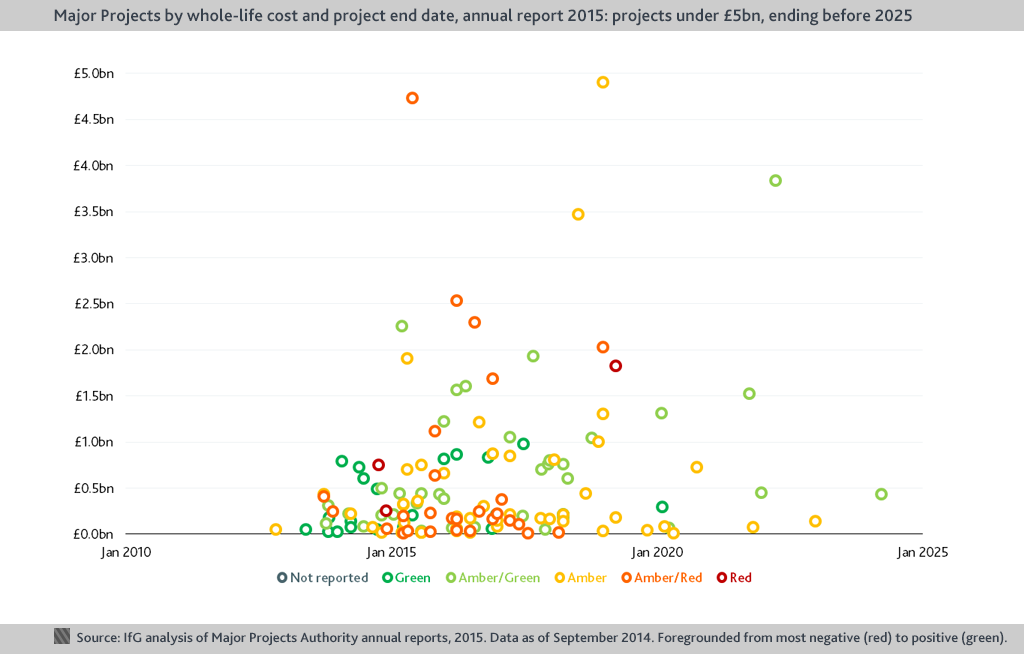
- We cannot chart those projects missing either a whole life cost figure or end date (18 in total)
- The way whole-life costs are calculated is not always consistent – for example, DECC’s Geological Disposal Facility is expressed in real rather than nominal terms because of the long timescale involved
- The end date is often not the actual end date and isn’t used consistently – for example, DECC’s Renewable Heat Incentive has an end date of 2014 despite continuing (according to the commentary) until 2040, which the whole life cost calculations run to.
We’ll look at the details by department in a separate post. You can find our spreadsheet collating the Major Projects Authority annual reports here.