Working to make government more effective

Comment

The Civil Service in 2016 – smaller, older, better gender balance

Gavin Freeguard, Adam Boon and Robert Adam find a smaller, older Civil Service, with improving gender balance

The latest Civil Service statistics, which give us data on everything from diversity to grades, are out today. Gavin Freeguard, Adam Boon and Robert Adam find a smaller, older Civil Service, with improving gender balance. All data as of March 2016.

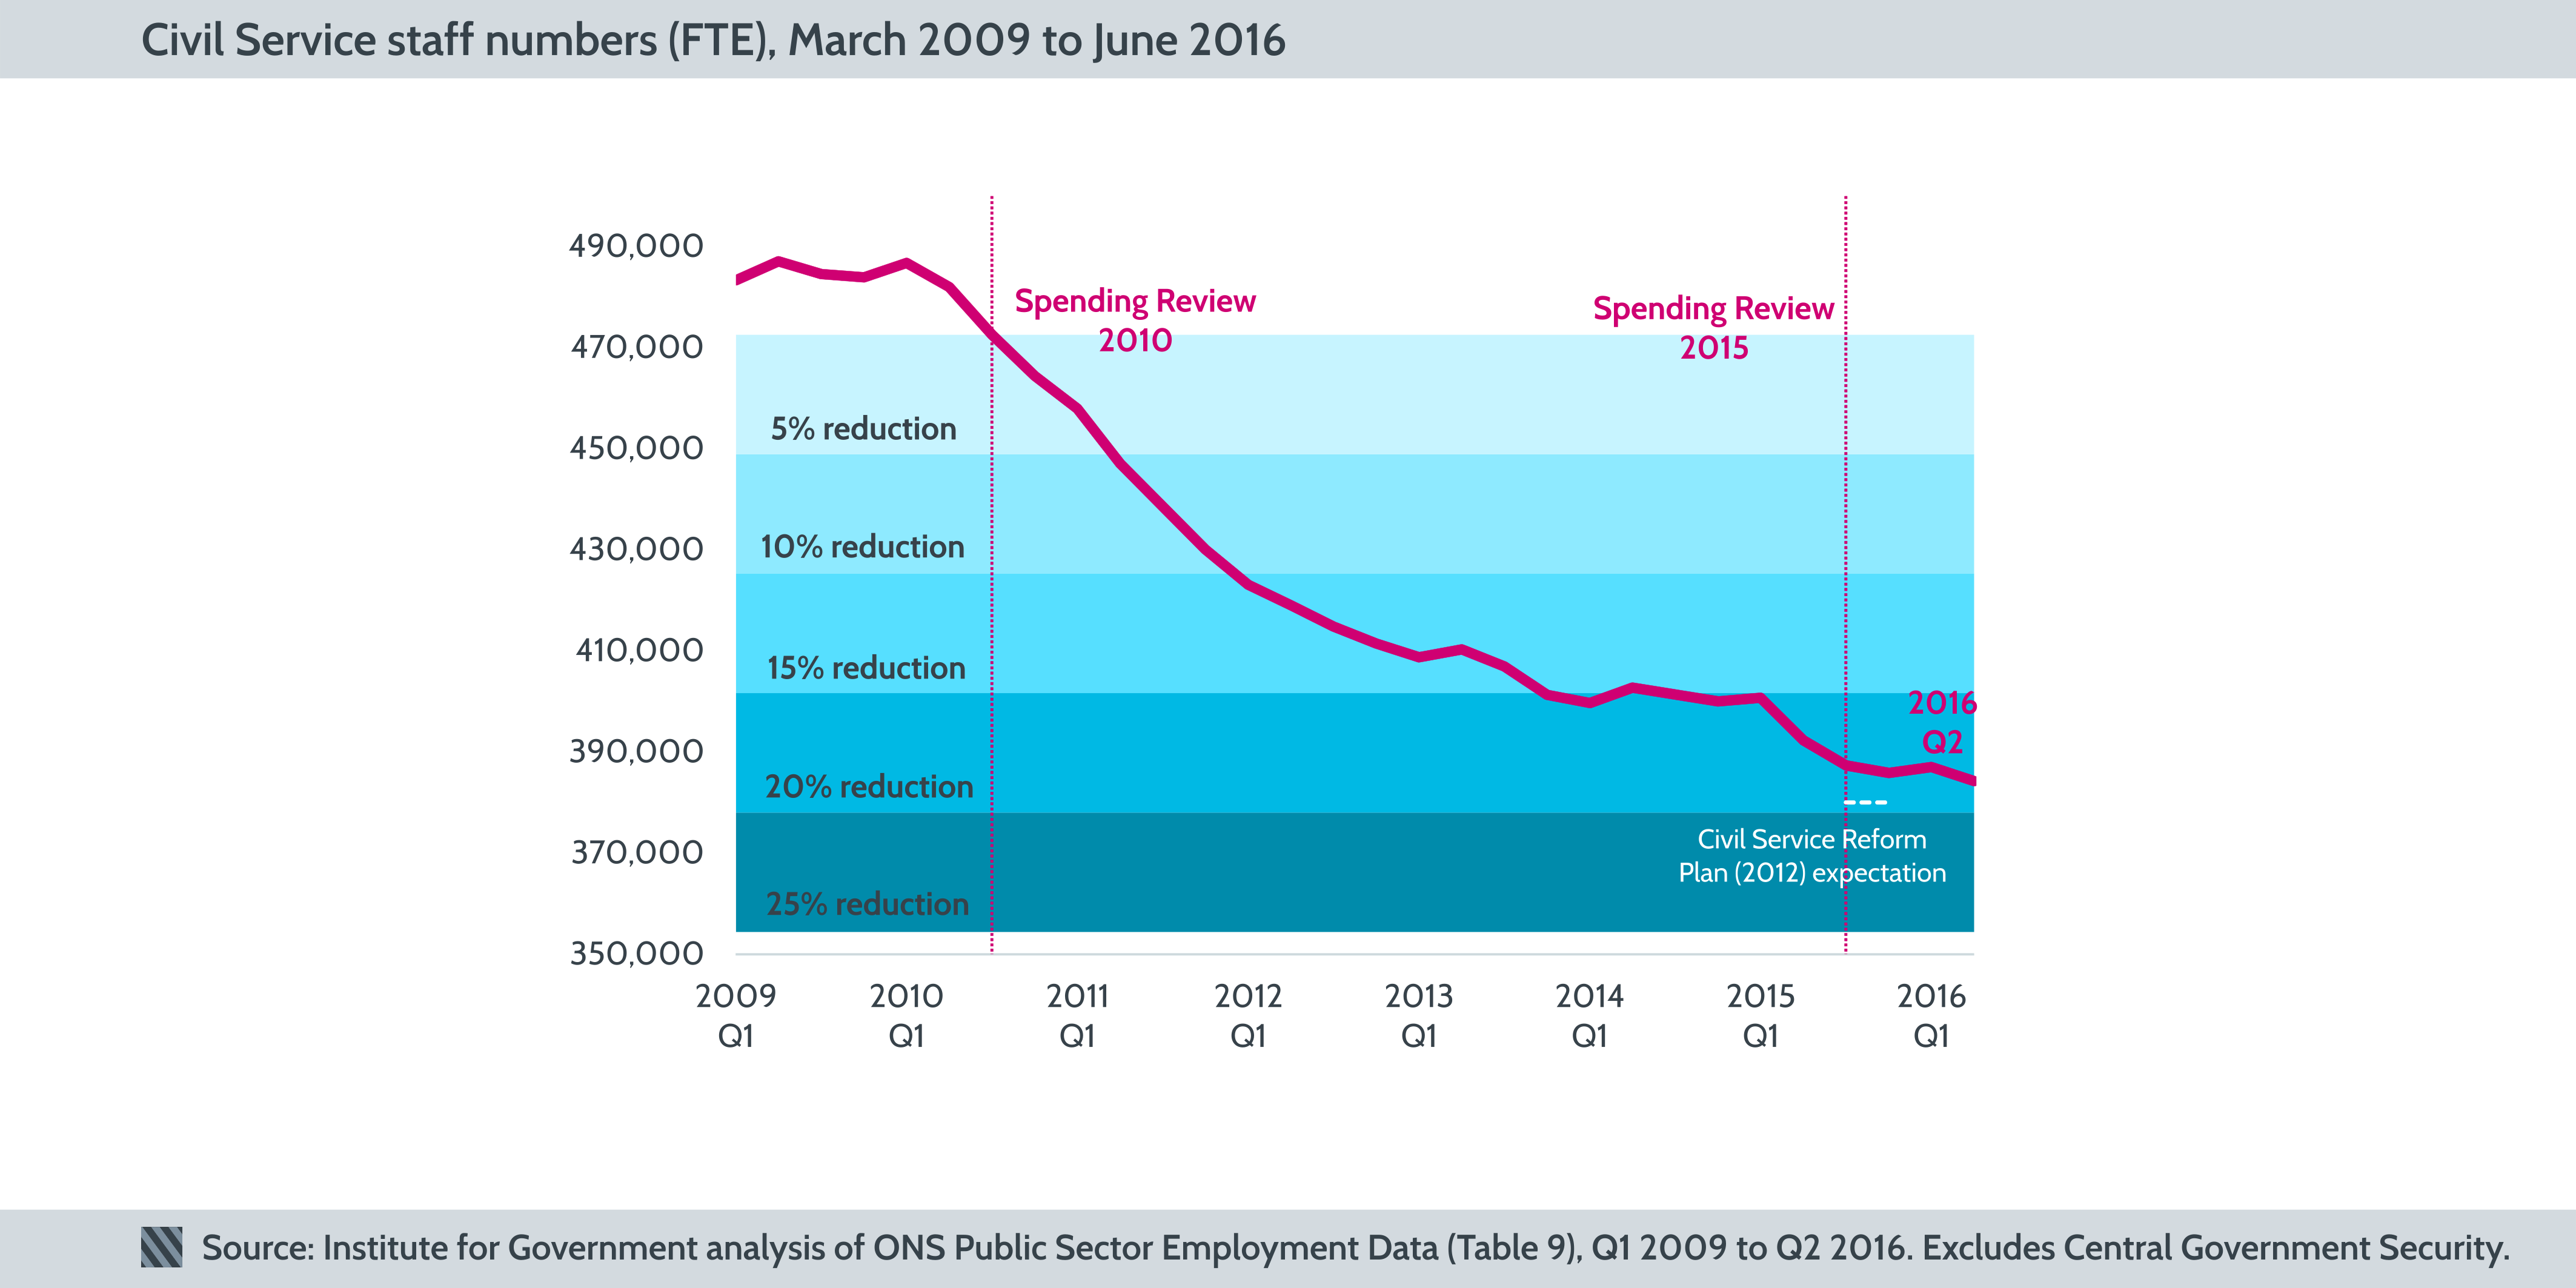
Since 2010, the Civil Service has become: Smaller. There were 386,620 civil servants in March 2016 (full time equivalent), down 20.5% from March 2010. That’s a difference of 99,820 jobs. A quarterly version of these figures, which actually take us up to June, shows the full scale of that reduction:

More female, but with women still outnumbered at more senior grades. The gender balance at the top of the Civil Service has improved, but still does not reflect the service as a whole.
54% of the whole Civil Service is female in 2016, up from 53% in 2010 (and from 46% in 1991). But women outnumber men at more junior grades, and remain underrepresented in senior roles. While the percentage of women making up the Senior Civil Service has increased – from 34% in 2010 to 40% in 2016 – women still make up less than half of Senior Civil Service (or equivalent) posts.
And in the next two levels down (Grades 6 and 7, and Senior Executive Officer/Higher Executive Officer level). Women outnumber men at more junior levels – 59% compared to 41% at Administrative Officer and Assistant level, and 57% versus 43% at Executive Officer level. More diverse in terms of ethnicity and disability. The Civil Service wants to improve representation of ethnic minority and disabled civil servants. But so far, despite initiatives such as the Talent Action Plan, there is still a long way to go.
In March 2016, 11.2% of civil servants were from an ethnic minority (where ethnicity was known), up from 10.6% in 2015 but below the 14% of the UK population that were from an ethnic minority at the 2011 Census. However, only 7% of Senior Civil Servants were from an ethnic minority in 2016, down from 7.2% in 2015. Having made significant progress in promoting ethnic minorities in 2014, numbers have plateaued ever since.
Disability representation follows a similar story. Across the whole Civil Service, the number of disabled employees has increased steadily since the mid-1990s, reaching 9.2% in 2016, up from 8.9% in 2015 (of civil servants who declared their disability status). In the Senior Civil Service, only 4.7% had a disability in 2016, up slightly from 2015 but below the 2014 figure of 5%. As with ethnicity, progress seems to have stalled over the past 2-3 years. In both of these measures – and to say nothing about the lack of data on LGBT status and the difficulties of measuring socio-economic background – the large percentage of ‘unknown’ responses (12.8% for ethnicity, 13.1% for disability) makes it more difficult for the Civil Service to measure its progress on increasing diversity. Older.
In 2016, 40% of the Civil Service was over 50 years old – that hasn’t changed much since 2015, but is up from 32% in 2010. Only 10% of civil servants are aged under 30, down from 14% in 2010. This ageing process is likely due to recruitment freezes and could have an impact on the types of skills coming into the Civil Service. More concentrated in senior grades.
In 2016, just 38% of civil servants were working in the most junior grades, down from 47% in 2010. Grades 6 and 7 – directly below the Senior Civil Service – now account for 10% of civil servants, up from 7% in 2010. The percentage of civil servants right in the middle – Senior and Higher Executive Officers – has also increased, from 20% in 2010 to 24% in 2016. Slightly more concentrated in London.
78,820 civil servants are based in London – that’s 19%, more concentrated than the 18% in 2015 and 16.5% in 2010 despite government attempts to spread the workforce. There are around 5,000 more civil servants in the South West than shown on the chart – these are the employees of the Government Communication Headquarters (GCHQ) who are now excluded from the numbers.

Please note: Central Government Security numbers are no longer included in the ONS Annual Civil Service Employment Survey for security reasons. We have adjusted our staff numbers chart and our location calculations to exclude these employees back to 2009 and 2010. They are still included in those other charts which look at composition of the Civil Service by percentage (i.e. grade, age, gender, diversity).

Administration
May government
Publisher
Institute for Government

Related content