Forecasting Government spending: why pointless numbers lead to pointless arguments
The debate so far has largely missed the fact that its starting point, the OBR’s deficit numbers, is the product of different assumptions.
Arguments over fiscal policy are coming two-a-penny at the moment. Yesterday’s debate on the Charter for Budget Responsibility was the latest instalment. Behind all this debate lie the Autumn Statement numbers, when the Chancellor made much play of the forecast that the UK would have a budget surplus of £23bn by 2019-20. Suggestions that this would be achieved by making drastic cuts to public spending caused a media furore. And more recently, this 'forecast surplus' has been put forward as the way to fund future tax cuts.
But the debate so far has largely missed the fact that its starting point, the OBR’s deficit numbers, is the product of different figures and different assumptions. If we are to have a sensible debate on the fiscal choices facing future governments then the way these numbers are constructed needs to change, so that different kinds of spending are treated consistently.
Squaring the circle – how the OBR shapes a forecast to fit the Government’s spending assumption
One of the Chancellor’s headline announcements in the Autumn Statement was that ‘by 2019-20 Britain is now predicted to have a surplus of £23 billion.’ The numbers behind this claim are produced by the OBR, and are the product of a series of inputs.
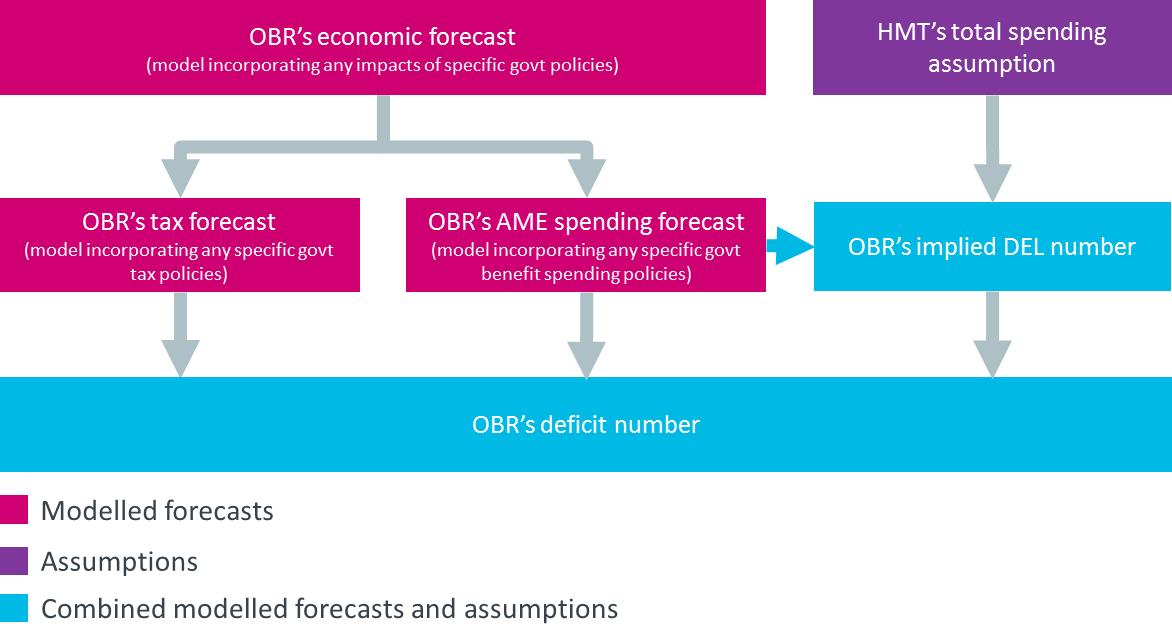
The first input is the OBR’s economic forecast, based on growth, employment and other external factors. The OBR develops this forecast irrespective of government policy, aside from policies that affect the macro-economic climate. The economic forecast in turn is an input into forecasts about such things as tax receipts and welfare spending.
The second input is tax revenue. The OBR calculates this based on existing Government policy – if no new policies are set out the OBR calculates its tax forecast by projecting current tax revenues forward in the light of the economic forecast. In the Autumn Statement the OBR forecast that by 2017-18 tax revenues will be £23bn lower than predicted in March 2014, largely based on the shortfall of tax receipts seen so far this year.
The third input is the OBR’s forecast is Annual Managed Expenditure (AME) – the spending that is classified as ‘demand-led’. In practice, the majority of AME is spending on social security benefits, tax credits and debt interest. As with its tax forecast the OBR bases its AME forecast on current Government policy projected forward. At the Autumn Statement, the OBR forecast that total welfare spending would increase by £34bn by 2020, a smaller increase in spending than predicted in March 2014.
There is a final chunk of Government spending which is included in the OBR’s numbers – Departmental Expenditure Limits, or DEL spending, which funds policy programmes and departmental running costs. The OBR treats this kind of spending completely differently to tax revenues and AME spending. For years not included in the last Spending Review (currently this means every year after 2015-16) the OBR takes an assumption from the Treasury on what total spending will be – an assumption that is explicitly not underpinned by any more detailed plans. The OBR effectively subtracts its forecast for AME from the Treasury’s total spending figure. The residual figure is the implicit DEL spending level feeding into the OBR’s calculation of the budget deficit (or surplus). This process, effectively driven by an assumption made by the government, is in stark contrast to the modelling and forecasting approach used for tax or AME spend.
Fitting the numbers to the Treasury’s assumption
So in practice, this means that the implicit DEL spending is often squeezed to account for projected increases in AME spend and falls in revenue from taxes – to deliver a desirable trajectory for the deficit. This is precisely what is happening within the OBR deficit numbers now: to accommodate increased AME spending and reduced tax revenues, the OBR methodology produced an ‘implied’ resource DEL spending figure of £257.7bn in 2019-20, £59bn less than overall real spending in 2014-15.
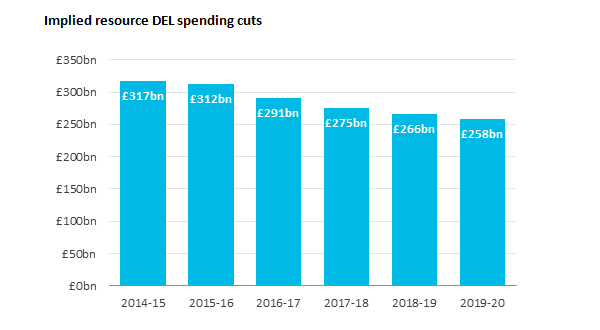
Source: Office for Budget Responsibility Economic and Fiscal Outlook Table F: Resource DEL Spending in real terms (December 2014)
The OBR, and many others, have openly questioned the credibility of these DEL figures. In December 2014 the OBR produced a further set of figures based on another assumption – that the current policies to ringfence spending on health, schools and overseas aid budgets would be maintained. It then took account of rising population growth. The assumptions produced the truly eye-catching number that spending in unprotected departments would be 57.3% lower in real terms per capita in 2019-20 than in 2009-10. The phrase ‘other DEL’ often obscures what is being talked about here, but this spending includes areas such as law and order, social care, housing and transport.
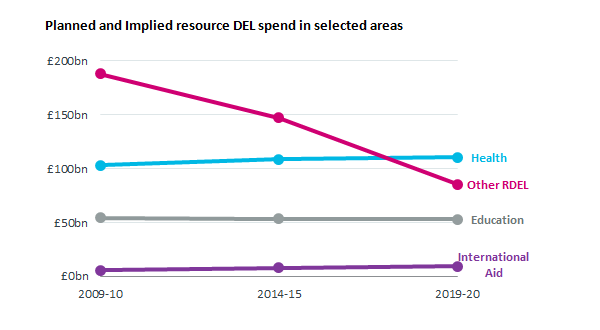
Source: Office for Budget Responsibility Economic and Fiscal Outlook Table G: Implied breakdown of RDEL in 2019-20 (December 2014)
These projected spending cuts caused a media furore. The Institute for Fiscal Studies warned that achieving the assumed reductions in total spending would require ‘cuts on a colossal scale’. The OBR said that the implied cuts in resource DEL would pose a ‘significant challenge if they were confirmed as firm policy’. The Chancellor in turn attacked the BBC for ‘hyperbolic’ coverage of the planned cuts.
What’s in and what’s out
The combination of two, radically different methods also means that the OBR’s deficit numbers include some, but not all, of the things that the Coalition parties say they hope to achieve in the future. The table below shows that the current political debate involves just about every possible combination of circumstances.
Ambition
Backed by tangible plans
Agreed by government parties
Included in OBR figures


  Reduce total spending as share GDP
No
No (not Lib Dem policy)
Yes


Raise £5bn from anti-avoidance measures
No
Yes
No


Freeze working age benefits for 2016-17 & 2017-18
Yes
No (not Lib Dem policy)
No


Cut overall benefits by £12bn (including freeze)
No
No (not Lib Dem policy)
No


Cut income taxes by £7bn by 2020
Almost (no date specified)
No (not Lib Dem policy)
No
Pointless figures lead to pointless debates
Using deficit numbers that combine economic forecasts with a partial set of Government assumptions is like combining chalk and cheese. The final deficit number published by the OBR is neither a realistic figure based on specific government policies (in the sense that they are backed by tangible plans), nor a fair representation of what the Government says it would do if re-elected. A more transparent methodology would be to treat DEL spending in the same way as AME and tax revenue – by assuming no change to current policies and producing a forecast based on the spending needed to maintain existing levels of provision. This would be challenging but not impossible. For example, forecasts on what the NHS will need to spend to maintain current levels of service are readily available and part of the public debate.
The OBR was established to encourage a transparent and open debate about public finances in the UK. It has proved to be a success establishing itself as a vital part of our fiscal architecture. But the way its numbers are produced, as recent events show, is confusing, rather than clarifying, the public debate.