Working to make government more effective

Comment

Counting down but not enough? The latest civil service staff numbers

The government will miss its targets, but there still has been significant change.

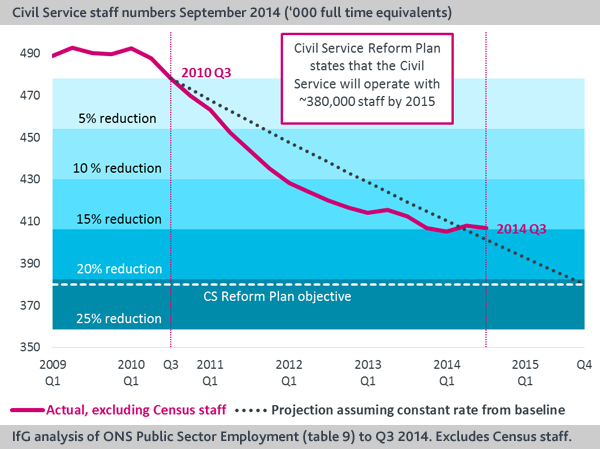
Today, the Office for National Statistics released the latest data for public sector employment, which report Civil Service staff numbers as of the end of September 2014. Petr Bouchal looks at what it tells us about the Civil Service, and how it relates to the government’s efforts to save money. He finds that the government is off track to meet its aspiration to downsize the Civil Service to some 380,000 full time equivalents (FTE) by 2015. But there has been a significant amount of change nonetheless. In the four years since the 2010 Spending Review, most departments have reduced their staff numbers by between 15% and 30%.

The civil service now employs 406,690 FTE, down 1,360 on the previous quarter.

Overall, the shape of the line in the chart above suggests that achieving the government’s aspiration regarding staff numbers has not been as easy as the early data suggested. In the first year after the 2010 Spending Review, the civil service made reductions that put it well ahead of the trajectory towards the government’s aspiration. Subsequent periods, and the last quarter in particular, show that the early momentum has not been sustained: some departments have been bouncing back and the brunt of the cuts is now borne by two large delivery departments. This is increasingly important if the government expects to rely on headcount reductions to meet the new savings target announced by the Chancellor in the Autumn Statement. In what follows, we look at departmental trends. Our previous blog posts on this data series explain how we have classified government organisations.

DWP, MoJ and HMRC all reduced staff numbers by hundreds

Most of the overall decrease in staff numbers in the last quarter was driven by significant cuts in DWP (down 1,090 FTE or 1.3%) and HMRC (down 1,590 FTE or 2.5%), which outweigh increases in several other departments. MoJ also made reduction (280 FTE, 0.4%), but the headcount in MoD has grown for the second subsequent quarter. Home Office – the last of the five large departments – has increased the size of its workforce by 690 (3%), the largest increase in an upward trend of the last 8 quarters.

Turning to the smaller departments, we see that several took on staff in the last quarter. DfID grew by 5%, with Defra, BIS and DH also growing somewhat. Other departments of comparable size – FCO and DfT – have made modest reductions.

HMRC reductions are accelerating, DWP continuing long-run trend

As the chart above shows, some of the increases seen in the latest quarter are continuations of long-standing trends: DfID took on new staff in all but one quarter since September 2010 and Cabinet Office has now been growing for two years. MoJ and DWP, on the other hand, have cut staff continuously. So has HMRC with the exception of one quarter, but it has accelerated its downsizing in the last year. Both departments at opposite ends of the spectrum – DECC’s continuing growth and DCLG’s deep cuts – appear to have stabilised.

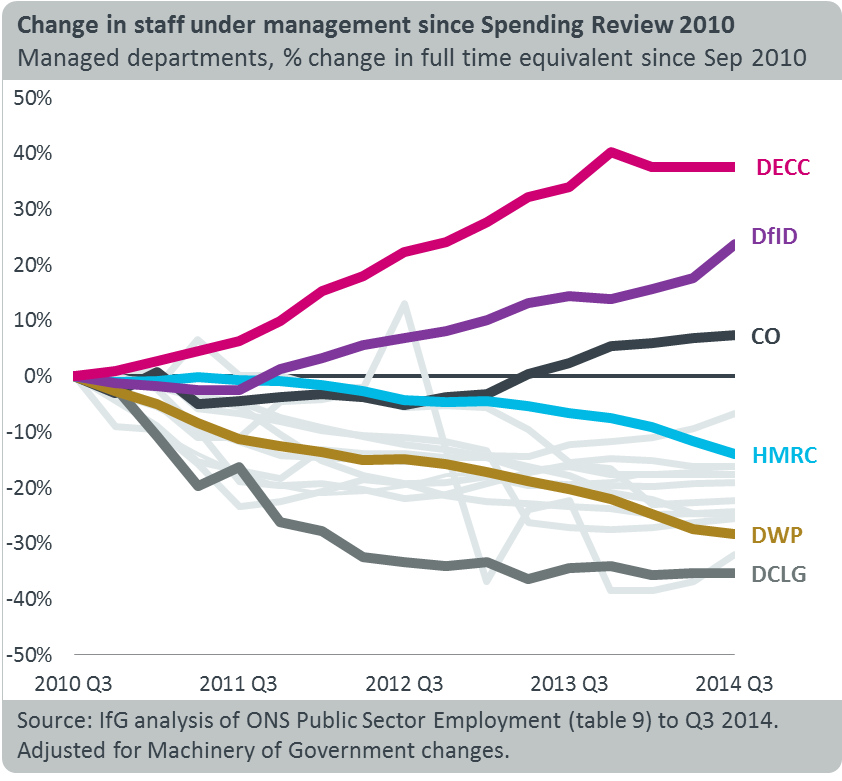
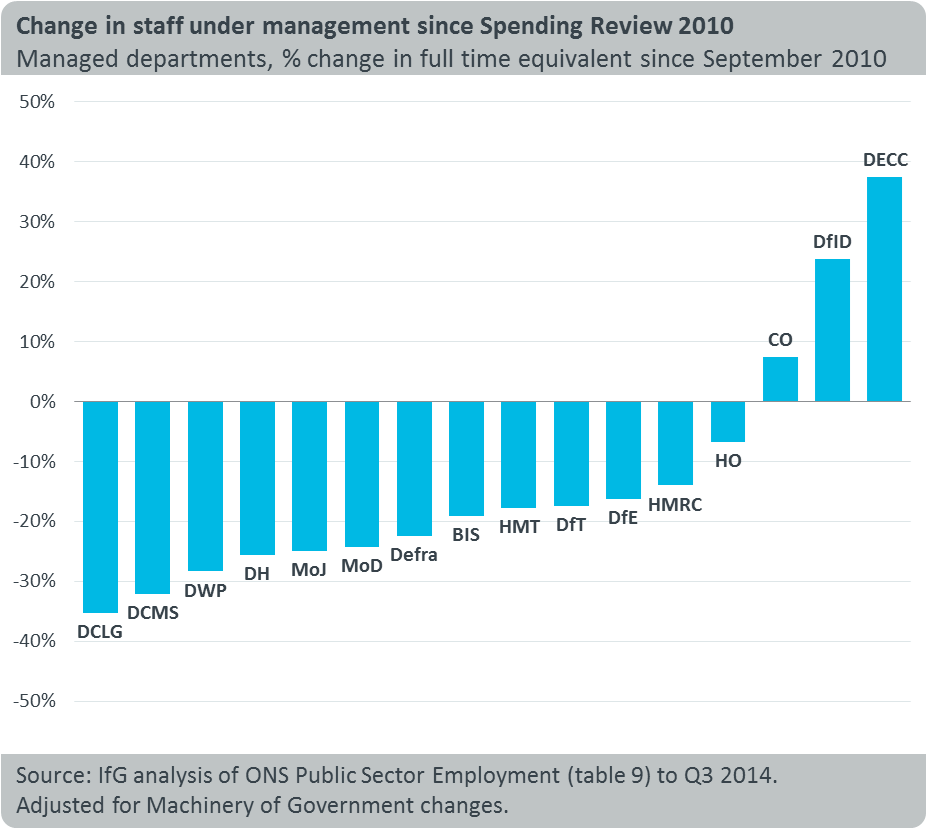
Five departments have reduced by a quarter or more, DECC has grown by almost 40%

Most departments have reduced their staff numbers by between 15% and 30% from the time of the 2010 Spending Review. DCMS and DCLG stand our as having made the largest reductions; DWP, DH, MoJ, MoD and Defra are all around 25% smaller than they were in September 2010. At the other end, DECC, DfID and Cabinet Office (CO) have grown – DECC has still been growing up to its steady state and CO has taken on functions.

Agencies typically reduced less than managed departments

The picture is broadly similar when we look at whole departmental groups – main departments together with the organisations they sponsor – with some variations. The growth in DECC appears more pronounced because of the Nuclear Decommissioning Authority. BIS and DWP have reduced their sponsored bodies more than the core department. The opposite is true of DCMS, DCLG, and DfT, where the departmental group as a whole shrank by less than the respective managed departments.

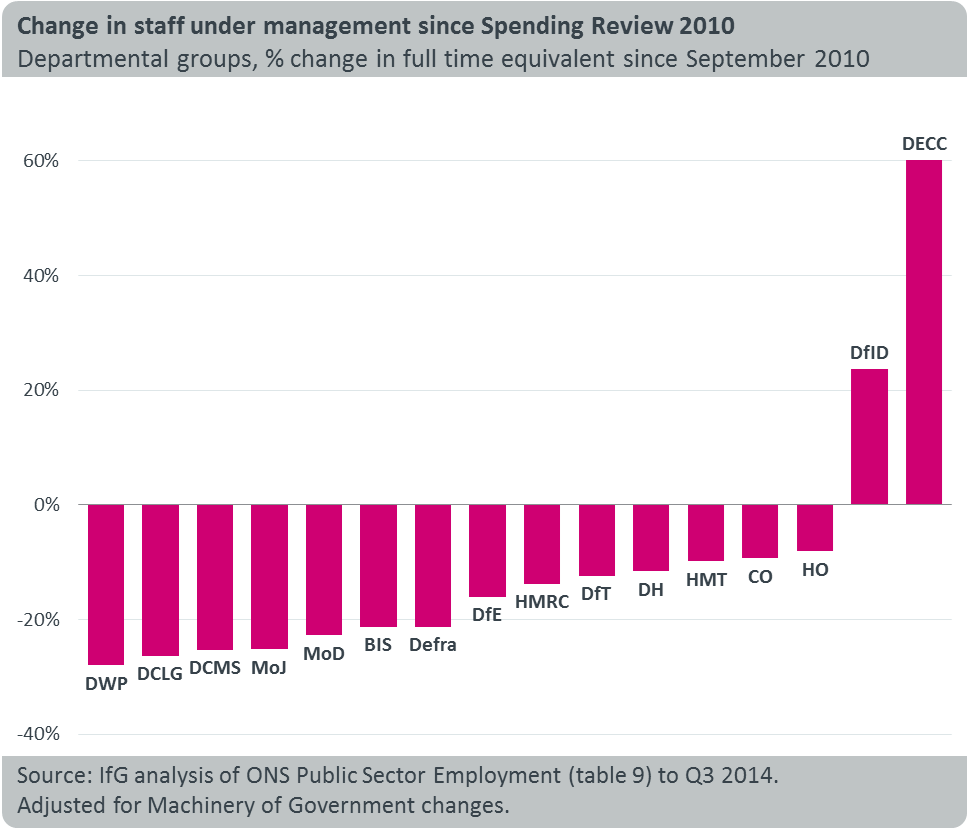
Civil Service workforce is dominated by large delivery departments

After three years of downsizing, the civil service is still dominated by the four large delivery departments with more than 50,000 staff each, most of whom are part of the managed department – although MoJ overtook HMRC as the second largest department in the previous quarter.

Related content