Working to make government more effective

Comment

The shape of the Civil Service

Remaking the grade.

The Annual Civil Service Employment Survey was published by the ONS to relatively little attention two weeks ago, but it contains a wealth of information about what the Civil Service looks like in 2014 and how it’s changed since 2010. We’ve already analysed the gender, ethnic minority, disability and age composition of the Civil Service – but what does it look like in terms of seniority and staff grades?

More recent analysis of Civil Service grades using 2015 data can be found on our blog.   Four in ten civil servants work in the administrative grades.
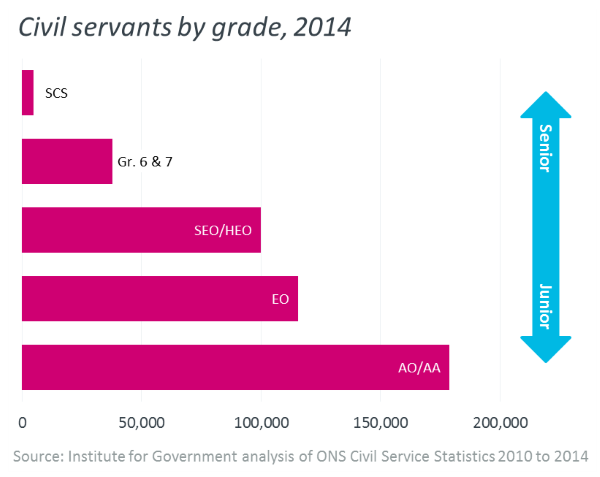
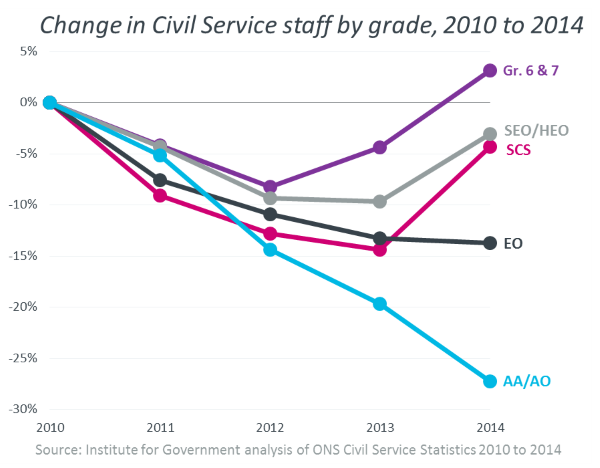
The majority of civil servants - 67% - are in the administrative grades (Administrative Assistant or Administrative Officer) or the next grade up, that of Executive Officer. In the middle, there are Senior and Higher Executive Officers. At 100,000, they make up 23% of the Civil Service. Further up the grade scale, staff in grades 6 and 7 – who do much of the ‘heavy-lifting’ on policy, just below the Senior Civil Service – account for 9% of the Civil Service. Finally, at the top of the scale, the Civil Service includes some 4,800 most senior officials - about 1% of the Civil Service. The lower, administrative grades have seen the deepest reductions since 2010 – Grades 6 and 7, towards the top of the hierarchy, have had a small increase.
The Civil Service employs a higher proportion of staff at senior grades than in 2010. This is because, first, the lowest grades have seen the sharpest cuts throughout this Parliament: the number of staff in the lowest grade fell by 27% between 2010 and 2014, in contrast to a 17% reduction across the Civil Service as a whole. In addition, the number of staff in the more senior grades has grown in absolute terms recently - the year to March 2014 was the first since 2010 in which the number of senior civil servants grew, although it has still seen a 4% reduction since 2010. The number of staff in the second most senior group – grades 6 and 7 – has grown by 3%, from 36,600 in 2010 to 37,800 in 2014. This change in the shape of the Civil Service could be driven by changing requirements in departments, but the pay constraint (two years of no increases followed by 1% increases) could also have contributed by creating pressure to promote staff or recruit at more senior grades when pay increases were unavailable. Most government departments are becoming more top-heavy.
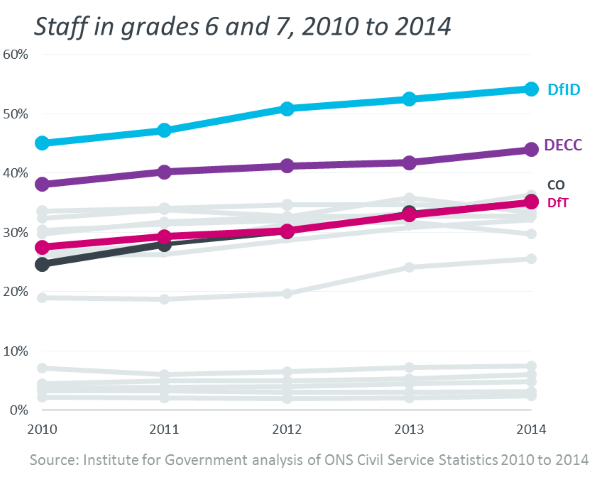
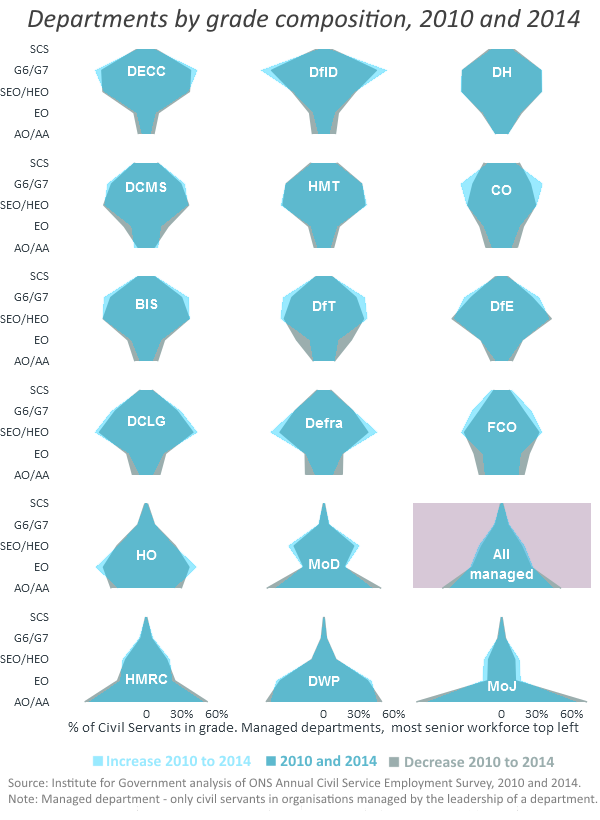
This trend is visible across departments - the proportion of staff at senior grades has increased in all departments but the Treasury and DH. The most pronounced changes occurred in DfID, DECC, DfT and Cabinet Office, where the proportion of staff at grades 6 and 7 - just below the SCS - increased markedly. In Cabinet Office and DECC, this could be the result of new responsibilities, and DECC and DfID seem to have concentrated the growth of their workforces in the senior ranks. The shape of different departments varies – and the large delivery departments drive the overall shape of the Civil Service.
Despite the shifts since 2010, we have seen that majority of civil servants work in lower grades. This overall dominance is a result of the composition of the large delivery departments. Many Job Centre staff in DWP (the biggest department) are in the lower grades, as is a large portion of tax officials in HMRC and prisons and probation officers in MoJ. Home Office, which includes the borders and immigration operations, also employs a relatively large portion of its staff at the lower grades. MoD looks similar in this respect. In most departments, however, staff are most likely to work in the middle ranks - Higher and Senior Executive Officer. In 10 departments, this is the single largest grade group, typically making up about a third of the workforce. Altogether, employees at this grade make up 23% of the Civil Service. A few departments - DECC, DfID, and Cabinet Office - seem particularly heavy on staff in grades 6 and 7. In DfID, for instance, they make up 54% of staff. DH, CO and the Treasury stand out as having a high proportion of senior civil servants - Cabinet Office has one senior civil servant for every nine in other grades, compared to DWP, which has one senior official for every 400 others. Altogether, this means that departmental leaders run organisations that differ quite a lot from each other. They might also need to get used to managing workforces that have more senior staff.

Publisher
Institute for Government

Related content