Working to make government more effective

Comment

Engaging with engagement

Part 1.

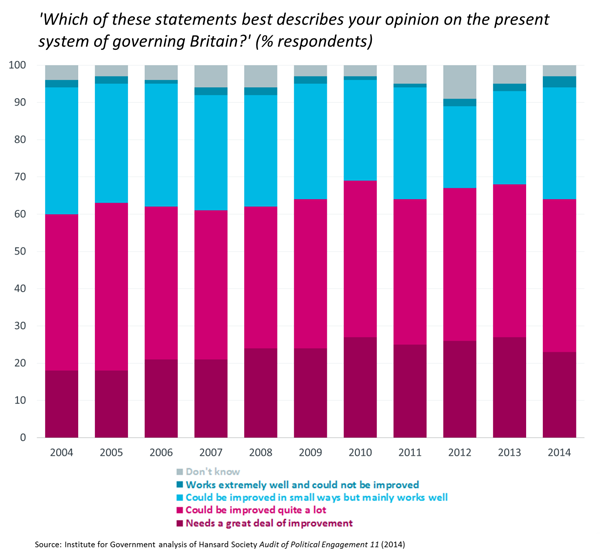
The Hansard Society has published its latest Audit of Political Engagement, its ‘annual health check on public attitudes to our democracy’. But can it tell us anything about public attitudes to the effectiveness of government?

The Hansard Society’s Audit of Political Engagement is one of our most valuable sources on public attitudes towards politics. This year’s Audit, published at the end of April, is full of interesting findings, from 49% of people being certain to vote in a General Election tomorrow (up from 41% last year but still the third lowest since the series began in 2004) to 74% saying that ‘politicians should be prepared to make personal sacrifices if they want to play a role in running the country’, described at the report’s launch by Lord Bew as an ‘emotional tax’. The nearest thing Audit 2014 has to a question on government effectiveness – or, rather, perceptions of government effectiveness – is: ‘Which of these statements best describes your opinion on the present system of governing Britain?’ Respondents were given four options: • ‘Needs a great deal of improvement’ • ‘Could be improved quite a lot’ • ‘Could be improved in small ways but mainly works well’ • ‘Works extremely well and could not be improved’.

It’s clear that most people – just under two thirds in Audit 2014 – thought the system could be improved ‘quite a lot’ or ‘a great deal’. The most popular answer, with just over 40% of people, was that there’s ‘quite a lot’ of room for improvement. Just under a third think the system mainly works well but could be improved in small ways – that number fell considerably in both 2010 (the report after the MPs’ expenses scandal) and 2012. Indeed, in both 2012 and 2013, more people opted for the most negative answer, that the system needs a great deal of improvement. The level of satisfaction – or rather dissatisfaction – is clearer if we combine the two broadly positive responses (‘works extremely well’ and ‘mainly works well’) and the two broadly negative responses (‘could be improved quite a lot’ and ‘needs a great deal of improvement’). The next graph shows the net percentage of respondents thinking the system needs improvement (excluding don’t knows).
The difference between those thinking that the system needs improvement and those thinking that it works well was particularly wide in 2010 (post-expenses) and 2012, although the gap narrows in 2014. How useful is this question for gauging perceptions of government effectiveness? There are important caveats. It’s not directly asking about government effectiveness, for a start, but there are further definitional issues. How do those surveyed interpret terms like ‘system of governing’, ‘works well’ and ‘need improvement’? Our thesaurus of respondents could be thinking about all of these things differently. ‘Working well’, for example, could simply mean that a respondent’s own political party happens to be in government. The 2014 Audit has some figures on this: supporters of Coalition parties are more positive. 60% of Conservative supporters and 42% of Liberal Democrats think our system of governing Britain works well, compared to 27% of Labour supporters and 31% of UKIP supporters. We can, tentatively, track this back further, since the Hansard Society has helpfully published its data tables going back to the first Audit in 2004.
The graph suggests that people are more likely to think our governing system works well if their party is in power: in 2008 under a Labour government, Labour supporters are more positive than Conservative ones (43% to 33%), but this has reversed by 2011 under the Coalition, when both Tory supporters (46%) and Lib Dems (33%) beat Labour (30%). Since 2010, Lib Dems are less likely than Tories to think the system is effective, although both are much higher than Labour supporters after a striking jump from 2013 to 2014. There are important caveats: • The data series is patchy, as the party breakdown is only given in 2004, 2008 (only Labour and Tory), 2011, 2013 and 2014 • The way that supporters of other parties and none are recorded changes from survey to survey • The surveys up to 2013 record ‘voting intention’ – 2014 records ‘political party support’ • The Audit has changed polling contractor during its lifetime – all of the surveys which record party political information were conducted by Ipsos MORI except for 2013, conducted by TNS (the changes are discussed at length on page 81 of Audit 2014) • The base number of Lib Dems is small and so should be treated cautiously. Nonetheless, it suggests that a question about satisfaction with the system of government could be a proxy for party political affiliation – it would be interesting to see if the same is true of other surveys on concepts like effectiveness and trust.

Related content

19 APR 2024 Podcast

Trust in government up in smoke?

Polling expert Will Jennings joins the podcast team to discuss what legacy Liz Truss has left the Conservatives in the polls.