Diversity in the Civil Service
More key trends.
Tuesday’s speech by Michael Dugher MP, Labour’s Shadow Cabinet Office Minister, highlighted a number of diversity issues in the Civil Service and outlined some of Labour’s plans to address them. The day before he, and Shadow Equalities Minister Gloria de Piero MP, published a more detailed comment piece on The Huffington Post.
Labour were right to highlight these diversity issues. As our analysis also shows, they are real and visible:
- Although there has been sustained improvement in the representation of women in the higher ranks, the gap is still sizable. Ethnic minority staff are still under-represented as a proportion of the Civil Service. This is especially pronounced in the senior ranks, and there has been virtually no progress recently.
- The record of appointing women and ethnic minority candidates to the top job is very patchy.
- When people with working class backgrounds and non-Oxbridge degrees enter a fast stream competition they, as well as ethnic minority candidates, are less likely to get a place on the scheme than others.
We provided figures on some of the key trends in a recent blog. In some cases we ended up with different numbers from Labour, and thought it would be helpful to explain why that might be and also to provide some more factual background. It is important to have a clear, evidence-based picture of the problems and whether they have been getting better or worse. In the absence of that, politicians or leaders in the Civil Service might be addressing the wrong problems. Gender We said that the proportion of women in the Senior Civil Service rose between 2010 and 2013. We calculated this using ONS’s Annual Civil Service Employment Survey data, published in October 2013. 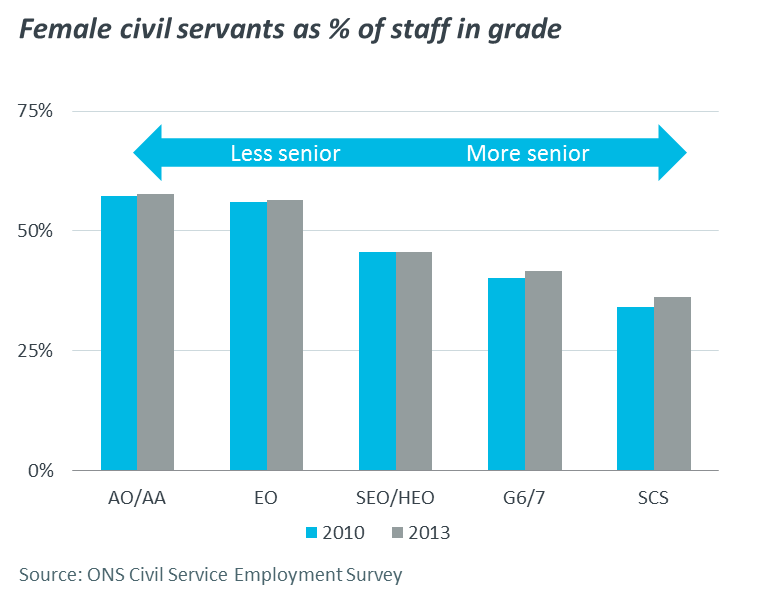 Labour presented a different figure based on the same underlying data, pointing out that the number of women holding senior civil service posts has fallen by 9%. This is true, but with the number of senior civil servants being cut by around 10% between 2010 and 2013, it is inevitable that in absolute terms, there are fewer women in the Senior Civil Service, although the number of senior men has dropped even more. The proportion of women in the senior ranks has therefore risen.
 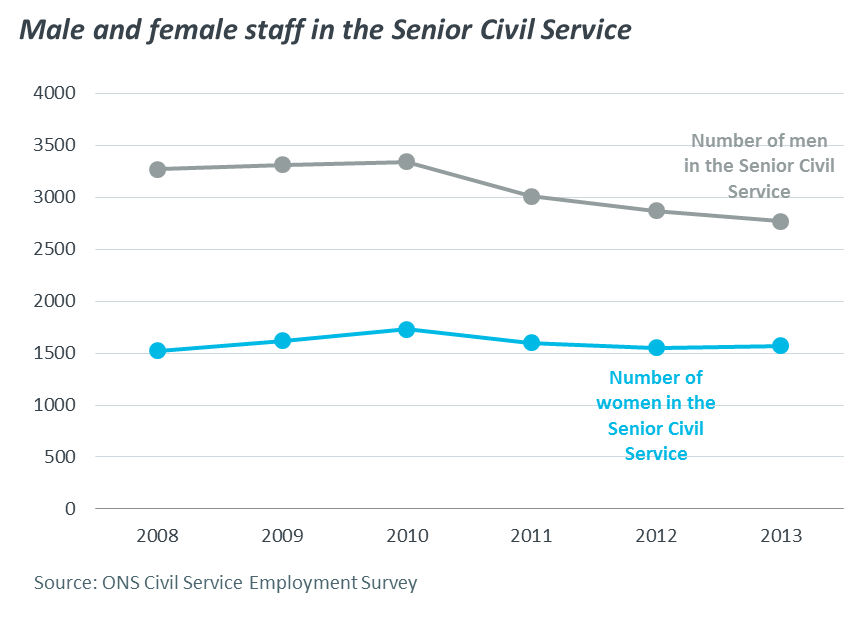 Both our analysis and Labour’s showed that as things stand, only 29% of the highest paid civil servants are women, whereas 64% of the lowest paid are. However it is also useful to look at the distribution of earnings for male and female civil servants. The median gender pay gap is still substantial, even though between 2010 and 2013 it has narrowed from 15.1% to 13.6%, with median pay and pay at the upper quartile point rising further for women than for men.
 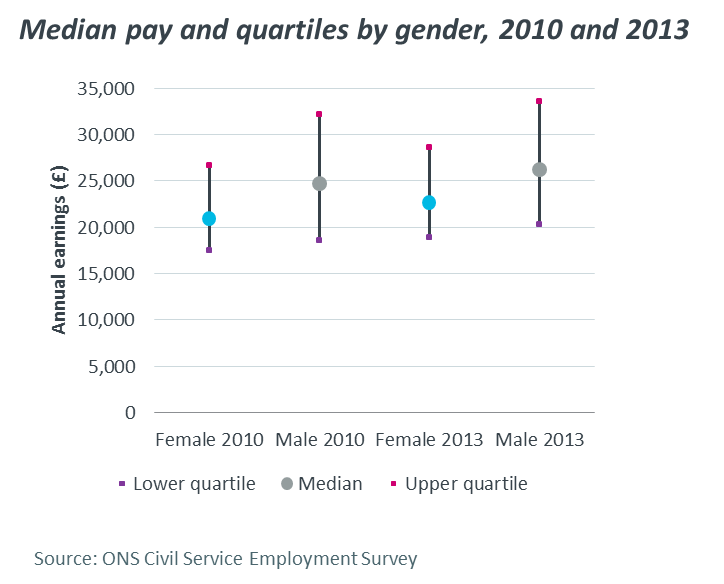 Labour also used figures on the Cabinet Office, showing a drop from 43% of senior civil servants there being women in 2010 to 39% last year. We arrived at the same figure, but also found that the proportion of women in senior ranks varies widely across departments. While it is still low in many of them, most departments – 13 out of the 17 – have seen an increase since 2010. The Ministry of Justice has seen the biggest drop since 2010, while DCMS reported the biggest increase. Some departments, such as DfE and DCMS, have consistently had high proportions of senior women, while the Foreign Office and the Ministry of Defence, which have had longstanding problems with gender balance in their senior ranks, have improved.
 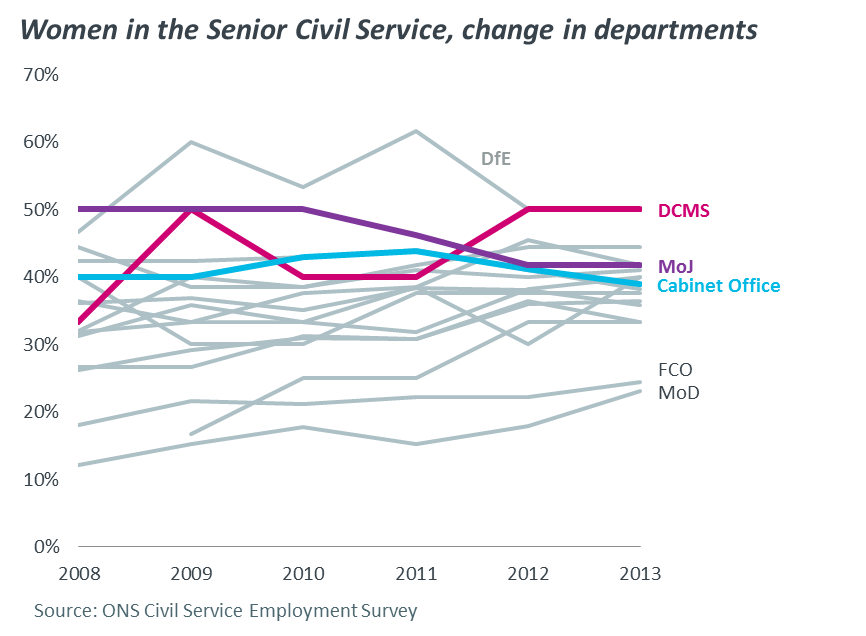 Ethnicity - total In our recent blog we said that the proportion of ethnic minority staff in the Civil Service has increased slightly to 9.6% in 2013 from 9.2% in 2010. Again, this calculation relies on ONS data. Labour used the same figures. They also suggested that in the three years before the 2010 election, ethnic minority representation increased by 11%. They then say that it has fallen by 10% since 2010. As with the point about women in the Senior Civil Service above, this is true in terms of how the numbers of staff have changed. In 2007, there were 34,040 ethnic minority civil servants; this increased to 37,810 in 2010 – an increase of 11% - and fell to 34,080 in 2013 – a drop of 10%. But as the figure below shows, between 2010 and 2013 the Civil Service as a whole has shrunk by some 10%, so the proportion of staff from ethnic minorities in the Civil Service has seen a small increase.
 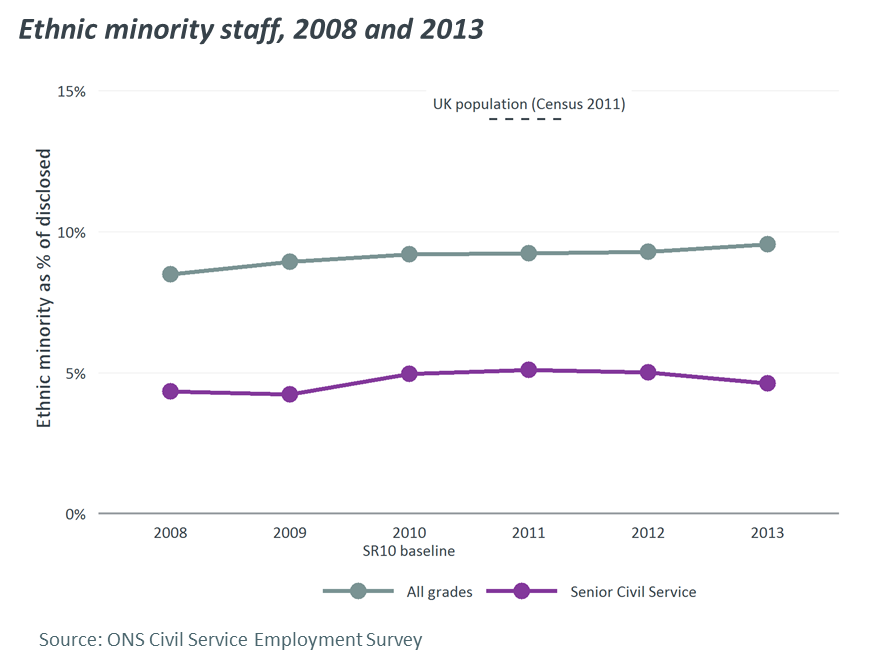 Ethnicity – entry to the Civil Service Labour looked at who enters the Civil Service – specifically through the fast stream programme, which recruits future senior leaders. Labour say that ‘there is a significantly lower proportion of successful applicants from Black and Minority Ethnic backgrounds compared to the eligible graduate pool’. The available data confirms this. The proportion of fast stream applicants who are BME is 16%, lower than in the student population (the Higher Education Statistics Agency says that ethnic minorities made up 20% of undergraduates in 2012/13). The success rate of ethnic minority candidates is lower compared to white applicants, although the gap has been narrowing. This means that only 12.5% of fast streamers recommended for appointment are from an ethnic minority.
  Socio-economic status Labour noted the similarity between the picture for BME fast stream applicants and working class applicants. Our analysis of fast stream recruitment figures, looking at all fast stream schemes (combining the generalist graduate fast stream and the specialised fast streams) suggests that working class applicants are less likely to succeed in a competition than candidates from other socio-economic backgrounds. In the 2012 competition, 7% of applications came from candidates with working class backgrounds and fewer than 4% of those recommended for appointment came from this stratum. Worryingly, this under-representation is even more pronounced in the generalist graduate fast stream. Labour contrasts this with appointments of candidates from Oxbridge. The fast stream figures show that their success rate is higher compared to candidates from other universities. The gap has narrowed over the last decade or so, with an uptick in 2012. It should also be noted that there could well be an overlap between these two groups: some graduates who have attended Oxbridge come from ‘working class’ families.
  Over time, the number of Oxbridge-educated fast streamers has stayed constant even as the Fast Stream expanded. This means that the typical fast streamer today is less likely to have studied at Oxbridge than would have been the case ten or fifteen years ago – though Oxbridge graduates still make up around 9% applications and 27% of appointments.
 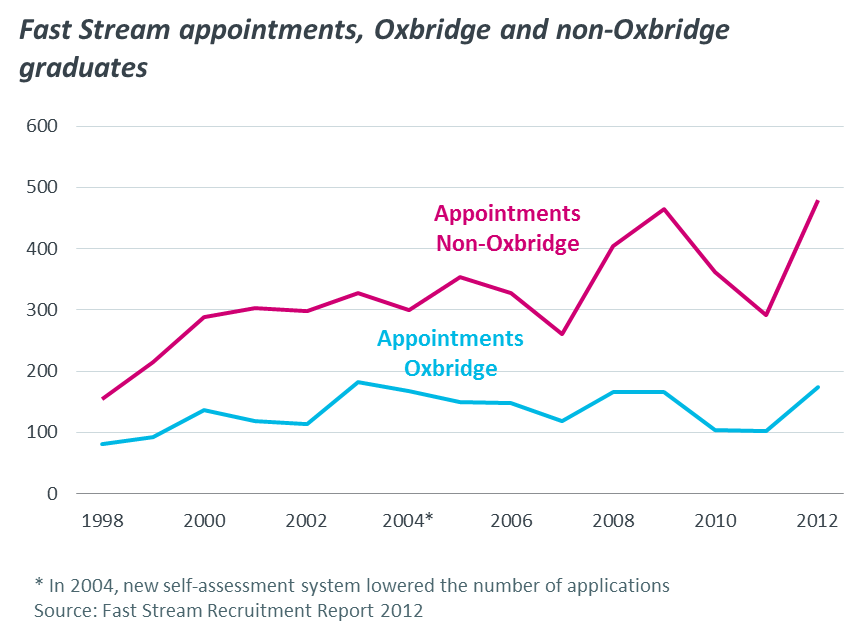 This analysis should provide politicians and civil service leaders with a better picture of the diversity problems they need to address.