A contracting sector
Government contracts and voluntary organisations.
Three key graphs show the changing relationship between the government and the voluntary sector – and highlight the need for better data across government
Last week, the National Council for Voluntary Organisations (NCVO) published its UK Civil Society Almanac for 2014, full of interesting data on the voluntary sector and civil society. First published in 1996, the Almanac is a great example to all of us involved in data-driven projects about how to present information in a useful, exciting and accessible way. But it also has some especially interesting data around government funding of the sector and, in particular, the move from government giving grants to contracting services.
In three key charts, the NCVO shows:
1. Government funding for the voluntary sector dropped by £1.3bn from 2010/11 to 2011/12.
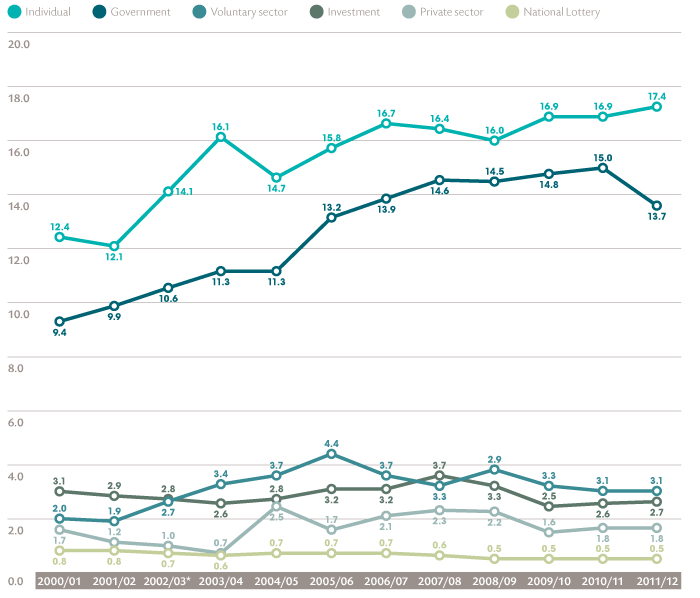
Though it remains, by some distance, the second biggest source of income after individual giving.
2. The voluntary sector receives four times more money from government through contracts to deliver services than from grants, although both sources declined in 2011/12.
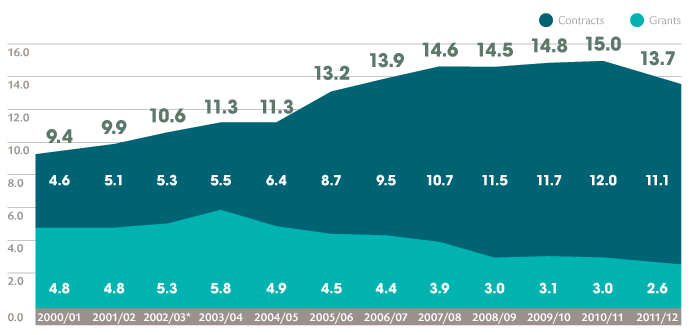
(Grants are voluntary income, essentially given as a gift – contracts are earned income, with an organisation providing a service.)
3. The cuts varied across different categories of voluntary organisation.
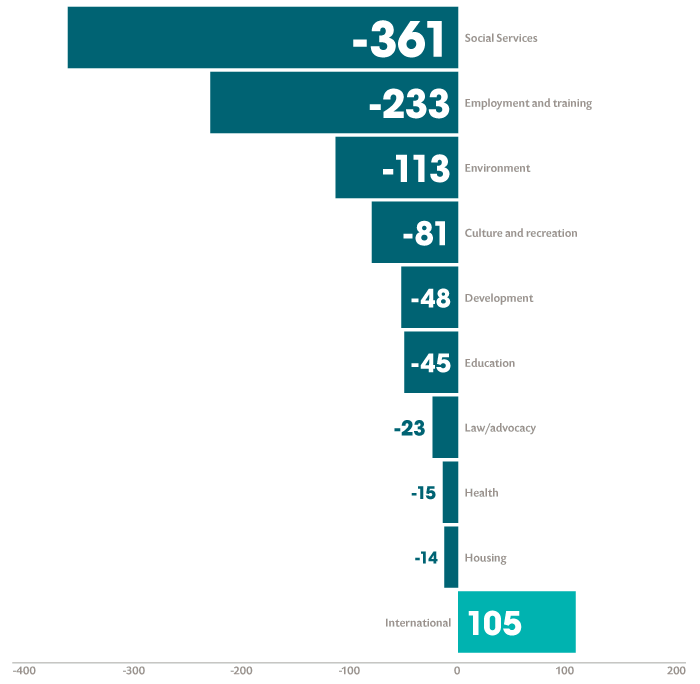
Those sectors in areas protected by the government from its own spending cuts – education (schools), health (NHS) and international aid – did not lose as much in absolute terms. (It’s worth pointing out, though, that half of voluntary sector income from government comes from local government.)
The NCVO’s data comes from a sample of annual accounts submitted by voluntary organisations to the Charity Commission. As such, it doesn’t give us the whole picture and the most recent data is from 2011/12. But it is still one of the best data sources we have on the value of government contracts in the UK.
As the Institute has found from our own work on public service markets, it’s difficult to find out a lot of basic details about this increasingly important part of government spending and the overall economy:
- One of the key figures on money given to independent providers – £1 in every £3 spent on public services – is an estimate from the Department for Business, Innovation and Skills in 2008.
- Although the government has made strides in publishing information (such as its Contracts Finder website), it’s often not in an easily usable form and requires a great deal of work (from start-ups like Spend Network) to analyse it in a useful way
- Even the National Audit Office (NAO) is forced to rely on estimates from a variety of partial, inconsistent and incomparable sources.
In its recent reports on managing government suppliers, the NAO estimated that around half of the estimated £187bn spent by the public sector on third party suppliers was through contracting out services. As we have previously highlighted, there are many challenges around contracting out public service markets, from departments lacking the necessary commercial skills to providers in the voluntary sector becoming increasingly reliant on lopsided partnerships with large private sector providers. But greater transparency and more information from government would help us understand exactly what’s going on. And transparency should be a matter of course – none of us should have to rely on charity.