Payday: Civil Service salaries
With earnings in Whitehall likely to remain a hot topic following November’s Spending Review, Ollie Hirst takes a look at the latest data on pay from the Civil Service Employment Survey.
See our explainer for our more recent analysis of civil service pay.
November’s Spending Review reaffirmed the Government’s commitment to funding public sector workforces ‘for an average pay award of 1% for four years from 2016/17 onwards’, as announced in the Summer Budget and discussed in the Institute for Government’s Managing with Less report. This blog looks at pay in the Civil Service, which makes up around 9% of total public sector employment. Despite a degree of flexibility for government departments in managing pay, the latest measures represent a general extension of pay restrictions, with the objective of continuing to reduce staff costs across Whitehall.
Between 2010 and 2014, annualised Civil Service salary costs decreased by around £2.5 billion.
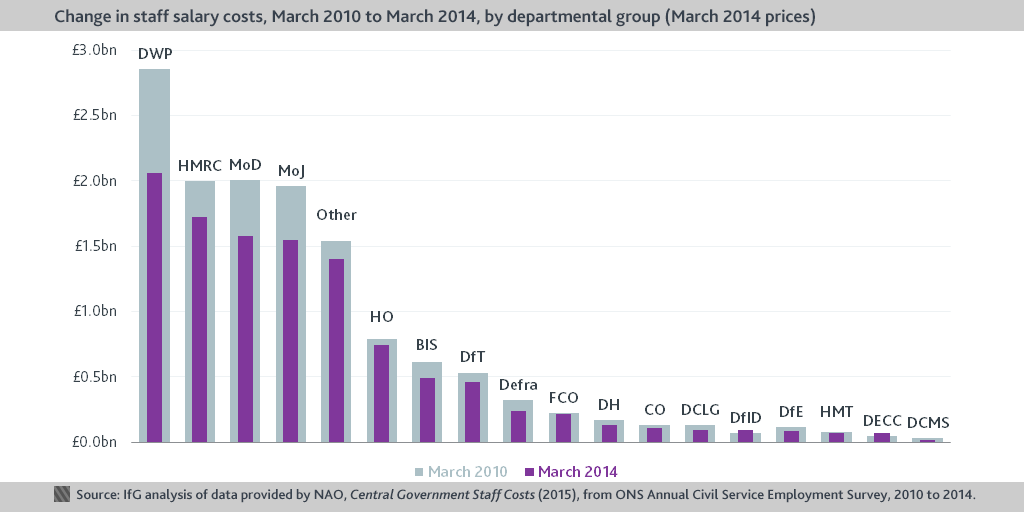
During the last parliament, a combination of pay freezes and the removal of automatic increases (“progression pay”) – as well as, most importantly, recruitment freezes and headcount reductions – contributed to decreased annualised salary costs in all but two government departments. Across the whole Civil Service this amounted to £2.49bn in real terms, according to estimates by the National Audit Office (NAO), of which reductions in staff numbers accounted for £2.29bn.
The largest change was in DWP’s departmental group, which experienced a 28% reduction of salary costs from 2010 to 2014. Nevertheless, as the latest Civil Service pay guidelines state, the public sector pay bill still makes up over half of departmental resource spending, and so managing the pay bill continues to be central to the Government’s plans for fiscal consolidation.
Civil servants in DfID have the highest median income, while those in HMRC and DWP have the lowest.
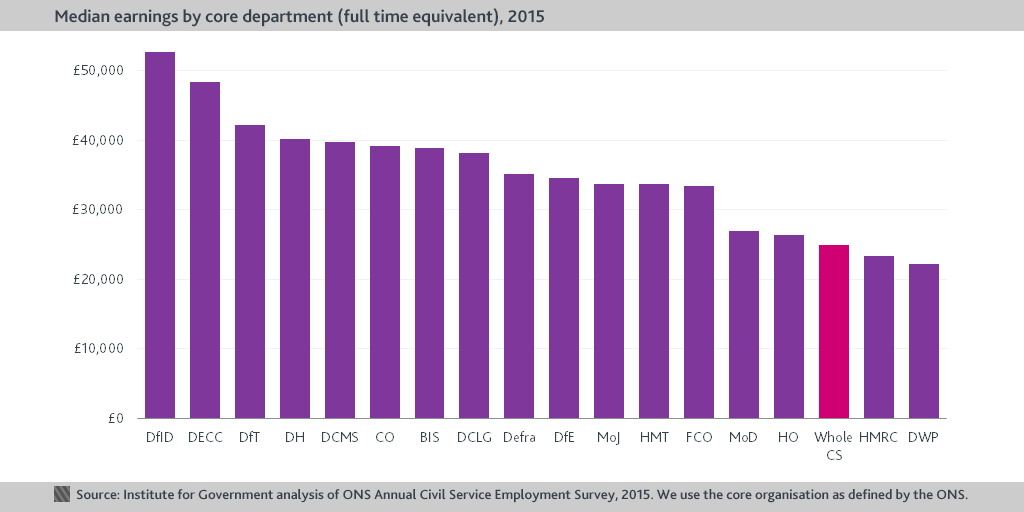
Average pay across the whole Civil Service was just under £25,000 in 2015. However, there is a wide range of earnings between departments; the highest departmental median (DfID: £52,700 per annum) is almost two-and-a-half times the lowest (DWP: £22,120).
As our analysis of the latest Civil Service People Survey has found, civil servants are generally unhappy with these earnings; pay and benefits is the theme with the lowest engagement score in 2015 (30%), a trend likely to persist given continuing pay restrictions.
DWP has the most staff paid under £30,000; DECC has the fewest.
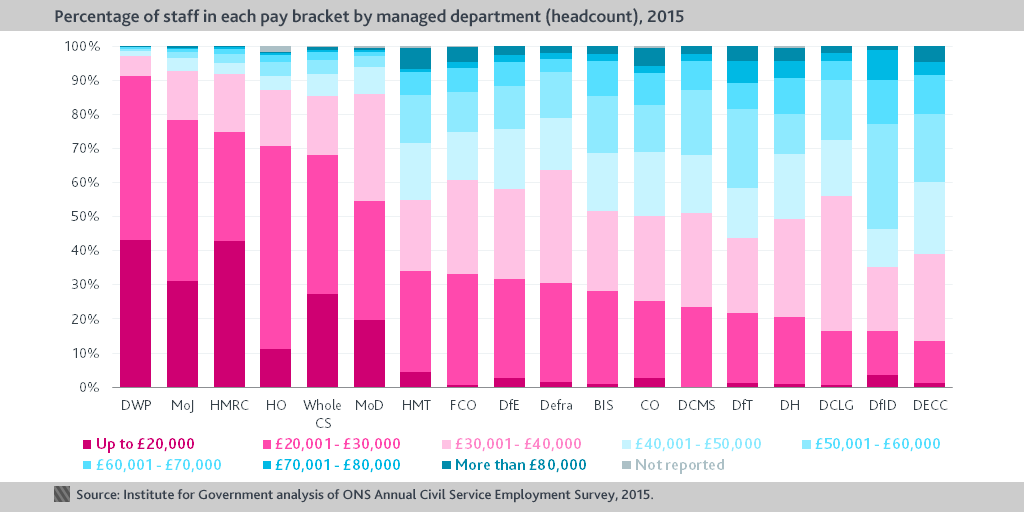
- Over 91% of DWP’s staff are paid under £20,000 or £20,000 to £30,000, compared to only 13% in DECC and 16% in DfID and DCLG, the departments with the smallest proportion of their workforce in these two lowest pay brackets.
- The five largest departments – DWP, HMRC, MoJ, MoD and HO – are the only departments with a majority of their staff earning less than £30,000. This follows from the grade make-up of these delivery-focused departments, with a large proportion of staff in on-the-ground positions at the more junior Administrative Officer/Administrative Assistant (AO/AA) and Executive Officer (EO) grades.
- At the other end of the scale, DfID and DECC are the departments with the largest proportion of their workforce earning more than £60,000; 23% and 20% respectively. The department with the largest proportion of its workforce paid more than £80,000 per annum is the Treasury, where 70 civil servants (6% of its staff) are in this pay bracket.
Even within grades, there is a wide range of average earnings across Whitehall.
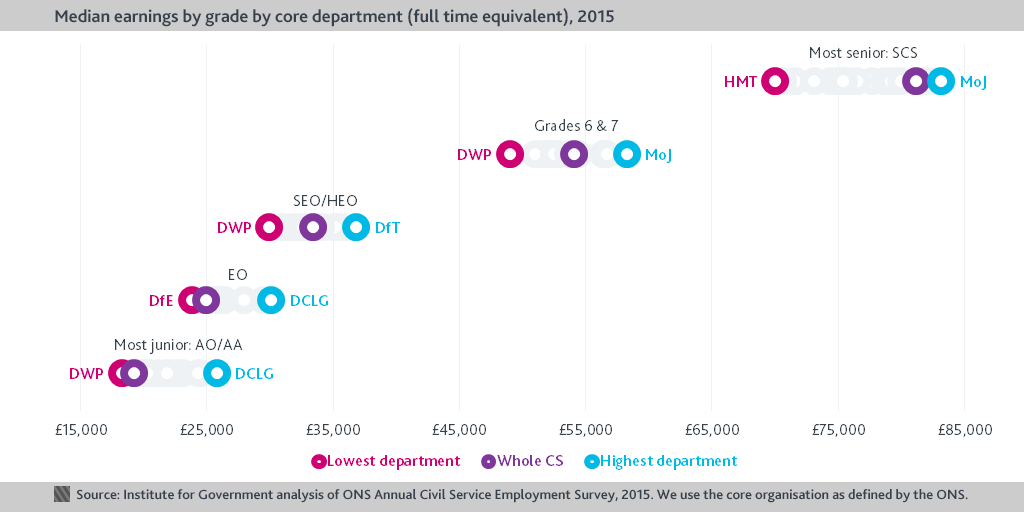
Subject to compliance with the Treasury’s Civil Service pay guidance and approval by its responsible secretary of state or minister, each department is able to tailor pay scales and reward strategies to meet its own particular needs. This produces widely different pay shapes and scales across government departments.
- While DWP’s low median earnings are correlated with its large proportion of junior staff, they are also a result of lower average pay within each grade. Civil servants at the AO/AA grade in DWP have lower earnings, on average, than those at this grade in every other department; their median annual pay is £18,320, in comparison to £25,850 for the highest-earning Administrative Officers and Assistants (in DCLG). DWP staff at Senior Executive Officer/Higher Executive Officer (SEO/HEO) level and Grades 6 and 7 are also the lowest paid at these grades in any core department. This may in part reflect where civil servants are based, with more decentralised departments employing a smaller proportion of their staff in higher-paid (and higher-cost) London.
- The widest range of pay is at the most senior level, with a difference of over £13,000 between the average earnings of the highest-paid Senior Civil Servants (in MoJ) and the lowest (in the Treasury).
During the last parliament, the Public Administration Select Committee found broad agreement among its witnesses on the failure of the Government’s current policy on Civil Service pay, particularly salary caps at the most senior positions which, it was claimed, limit Whitehall’s ability to attract and maintain expertise. However, since 2013, reduced restrictions have led to wider pay bands and more freedom for departments to determine allowances and bonuses to reduce turnover and retain talent. The risk is that this compounds the internal competition between departments which, as a recent report from Policy Exchange suggests, often adds to the problem of retaining talent.